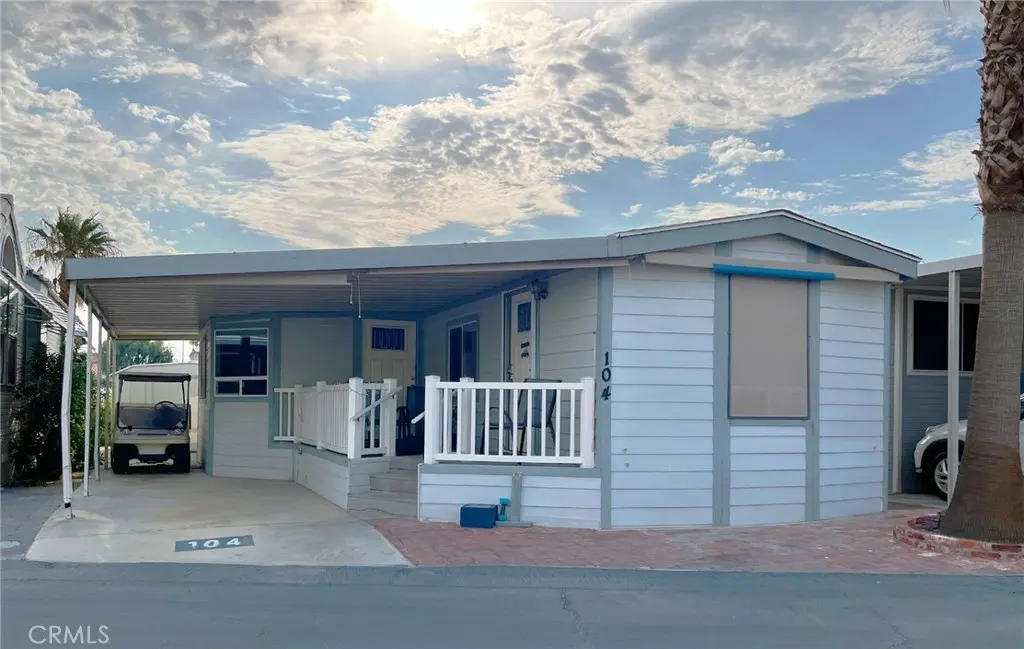
69801 Ramon Rd #104 · Cathedral City, CA
Flood risk 1/10 · Minimal
- FEMA flood zone
- X (unshaded)
- Chance of flooding over 30 yrs
- 0.0%
- Est. flood insurance / yr
- $507 – $1,088
Fire risk 1/10 · Minimal
- Est. fire insurance / yr
- $659 – $1,223
Heat risk 9/10 · Severe
- Hot days now (above 113°F)
- 5 days/yr
- Hot days in 30 yrs
- 15 days/yr
Wind risk 1/10 · Minimal
- Chance of severe wind over 30 yrs
- —
Air-quality risk 4/10 · Minor
- Unhealthy air days now
- 5 days/yr
- Unhealthy air days in 30 yrs
- 7 days/yr
Risk factors via First Street. Map © Google.
Why this score? — see what drove the B- grade
The composite is a weighted blend of 9 inputs, each scored 0–100. Each bar is that input's sub-score; the figure is the points it added to the 100-point composite (weight × sub-score).
- Cash flow +28.4/30.0
- 1% rule +10.0/10.0
- DSCR +10.0/10.0
- ARV discount +6.8/15.0
- Rent growth +3.3/5.0
- Livability +3.3/5.0
- Schools +2.7/10.0
- Condition / age +2.5/5.0
- Appreciation +0.0/10.0
$134,900
🖨 Deal sheet (PDF) 📄 Offer letter ✓ Due diligence
Listing remarks MLS
Must See Park Model in the highly sought after 55+ Seasonal Living "Desert Shadows RV Resort"! You Own Land! Grant Deed Lot with Water, Cable, Trash, and common area included in HOA! 2 bedroom (utilizing the additional "California Room"!) Amazing amenities in this fabulous oasis! 2 large & well-maintained clubhouses plus 3 additional satellite clubhouses, An indoor pool with a large spa and sauna, An olympic-size lap pool, A total of 6 pools, 5 spas and 3 saunas, Sunken, lighted tennis courts, 8 Pickle-ball courts, An indoor shuffleboard pavilion, 16,000-square foot San Jacinto room with floating hardwood dance floor, and a professional stage, plus a large kitchen, A 3,000-square foot “Our Gang” party room and lounge with a giant fireplace and kitchen, A huge party terrace with mountain views, A fully equipped fitness center, A dance studio, Library, Billiards room, Horseshoe pits, Several laundries, restrooms and bath facilities, Card & hobby rooms with Pottery Kiln, A putting green, Organized fitness activities, Daily activities including dances, dinners and entertainment, Wi-Fi and wired broadband Internet access. Close to everything!
Key facts
- 1,742 sq ft lot
- Community pool
- Built 1988
Neighborhood map
What this means for you Summary
Snapshot
- This is a 2-bed/1.0-bath manufactured listed at $135k.
Deal economics
- At list price, monthly cash flow is $436 ($5k/yr) — positive.
- The deal already cash-flows at list — no discount required.
- Meets the 1% rule at list price ($2k rent vs $135k).
- Recommended offer: $119k (12.0% below list) — sets the bar for market timing.
- Cap rate 10.2% vs local median 5.1% in Cathedral City — top-decile yield for the area; either an underpriced asset or a hidden risk that comps aren't pricing in. Stress-test before assuming the spread holds.
Location & tenants
- Location reads 66/100 on livability (#344 in CA) — a middle-class / working-renter tenant base. Strengths: commute A+, housing B+; Watch: employment D+, amenities D-, cost of living F.
- Palm Springs Unified (suburban): math 21% / reading 42% proficiency, ranked #328 of 517 in CA (top 63%) — families likely to look elsewhere, expect single-tenant / working-renter base with shorter leases; 73% free/reduced lunch — lower-income household profile, screen leases tightly.
- Zoned schools: Sunny Sands Elementary (721 students, 98% FRL); Nellie N. Coffman Middle (953 students, 98% FRL); Cathedral City High (math 25% / reading 61%, grade F, #460 of 1,170 statewide, top 40%, 1,395 students, 98% FRL) — zoned schools average 98% FRL vs 73% district-wide (25 pts higher); higher-poverty schools than district average — tighter screening recommended.
- Market conditions: Rents rising (+3.2%/yr); 529 active listings in the ZIP; 2 comparable units currently listed for rent nearby; 9,195 units permitted in Riverside County in 2024 (1,512 in 5+ unit buildings).
Forward outlook
- Local home prices are declining (-3.0%/yr); year-one equity from $933 of loan paydown is wiped out by about $4k of value loss. Plan a longer hold.
- Riverside County population projected at +22% by 2050 — long-run rental-demand tailwind backs the buy-and-hold thesis.
- At projected returns (-3.0% appreciation + 3.2% rent growth), your $38k cash investment doubles in ~9 years — after that, you're playing with house money.
Negotiation context
- It's been on market 705 days — a 12% lower offer ($119k) is reasonable based on typical stale-listing flexibility.
- 3 sale attempts since 8y ago with the ask held roughly flat each time — persistent listings suggest the price (not the market) is what's stuck; bring a comps-based counter.
- Current owner paid $110k; 23% above their basis — modest negotiation headroom, anchor on the comps not their cost.
Risks & watch-outs
- Watch-outs: HOA is 21% of rent.
- Climate carrying-cost: extreme-heat days projected 5→15/yr by 2055 (HVAC capex compounding) — expect insurance premiums to compound above CPI over the hold.
Questions for the listing agent
- It's been on market 705 days. Have you received any prior offers? Is the seller open to a 12% concession, seller financing, or rate buy-down credit?
- What does the HOA fee cover, when was the last increase, and are there any pending special assessments or reserve-fund shortfalls?
- Why hasn't it sold? Are there any deal-killer items the seller is aware of (foundation, flood, title, zoning, code violations)?
- Is there a deadline driving the sale (1031 exchange, divorce, estate, relocation)? That informs how much negotiation room exists.
- Schools are F-rated, which usually means shorter tenancies and higher turnover. Who's the typical renter profile here, and what's been the actual vacancy rate?
- What's the average days-on-market for RENTAL listings here right now (not sales)? A rising rental-DOM trend means longer vacancies and softer asking-rent achievability than the comps imply.
- What's the recent tenant-quality profile in this submarket — average credit score on applications, eviction rate, late-payment / NSF rate, and stable-employment percentage? A property-management company in the area should have these aggregated.
- How much new for-sale + rental construction is in the pipeline within 1–3 miles? Heavy new supply typically softens prices + rents 12–24 months out; constrained supply supports both.
Investment metrics
- 1% rule
- 1.60% ✓
- Cap rate
- 10.17%
- Cash-on-cash
- 13.85%
- DSCR
- 1.62
- GRM
- 5.2
CMA / ARV
- ARV (median comp)
- $132,935
- List price
- $134,900
- Delta
- 1.48%
- Verdict
- FAIR
- Comps
- 7 within 1.0 mi
Show comp detail 11 sales within ~0.75 mi
| Address | Dist | Beds/Ba | Sqft | Sold | Price | $/sf | Match |
|---|---|---|---|---|---|---|---|
| 69801 Ramon #93 | 0.03mi | 1/1.0 (-1) | 600 (0%) | 1mo | $165,000 | $275 | 93 |
| 69801 Ramon Rd #343 | 0.12mi | 1/1.0 (-1) | 600 (0%) | 1mo | $119,000 | $198 | 88 |
| 69801 Ramon #319 | 0.13mi | 1/1.0 (-1) | 600 (0%) | 1mo | $150,000 | $250 | 88 |
| 69801 Ramon Rd #15 | 0.13mi | 2/1.0 | 600 (0%) | 8mo | $130,000 | $217 | 88 |
| 69801 Ramon Rd #365 | 0.14mi | 1/1.0 (-1) | 600 (0%) | 5mo | $110,000 | $183 | 85 |
| 69801 Ramon Rd #369 | 0.13mi | 1/1.0 (-1) | 600 (0%) | 6mo | $153,000 | $255 | 84 |
| 69801 Ramon Rd #4 | 0.16mi | 1/1.0 (-1) | 600 (0%) | 7mo | $135,000 | $225 | 82 |
| 69801 Ramon Rd #236 | 0.09mi | 2/1.0 | 600 (0%) | 18mo | $195,000 | $325 | 81 |
| 69801 Ramon Rd #94 | 0.03mi | 1/1.0 (-1) | 600 (0%) | 17mo | $117,000 | $195 | 80 |
| 69801 Ramon Rd #19 | 0.15mi | 2/1.0 | 600 (0%) | 21mo | $135,000 | $225 | 76 |
| 69801 Ramon Rd #36 | 0.10mi | 1/1.0 (-1) | 600 (0%) | 20mo | $117,000 | $195 | 74 |
Match score weights: distance 35% · size 25% · config 20% · recency 20%. Top-matched comps best support the ARV.
Projected returns pro-forma
-3.0% appreciation · 3.22% rent growth · sell at horizon
- IRR
- 4.5%
- Equity multiple
- 1.18×
- Total profit
- $6,627
- Equity at exit
- $20,114
- IRR
- 14.4%
- Equity multiple
- 2.18×
- Total profit
- $44,476
- Equity at exit
- $11,664
Cash invested: $37,772 (down + closing). Projections, not guarantees.
Landlord ↔ Tenant lean methodology
- Overall (STATE)
- 18 Strongly Tenant-Friendly
- State California
- 18 Strongly Tenant-Friendly · D+13
- County
- — inherits STATE
- City
- — inherits STATE
ZIP-level market 92234
- Home prices YoY
- -27.7%
- Rents YoY
- 3.2%
- Active inventory
- 529
- Price-to-rent
- 5.2×
Monthly cashflow live
- Estimated rent
- $2,159 medium interval (Pro) →
- Mortgage (P&I)
- −$707
- Tax from tax record
- −$51 /mo · $613/yr
- Insurance
- −$56
- HOA
- −$455
- Vacancy / Maint / Mgmt
- −$453
- Net cashflow
- $436
Break-even live
Sensitivity live
| Price | -10% $512 | -5% $474 | +0% $436 | +5% $398 | +10% $360 |
|---|---|---|---|---|---|
| Rent | -10% $265 | -5% $351 | +0% $436 | +5% $521 | +10% $607 |
| Rate | -1.0pp $504 | -0.5pp $470 | base $436 | +0.5pp $401 | +1.0pp $365 |
UW: 25.0% down · 7.5% · 30yr · 1.5% tax · 5.0% vac · 8.0% maint · 8.0% mgmt
Financing live
Cash to close
- Down payment
- $33,725
- Closing costs
- $4,047
- Reserves months
- —
- Total cash needed
- —
Loan-product check · same deal, 3 products live
Conventional
25% down · 7.5% · 30yr
- Down + closing
- —
- Monthly P&I
- —
- Monthly cashflow
- —
- DSCR
- —
- Eligible?
- —
Personal DTI + credit; lowest rate.
DSCR
20% down · 8.5% · 30yr
- Down + closing
- —
- Monthly P&I
- —
- Monthly cashflow
- —
- DSCR
- —
- Eligible?
- —
No personal income docs; deal must DSCR.
Hard money
10% down · 12.0% · 12mo
- Down + closing
- —
- Monthly P&I
- —
- Monthly cashflow
- —
- DSCR
- —
- Eligible?
- —
Short-term bridge; refi at stabilization.
Rent comps 2 comps
| Address | Beds | Baths | Sqft | Rent | $/sqft | DOM | Units | Dist |
|---|---|---|---|---|---|---|---|---|
| 69801 Ramon Rd #115 Cathedral City, CA | 1.0 | 1.0 | 600 | $1,600 | $2.67 | 16d | 1 | 0.05mi |
| 32200 Cathedral Canyon Dr #31 Cathedral City, CA | 1.0 | 1.0 | 740 | $1,550 | $2.09 | 26d | 1 | 1.18mi |
HOA detail
- Monthly dues
- $455 · $5,460/yr
- Likely covers
- watertrashinternetcablepoolgym
Listing history 24 events
-
2026-06-21days on market $134,900 Active 705 DOM
-
2026-06-18days on market $134,900 Active 702 DOM
-
2026-06-17days on market $134,900 Active 701 DOM
-
2026-06-16days on market $134,900 Active 700 DOM
-
2026-06-15days on market $134,900 Active 699 DOM
-
2026-06-13days on market $134,900 Active 697 DOM
-
2026-06-13days on market $134,900 Active 696 DOM
-
2026-06-09days on market $134,900 Active 693 DOM
-
2026-06-08days on market $134,900 Active 692 DOM
-
2026-06-07days on market $134,900 Active 691 DOM
-
2026-06-04days on market $134,900 Active 688 DOM
-
2026-06-03days on market $134,900 Active 687 DOM
-
2026-06-02days on market $134,900 Active 686 DOM
-
2026-06-01days on market $134,900 Active 685 DOM
-
2026-05-31days on market $134,900 Active 684 DOM
-
2025-07-21price $134,900 1199-char remark
Show marketing remark (1199 chars)
Must See Park Model in the highly sought after 55+ Seasonal Living "Desert Shadows RV Resort"! You Own Land! Grant Deed Lot with Water, Cable, Trash, and common area included in HOA! 2 bedroom (utilizing the additional "California Room"!) Amazing amenities in this fabulous oasis! 2 large & well-maintained clubhouses plus 3 additional satellite clubhouses, An indoor pool with a large spa and sauna, An olympic-size lap pool, A total of 6 pools, 5 spas and 3 saunas, Sunken, lighted tennis courts, 8 Pickle-ball courts, An indoor shuffleboard pavilion, 16,000-square foot San Jacinto room with floating hardwood dance floor, and a professional stage, plus a large kitchen, A 3,000-square foot “Our Gang” party room and lounge with a giant fireplace and kitchen, A huge party terrace with mountain views, A fully equipped fitness center, A dance studio, Library, Billiards room, Horseshoe pits, Several laundries, restrooms and bath facilities, Card & hobby rooms with Pottery Kiln, A putting green, Organized fitness activities, Daily activities including dances, dinners and entertainment, Wi-Fi and wired broadband Internet access. Close to everything!
-
2024-07-16$139,900 Active 1199-char remark
Show marketing remark (1199 chars)
Must See Park Model in the highly sought after 55+ Seasonal Living "Desert Shadows RV Resort"! You Own Land! Grant Deed Lot with Water, Cable, Trash, and common area included in HOA! 2 bedroom (utilizing the additional "California Room"!) Amazing amenities in this fabulous oasis! 2 large & well-maintained clubhouses plus 3 additional satellite clubhouses, An indoor pool with a large spa and sauna, An olympic-size lap pool, A total of 6 pools, 5 spas and 3 saunas, Sunken, lighted tennis courts, 8 Pickle-ball courts, An indoor shuffleboard pavilion, 16,000-square foot San Jacinto room with floating hardwood dance floor, and a professional stage, plus a large kitchen, A 3,000-square foot “Our Gang” party room and lounge with a giant fireplace and kitchen, A huge party terrace with mountain views, A fully equipped fitness center, A dance studio, Library, Billiards room, Horseshoe pits, Several laundries, restrooms and bath facilities, Card & hobby rooms with Pottery Kiln, A putting green, Organized fitness activities, Daily activities including dances, dinners and entertainment, Wi-Fi and wired broadband Internet access. Close to everything!
-
2024-05-15historical
-
2023-11-14$139,900 Active
-
2019-08-23soldstatus $110,000 Closed
-
2019-08-23soldstatus $110,000 Sold
-
2019-08-23soldstatus $110,000
-
2019-03-18historical Backup Offers Accepted
-
2018-11-05$125,000 Active
ⓘ Source: listings_history table (triggers on properties + properties_extension) + one-shot
backfill from property_details.listing_events for pre-trigger history.
Tax reassessment forecast CA · Resets to sale price
- Current annual tax
- $613 · $51/mo
- Projected year-2 tax
- $1,025 · $85/mo
- Expected delta
- +$412/yr (+$34/mo · 67.2%)
ⓘ Screening estimate from a state-policy table — verify with the county assessor before closing.
Climate risk First Street
- Flood 1/10 Low FEMA zone X (unshaded) · 0% chance over 30 yrs
- Wildfire 1/10 Low
- Heat 9/10 Extreme 5 d/yr ≥113°F today · 15 d/yr by 30 yrs out
- Wind 1/10 Low
- Air quality 4/10 Moderate 5 unhealthy d/yr today · 7 by 30 yrs out
Nearby sold comps map
Loading sold comps map…
Walkable amenities ~0.75 mi
Loading nearby amenities…
Taxation est. · year 1
- Rental income
- $25,909
- − Mortgage interest
- −$7,556
- − Property taxes
- −$613
- − Insurance
- −$674
- − Repairs & maintenance
- −$2,073
- − Management
- −$2,073
- − HOA
- −$5,460
- − Depreciation
- −$3,924
- Taxable income
- $3,536
- Est. tax owed @ 24.0%
- −$849
- After-tax cash flow
- $4,383/yr
For passive investors: Depreciation is non-cash, so a rental often shows a tax loss while cash-flowing — sheltering income. Rental losses are passive: they offset passive income freely, and up to $25,000/yr can offset ordinary (W-2) income if you actively participate and your MAGI is under $100k (phasing out to $0 by $150k); unused losses carry forward. On sale, claimed depreciation is recaptured at up to 25%, and gains may owe capital-gains tax (a 1031 exchange can defer both). Figures are a year-1 estimate at your 24.0% rate — not tax advice; consult a CPA.
Schools (NCES district)
- District
- Palm Springs Unified
- NCES district ID
- 0629550
- Math proficiency
- 21% ▼ -7.00%
- Reading proficiency
- 42% ▬ 0.00%
- Median HH income
- $43,638
- Composite
- 26.76/100
- National rank
- #7131
- State rank
- #328 of 517 in CA
Livability — Cathedral City
- Score
- 66/100
- State rank
- #344
- US rank
- #11749
Category grades
Schools grade is shown separately in the Schools card above.
Census & demographics
- Census place
- Cathedral City, CA
- County
- Riverside County · 2,287,001 people
- City population
- 52,267
- Metro
- Riverside-San Bernardino-Ontario, CA
- Population (ZIP)
- 52,267
- Household income
- $73,572
- Rent vs Own
- Severe rent burden
- 1682.0
Population outlook (Riverside County) Hauer SSP2
- Today (2025)
- 2,664,475 people
- By 2030
- 2,802,692 · +5.2%
- By 2040
- 3,050,904 · +14.5%
- By 2050
- 3,256,783 · +22.2%
- By 2075
- 3,655,058 · +37.2%
- By 2100
- 3,766,594 · +41.4%
Race, ethnicity, and origin ACS 2023
- Neighborhood character
- Diverse neighborhood (Simpson 0.56)
- Race & ethnicity
- Hispanic / Latino 59% White 30% Two or more races 27% Asian 6% Native American 2% Black 2%
- Hispanic origin (detail)
- Mexican 51%
- Common ancestry
- Lithuanian 2% Romanian 1% Italian 1%
- Foreign-born
- 28% · Canada, Vietnam
- Languages at home
- 48% English-only · Spanish 46% Tagalog/Filipino 3% Other Asian/Pacific 1%
Political lean MEDSL · Riverside
- 2024 margin
- Toss-up / Even · D 48.0% · R 49.3% · Other 2.6%
- 2008→2024 swing
- -3.6pp toward R · 2008: 2.3pp · 2024: -1.3pp
- All cycles
- 2024: R+1.3 2020: D+8.0 2016: D+4.3 2012: R+0.4 2008: D+2.3
Not yet ingested
- Civics
- —
Market trends
- HPI YoY
- ▼ -136.57%
- Current HPI
- 356.9845
- Rent YoY
- ▲ 3.22%
- Metro
- Riverside-San Bernardino-Ontario, CA
- State GDP YoY
- ▲ 3.21%
- F500 in state
- 116
Industry mix (Fortune 500 HQ in CA)
| Industry | F500 HQs | Revenue |
|---|---|---|
| Technology | 27 | $1,492B |
|
||
| Financial Services | 3 | $174B |
|
||
| Retail | 3 | $44B |
|
||
| Insurance | 3 | $26B |
|
||
| Media / Entertainment | 2 | $115B |
|
||
| Pharmaceuticals / Biotech | 2 | $62B |
|
||
Price history
+7.9% since first listed9 events — show timeline
- 2025-07-21 Price Changed $134,900 CRMLS
- 2024-07-16 Listed $139,900 CRMLS
- 2024-05-15 Listing Removed — GPSMLS
- 2023-11-14 Listed $139,900 GPSMLS
- 2019-08-23 Sold (Public Records) $110,000 Public Records
- 2019-08-23 Sold (MLS) $110,000 GPSMLS
- 2019-08-23 Sold (MLS) $110,000 GPSMLS
- 2019-03-18 Contingent — GPSMLS
- 2018-11-05 Listed $125,000 GPSMLS
Property tax history
-4.6%/yrLatest (2014): $613 · -2.1% YoY. Source: county tax records.
Cash-flow waterfall
monthlySold comps — $/sqft
last 12 mo · ≤1 miLoading sold comps…