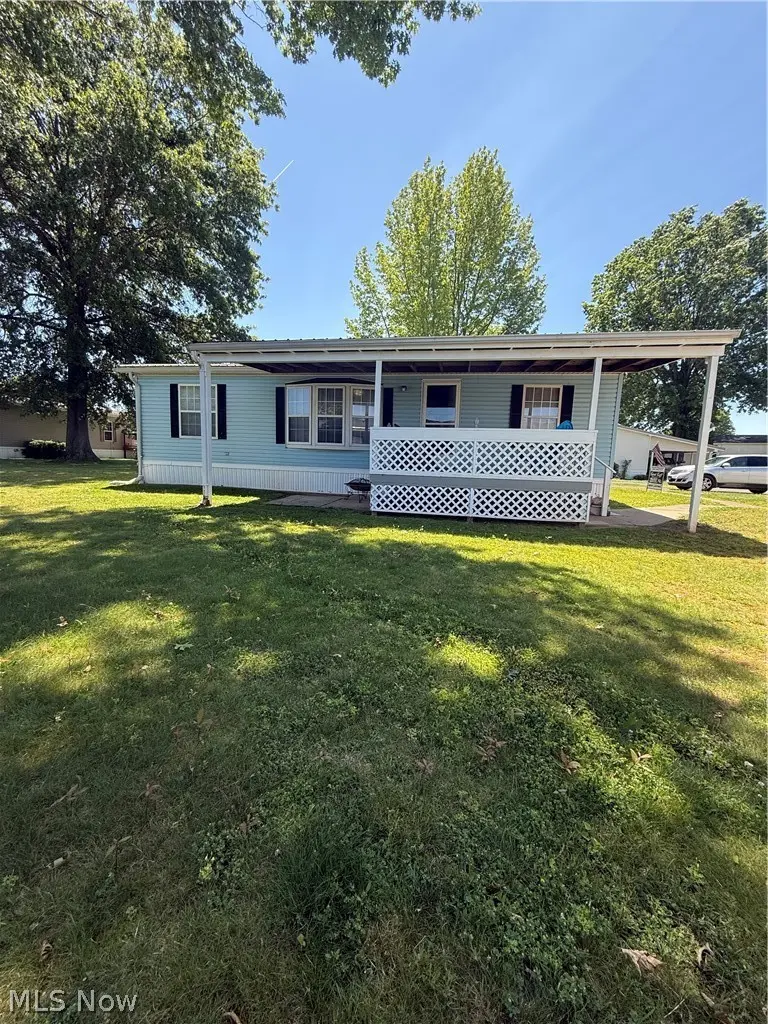
324 Fairview Lot 53 · West Lafayette, OH
Flood risk 1/10 · Minimal
- FEMA flood zone
- X (unshaded)
- Chance of flooding over 30 yrs
- 0.0%
- Est. flood insurance / yr
- $507 – $1,088
Fire risk 1/10 · Minimal
- Est. fire insurance / yr
- $713 – $1,323
Heat risk 3/10 · Minor
- Hot days now (above 98°F)
- 7 days/yr
- Hot days in 30 yrs
- 18 days/yr
Wind risk 2/10 · Minimal
- Chance of severe wind over 30 yrs
- 1.0%
Air-quality risk 2/10 · Minimal
- Unhealthy air days now
- 1 days/yr
- Unhealthy air days in 30 yrs
- 2 days/yr
Risk factors via First Street. Map © Google.
Why this score? — see what drove the B+ grade
The composite is a weighted blend of 9 inputs, each scored 0–100. Each bar is that input's sub-score; the figure is the points it added to the 100-point composite (weight × sub-score).
- Cash flow +29.8/30.0
- ARV discount +15.0/15.0
- DSCR +10.0/10.0
- 1% rule +8.4/10.0
- Schools +4.7/10.0
- Livability +3.5/5.0
- Rent growth +2.5/5.0
- Condition / age +2.5/5.0
- Appreciation +0.0/10.0
$95,000
🖨 Deal sheet (PDF) 📄 Offer letter ✓ Due diligence
Listing remarks
Welcome home to this beautifully maintained 3-bedroom, 2-bath manufactured home that is full of charm and value! You'll love the peace of mind that comes with a brand-new roof installed in 2025, along with a newer A/C unit for added comfort. Step outside and discover a spacious carport and an oversized shed that offers endless possibilities—whether you need extra storage, a workshop, hobby space, or the perfect man cave retreat. With plenty of room to enjoy both inside and out, this move-in-ready home is one you won't want to miss. Schedule your showing today and see all it has to offer!
Key facts
- Oversized shed
- Newer a/c unit
- Brand-new roof
Tags
Property features AI
Finance
- Other:
- Financial info:
- HOA & community:
Exterior
- Parking: Detached carport; Two carport spaces
- Security:
- Utilities: Public water; Public sewer
- Home design: One story; Owner-reported year built
- Construction: Metal roof
- Exterior features: Vinyl siding; 0.2-acre lot
Interior
- Kitchen:
- Bedrooms: Three main-level bedrooms
- Flooring:
- Bathrooms: Two full bathrooms on the main level
- Heating & cooling: Central air conditioning; Forced air heating; Propane heating
- Interior features: Single-story layout
- Laundry & utility:
Neighborhood map
What this means for you Summary
Snapshot
- This is a 3-bed/2.0-bath single-family listed at $95k.
Deal economics
- At list price, monthly cash flow is $348 ($4k/yr) — positive.
- The deal already cash-flows at list — no discount required.
- Meets the 1% rule at list price ($1k rent vs $95k).
- Recommended offer: $94k (1.5% below list) — sets the bar for market timing.
Location & tenants
- Location reads 70/100 on livability (#467 in OH) — a middle-class / working-renter tenant base. Strengths: cost of living A+, health & safety A+, crime A; Watch: amenities F, commute F, employment F.
- Ridgewood Local (town): math 51% / reading 60% proficiency, ranked #370 of 656 in OH (top 56%) — acceptable for families but not a draw, mixed tenant base, ~2y average lease.
- Zoned schools: Ridgewood Elementary School (math 57% / reading 52%, grade C, #788 of 1,584 statewide, top 52%, 447 students, 0% FRL); Ridgewood Middle School (math 49% / reading 59%, grade B-, #352 of 654 statewide, top 55%, 374 students, 58% FRL); Ridgewood High School (math 51% / reading 63%, grade C, #275 of 781 statewide, top 37%, 454 students, 55% FRL).
- Market conditions: 14 active listings in the ZIP; 7 units permitted in Coshocton County in 2024 (0 in 5+ unit buildings).
Forward outlook
- Local home prices are declining (-3.0%/yr); year-one equity from $657 of loan paydown is wiped out by about $3k of value loss. Plan a longer hold.
- Coshocton County population projected at -18% by 2050 — secular population decline; favor cash flow + early exit over multi-decade hold.
- At projected returns (-3.0% appreciation + 3.0% rent growth), your $27k cash investment doubles in ~8 years — after that, you're playing with house money.
Negotiation context
- It's been on market 19 days — a 2% lower offer ($94k) is reasonable based on typical stale-listing flexibility.
- 3 sale attempts since 22y ago with the ask held roughly flat each time — persistent listings suggest the price (not the market) is what's stuck; bring a comps-based counter.
Questions for the listing agent
- Is there a deadline driving the sale (1031 exchange, divorce, estate, relocation)? That informs how much negotiation room exists.
- Schools are B-rated — typically a magnet for longer-tenancy family renters. What's the average tenant stay here, and is there a school-zone premium baked into asking?
- What's the average days-on-market for RENTAL listings here right now (not sales)? A rising rental-DOM trend means longer vacancies and softer asking-rent achievability than the comps imply.
- What's the recent tenant-quality profile in this submarket — average credit score on applications, eviction rate, late-payment / NSF rate, and stable-employment percentage? A property-management company in the area should have these aggregated.
- How much new for-sale + rental construction is in the pipeline within 1–3 miles? Heavy new supply typically softens prices + rents 12–24 months out; constrained supply supports both.
Investment metrics
- 1% rule
- 1.34% ✓
- Cap rate
- 10.68%
- Cash-on-cash
- 15.68%
- DSCR
- 1.70
- GRM
- 6.2
CMA / ARV
- ARV (on-the-fly)
- $140,400
- Comps found
- 5
Show comp detail 5 sales within ~0.75 mi
| Address | Dist | Beds/Ba | Sqft | Sold | Price | $/sf | Match |
|---|---|---|---|---|---|---|---|
| 324 W Fairview St #94 | 0.17mi | 3/2.0 | 980 (-6%) | 18mo | $97,500 | $99 | 67 |
| 425 E Union Ave | 0.67mi | 3/1.0 | 1,056 (+2%) | 5mo | $80,000 | $76 | 58 |
| 209 N Oak St | 0.21mi | 4/1.5 (+1) | 1,165 (+12%) | 15mo | $174,200 | $150 | 51 |
| 112 E 6th St | 0.67mi | 3/1.0 | 960 (-8%) | 14mo | $156,700 | $163 | 40 |
| 101 W Union Ave | 0.46mi | 2/1.0 (-1) | 960 (-8%) | 22mo | $129,900 | $135 | 39 |
Match score weights: distance 35% · size 25% · config 20% · recency 20%. Top-matched comps best support the ARV.
Projected returns pro-forma
-3.0% appreciation · 3.0% rent growth · sell at horizon
- IRR
- 6.5%
- Equity multiple
- 1.25×
- Total profit
- $6,768
- Equity at exit
- $14,165
- IRR
- 15.9%
- Equity multiple
- 2.30×
- Total profit
- $34,484
- Equity at exit
- $8,214
Cash invested: $26,600 (down + closing). Projections, not guarantees.
Landlord ↔ Tenant lean methodology
- Overall (STATE)
- 73 Landlord-Friendly
- State Ohio
- 73 Landlord-Friendly · R+6
- County
- — inherits STATE
- City
- — inherits STATE
ZIP-level market 43845
- Home prices YoY
- -15.0%
- Active inventory
- 14
- Price-to-rent
- 6.2×
Monthly cashflow live
- Estimated rent
- $1,271 medium interval (Pro) →
- Mortgage (P&I)
- −$498
- Tax est. 1.5%
- −$119 /mo · $1,425/yr
- Insurance
- −$40
- HOA
- −$0
- Vacancy / Maint / Mgmt
- −$267
- Net cashflow
- $348
Break-even live
Sensitivity live
| Price | -10% $413 | -5% $380 | +0% $348 | +5% $315 | +10% $282 |
|---|---|---|---|---|---|
| Rent | -10% $247 | -5% $297 | +0% $348 | +5% $398 | +10% $448 |
| Rate | -1.0pp $396 | -0.5pp $372 | base $348 | +0.5pp $323 | +1.0pp $298 |
UW: 25.0% down · 7.5% · 30yr · 1.5% tax · 5.0% vac · 8.0% maint · 8.0% mgmt
Financing live
Cash to close
- Down payment
- $23,750
- Closing costs
- $2,850
- Reserves months
- —
- Total cash needed
- —
Loan-product check · same deal, 3 products live
Conventional
25% down · 7.5% · 30yr
- Down + closing
- —
- Monthly P&I
- —
- Monthly cashflow
- —
- DSCR
- —
- Eligible?
- —
Personal DTI + credit; lowest rate.
DSCR
20% down · 8.5% · 30yr
- Down + closing
- —
- Monthly P&I
- —
- Monthly cashflow
- —
- DSCR
- —
- Eligible?
- —
No personal income docs; deal must DSCR.
Hard money
10% down · 12.0% · 12mo
- Down + closing
- —
- Monthly P&I
- —
- Monthly cashflow
- —
- DSCR
- —
- Eligible?
- —
Short-term bridge; refi at stabilization.
Listing history 14 events
-
2026-06-21days on market $95,000 Active 19 DOM
-
2026-06-21days on market $95,000 Active 18 DOM
-
2026-06-18days on market $95,000 Active 16 DOM
-
2026-06-17days on market $95,000 Active 15 DOM
-
2026-06-16days on market $95,000 Active 14 DOM
-
2026-06-15days on market $95,000 Active 13 DOM
-
2026-06-13days on market $95,000 Active 11 DOM
-
2026-06-12days on market $95,000 Active 10 DOM
-
2026-06-09days on market $95,000 Active 7 DOM
-
2026-06-08days on market $95,000 Active 6 DOM
-
2026-06-08days on market $95,000 Active 5 DOM
-
2026-06-05days on market $95,000 Active 3 DOM
-
2026-06-03remarks 594-char remark
-
2026-06-03$95,000 Active 1 DOM
ⓘ Source: listings_history table (triggers on properties + properties_extension) + one-shot
backfill from property_details.listing_events for pre-trigger history.
Climate risk First Street
- Flood 1/10 Low FEMA zone X (unshaded) · 0% chance over 30 yrs
- Wildfire 1/10 Low
- Heat 3/10 Moderate 7 d/yr ≥98°F today · 18 d/yr by 30 yrs out
- Wind 2/10 Low 100% chance of damaging wind over 30 yrs
- Air quality 2/10 Low 1 unhealthy d/yr today · 2 by 30 yrs out
Nearby sold comps map
Loading sold comps map…
Walkable amenities ~0.75 mi
Loading nearby amenities…
Taxation est. · year 1
- Rental income
- $15,253
- − Mortgage interest
- −$5,321
- − Property taxes
- −$1,425
- − Insurance
- −$475
- − Repairs & maintenance
- −$1,220
- − Management
- −$1,220
- − Depreciation
- −$2,764
- Taxable income
- $2,828
- Est. tax owed @ 24.0%
- −$679
- After-tax cash flow
- $3,493/yr
For passive investors: Depreciation is non-cash, so a rental often shows a tax loss while cash-flowing — sheltering income. Rental losses are passive: they offset passive income freely, and up to $25,000/yr can offset ordinary (W-2) income if you actively participate and your MAGI is under $100k (phasing out to $0 by $150k); unused losses carry forward. On sale, claimed depreciation is recaptured at up to 25%, and gains may owe capital-gains tax (a 1031 exchange can defer both). Figures are a year-1 estimate at your 24.0% rate — not tax advice; consult a CPA.
Schools (NCES district)
- District
- Ridgewood Local
- NCES district ID
- 3904647
- Math proficiency
- 51% ▼ -17.00%
- Reading proficiency
- 60% ▼ -8.00%
- Median HH income
- $45,776
- Composite
- 46.91/100
- National rank
- #2366
- State rank
- #370 of 656 in OH
Livability — West Lafayette
- Score
- 70/100
- State rank
- #467
- US rank
- #7717
Category grades
Schools grade is shown separately in the Schools card above.
Census & demographics
- Census place
- West Lafayette, OH
- County
- Coshocton · 37,075 people
- Population (ZIP)
- 4,780
- Household income
- $53,864
- Rent vs Own
- Severe rent burden
- 5.3
Population outlook (Coshocton County) Hauer SSP2
- Today (2025)
- 35,193 people
- By 2030
- 34,112 · -3.1%
- By 2040
- 31,670 · -10.0%
- By 2050
- 29,033 · -17.5%
- By 2075
- 22,827 · -35.1%
- By 2100
- 16,421 · -53.3%
Race, ethnicity, and origin ACS 2023
- Neighborhood character
- Predominantly White (97%)
- Race & ethnicity
- White 97% Two or more races 2%
- Common ancestry
- Iranian 7% Italian 3% Romanian 3%
Political lean MEDSL · Coshocton
- 2024 margin
- Solid R (+52.2) · D 23.5% · R 75.7%
- 2008→2024 swing
- -46.4pp toward R · 2008: -5.8pp · 2024: -52.2pp
- All cycles
- 2024: R+52.2 2020: R+49.0 2016: R+43.3 2012: R+9.5 2008: R+5.8
Not yet ingested
- Civics
- —
Market trends
- HPI YoY
- ▼ -41.55%
- Current HPI
- 235.1356
- Rent YoY
- —
- Metro
- —
- State GDP YoY
- ▲ 1.98%
- F500 in state
- 48
Industry mix (Fortune 500 HQ in OH)
| Industry | F500 HQs | Revenue |
|---|---|---|
| Insurance | 3 | $145B |
|
||
| Industrial Machinery | 3 | $49B |
|
||
| Financial Services | 3 | $24B |
|
||
| Consumer Goods | 2 | $93B |
|
||
| Aerospace / Defense | 2 | $47B |
|
||
| Utilities | 2 | $33B |
|
||
Price history
+217.7% since first listed5 events — show timeline
- 2026-06-02 Listed $95,000 MLSNOW
- 2004-09-25 Listing Removed — MLSNOW
- 2004-06-25 Listing Removed — MLSNOW
- 2004-06-25 Listed $29,900 MLSNOW
- 2004-03-25 Listed $29,900 MLSNOW
Cash-flow waterfall
monthlySold comps — $/sqft
last 12 mo · ≤1 miLoading sold comps…