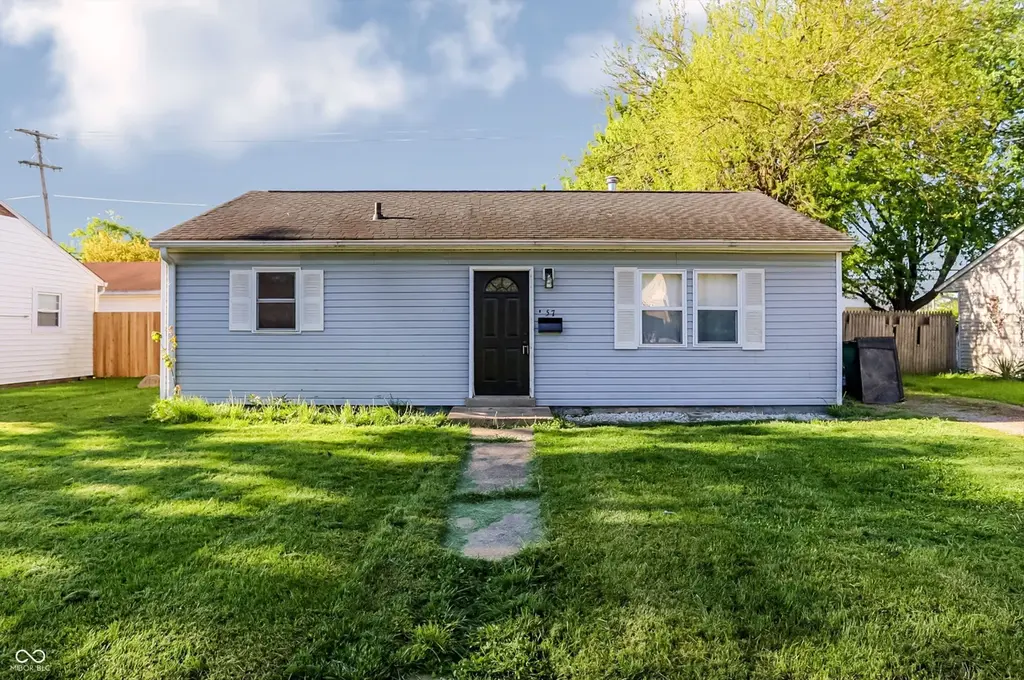
57 14th St · Franklin, IN
Flood risk 6/10 · Moderate
- FEMA flood zone
- AO
- Chance of flooding over 30 yrs
- 0.73%
- Est. flood insurance / yr
- $848 – $2,087
Fire risk 1/10 · Minimal
- Est. fire insurance / yr
- $717 – $1,331
Heat risk 4/10 · Minor
- Hot days now (above 101°F)
- 7 days/yr
- Hot days in 30 yrs
- 19 days/yr
Wind risk 2/10 · Minimal
- Chance of severe wind over 30 yrs
- 1.0%
Air-quality risk 2/10 · Minimal
- Unhealthy air days now
- 1 days/yr
- Unhealthy air days in 30 yrs
- 1 days/yr
Risk factors via First Street. Map © Google.
Why this score? — see what drove the C grade
The composite is a weighted blend of 9 inputs, each scored 0–100. Each bar is that input's sub-score; the figure is the points it added to the 100-point composite (weight × sub-score).
- Cash flow +23.0/30.0
- ARV discount +8.0/15.0
- DSCR +7.4/10.0
- 1% rule +5.1/10.0
- Rent growth +3.7/5.0
- Schools +3.5/10.0
- Livability +3.2/5.0
- Condition / age +2.5/5.0
- Appreciation +0.0/10.0
$165,000
🖨 Deal sheet (PDF) 📄 Offer letter ✓ Due diligence
Listing remarks MLS
Charming ranch home in Popular Franklin, Indiana. 3 bedrooms/1 Bath with a large Family Room for gatherings. Fenced in Back yard with a shed will keep you and pets busy while gardening. Updated flooring/Roof.
Key facts
- 7,187 sq ft lot
- Built 1950
- Listed 7 days
Neighborhood map
What this means for you Summary
Snapshot
- This is a 3-bed/1.0-bath single-family listed at $165k.
Deal economics
- At list price, monthly cash flow is $169 ($2k/yr) — positive.
- The deal already cash-flows at list — no discount required.
- Meets the 1% rule at list price ($2k rent vs $165k).
- Cap rate 8.4% vs local median 4.0% in Franklin — top-decile yield for the area; either an underpriced asset or a hidden risk that comps aren't pricing in. Stress-test before assuming the spread holds.
Location & tenants
- Location reads 65/100 on livability (#351 in IN) — a middle-class / working-renter tenant base. Strengths: crime A+, cost of living A+, housing A+; Watch: amenities F, commute F, health & safety F.
- Franklin Community School Corporation (suburban): math 36% / reading 44% proficiency, ranked #133 of 301 in IN (top 44%) — families likely to look elsewhere, expect single-tenant / working-renter base with shorter leases.
- Zoned schools: Northwood Elementary School (math 42% / reading 37%, grade F, #500 of 994 statewide, top 53%, 561 students, 56% FRL); Franklin Community Middle School (math 25% / reading 42%, grade F, #176 of 330 statewide, top 54%, 759 students, 48% FRL); Franklin Community High School (math 29% / reading 69%, grade D, #136 of 369 statewide, top 37%, 1,610 students, 41% FRL).
- Market conditions: Rents rising fast (+4.7%/yr); 282 active listings in the ZIP; 8 comparable units currently listed for rent nearby; rentals leasing fast (median 10d on market — plan ~1-2 weeks tenant-placement turnaround); solid renter incomes; 1,133 units permitted in Johnson County in 2024 (0 in 5+ unit buildings).
Forward outlook
- Local home prices are declining (-3.0%/yr); year-one equity from $1k of loan paydown is wiped out by about $5k of value loss. Plan a longer hold.
- Johnson County population projected at +26% by 2050 — long-run rental-demand tailwind backs the buy-and-hold thesis.
Negotiation context
- Only 7 days on market — expect competitive offers; lowballing is unlikely to land.
- 8 sale attempts since 26y ago with the ask held roughly flat each time — persistent listings suggest the price (not the market) is what's stuck; bring a comps-based counter.
- Current owner paid $118k; 40% above their basis — modest negotiation headroom, anchor on the comps not their cost.
Risks & watch-outs
- Watch-outs: flood insurance adds $122/mo; built in 1950 — expect roof / HVAC / electrical / plumbing capex.
- Climate carrying-cost: in FEMA flood zone AO (mandatory federal flood insurance) — expect insurance premiums to compound above CPI over the hold.
Questions for the listing agent
- Built in 1950 — when were the roof, HVAC, electrical panel, plumbing, and water heater last replaced?
- What's the actual annual flood-insurance premium (NFIP or private), and is the property in a SFHA with mandatory coverage?
- Is there a deadline driving the sale (1031 exchange, divorce, estate, relocation)? That informs how much negotiation room exists.
- Schools are D-rated, which usually means shorter tenancies and higher turnover. Who's the typical renter profile here, and what's been the actual vacancy rate?
- What's the average days-on-market for RENTAL listings here right now (not sales)? A rising rental-DOM trend means longer vacancies and softer asking-rent achievability than the comps imply.
- What's the recent tenant-quality profile in this submarket — average credit score on applications, eviction rate, late-payment / NSF rate, and stable-employment percentage? A property-management company in the area should have these aggregated.
- How much new for-sale + rental construction is in the pipeline within 1–3 miles? Heavy new supply typically softens prices + rents 12–24 months out; constrained supply supports both.
Investment metrics
- 1% rule
- 1.01% ✓
- Cap rate
- 8.41%
- Cash-on-cash
- 7.57%
- DSCR
- 1.34
- GRM
- 8.2
CMA / ARV
- ARV (on-the-fly)
- $166,752
- Comps found
- 12
Show comp detail 12 sales within ~0.75 mi
| Address | Dist | Beds/Ba | Sqft | Sold | Price | $/sf | Match |
|---|---|---|---|---|---|---|---|
| 1462 Lochry Rd | 0.06mi | 3/1.0 | 864 (0%) | 1mo | $165,000 | $191 | 96 |
| 11 14th St | 0.05mi | 3/1.0 | 864 (0%) | 11mo | $182,500 | $211 | 88 |
| 123 14th St | 0.07mi | 3/1.0 | 912 (+6%) | 5mo | $115,000 | $126 | 83 |
| 1450 Roberts Rd | 0.11mi | 3/1.0 | 925 (+7%) | 6mo | $158,000 | $171 | 78 |
| 21 14th St | 0.03mi | 2/1.0 (-1) | 768 (-11%) | 1mo | $175,000 | $228 | 74 |
| 112 Oliver Ave | 0.31mi | 3/1.0 | 825 (-4%) | 8mo | $210,000 | $255 | 71 |
| 1556 Younce St | 0.28mi | 3/1.0 | 925 (+7%) | 8mo | $167,500 | $181 | 68 |
| 110 Jordan Dr | 0.40mi | 3/1.0 | 900 (+4%) | 8mo | $160,000 | $178 | 67 |
| 174 Jordan Dr | 0.37mi | 3/1.0 | 900 (+4%) | 11mo | $169,000 | $188 | 67 |
| 26 Highland Ave | 0.19mi | 2/1.0 (-1) | 920 (+6%) | 15mo | $185,000 | $201 | 63 |
| 80 Circle Dr | 0.08mi | 2/1.0 (-1) | 960 (+11%) | 16mo | $185,000 | $193 | 59 |
| 44 W Adams St | 0.75mi | 2/1.0 (-1) | 912 (+6%) | 15mo | $185,000 | $203 | 38 |
Match score weights: distance 35% · size 25% · config 20% · recency 20%. Top-matched comps best support the ARV.
Projected returns pro-forma
-3.0% appreciation · 4.68% rent growth · sell at horizon
- IRR
- -7.5%
- Equity multiple
- 0.72×
- Total profit
- $-13,045
- Equity at exit
- $24,602
- IRR
- 4.1%
- Equity multiple
- 1.32×
- Total profit
- $14,877
- Equity at exit
- $14,266
Cash invested: $46,200 (down + closing). Projections, not guarantees.
Landlord ↔ Tenant lean methodology
- Overall (STATE)
- 90 Strongly Landlord-Friendly
- State Indiana
- 90 Strongly Landlord-Friendly · R+11
- County
- — inherits STATE
- City
- — inherits STATE
ZIP-level market 46131
- Home prices YoY
- -27.8%
- Rents YoY
- 4.7%
- Active inventory
- 282
- Price-to-rent
- 8.2×
Monthly cashflow live
- Estimated rent
- $1,674 high interval (Pro) →
- Mortgage (P&I)
- −$865
- Tax from tax record
- −$97 /mo · $1,163/yr
- Insurance
- −$69
- Flood insurance flood zone
- −$122 /mo · $1,468/yr
- HOA
- −$0
- Vacancy / Maint / Mgmt
- −$352
- Net cashflow
- $169
Break-even live
Sensitivity live
| Price | -10% $263 | -5% $216 | +0% $169 | +5% $123 | +10% $76 |
|---|---|---|---|---|---|
| Rent | -10% $37 | -5% $103 | +0% $169 | +5% $235 | +10% $302 |
| Rate | -1.0pp $252 | -0.5pp $211 | base $169 | +0.5pp $127 | +1.0pp $83 |
UW: 25.0% down · 7.5% · 30yr · 1.5% tax · 5.0% vac · 8.0% maint · 8.0% mgmt
Financing live
Cash to close
- Down payment
- $41,250
- Closing costs
- $4,950
- Reserves months
- —
- Total cash needed
- —
Loan-product check · same deal, 3 products live
Conventional
25% down · 7.5% · 30yr
- Down + closing
- —
- Monthly P&I
- —
- Monthly cashflow
- —
- DSCR
- —
- Eligible?
- —
Personal DTI + credit; lowest rate.
DSCR
20% down · 8.5% · 30yr
- Down + closing
- —
- Monthly P&I
- —
- Monthly cashflow
- —
- DSCR
- —
- Eligible?
- —
No personal income docs; deal must DSCR.
Hard money
10% down · 12.0% · 12mo
- Down + closing
- —
- Monthly P&I
- —
- Monthly cashflow
- —
- DSCR
- —
- Eligible?
- —
Short-term bridge; refi at stabilization.
Rent comps 8 comps
| Address | Beds | Baths | Sqft | Rent | $/sqft | DOM | Units | Dist |
|---|---|---|---|---|---|---|---|---|
| 1994 Falcon Ct Franklin, IN | 3.0 | 1.0 | 1008 | $1,590 | $1.58 | 45d | 1 | 0.74mi |
| 401 N Main St Unit 6A Franklin, IN | 2.0 | 1.0 | 900 | $650 | $0.72 | 25d | 1 | 0.75mi |
| 401 N Main St Unit 4B Franklin, IN | 2.0 | 1.0 | 900 | $1,350 | $1.50 | 9d | 1 | 0.75mi |
| 278 Walnut St Unit 6 Franklin, IN | 2.0 | 1.0 | 800 | $1,300 | $1.62 | 45d | 1 | 0.76mi |
| 278 Walnut St Unit 7 Franklin, IN | 2.0 | 1.0 | 800 | $1,300 | $1.62 | 0d | 1 | 0.76mi |
| 1037 W Jefferson St Franklin, IN | 2.0–3.0 | 2.0 | 1131 | $1,633 | $1.44 | 0d | 6 | 1.10mi |
| 7505 Founders Way Franklin, IN | 1.0–3.0 | 1.0–2.0 | 1045 | $2,038 | $1.95 | 0d | 16 | 1.26mi |
| 180 E South St Franklin, IN | 2.0 | 1.0 | 750 | $1,040 | $1.39 | 0d | 3 | 1.33mi |
Listing history 19 events
-
2026-04-28status Pending
-
2026-04-09$165,000 Active
-
2021-09-27soldstatus $118,000 Closed 211-char remark
Show marketing remark (211 chars)
Charming ranch home in Popular Franklin, Indiana. 3 bedrooms/1 Bath with a large Family Room for gatherings. Fenced in Back yard with a shed will keep you and pets busy while gardening. Updated flooring/Roof.
-
2021-08-13historical 211-char remark
Show marketing remark (211 chars)
Charming ranch home in Popular Franklin, Indiana. 3 bedrooms/1 Bath with a large Family Room for gatherings. Fenced in Back yard with a shed will keep you and pets busy while gardening. Updated flooring/Roof.
-
2021-08-12$117,500 211-char remark
Show marketing remark (211 chars)
Charming ranch home in Popular Franklin, Indiana. 3 bedrooms/1 Bath with a large Family Room for gatherings. Fenced in Back yard with a shed will keep you and pets busy while gardening. Updated flooring/Roof.
-
2017-10-13soldstatus $72,000 Sold 204-char remark
Show marketing remark (204 chars)
This quaint 3 bedroom one bath home in Franklin is awaiting you. This home has a fully fenced back yard and is just behind the post office. This home makes a great starter home for first time home buyers.
-
2017-09-12status Pending 204-char remark
Show marketing remark (204 chars)
This quaint 3 bedroom one bath home in Franklin is awaiting you. This home has a fully fenced back yard and is just behind the post office. This home makes a great starter home for first time home buyers.
-
2017-09-08status Active 204-char remark
Show marketing remark (204 chars)
This quaint 3 bedroom one bath home in Franklin is awaiting you. This home has a fully fenced back yard and is just behind the post office. This home makes a great starter home for first time home buyers.
-
2017-08-25status Pending 204-char remark
Show marketing remark (204 chars)
This quaint 3 bedroom one bath home in Franklin is awaiting you. This home has a fully fenced back yard and is just behind the post office. This home makes a great starter home for first time home buyers.
-
2017-08-21price $73,900 204-char remark
Show marketing remark (204 chars)
This quaint 3 bedroom one bath home in Franklin is awaiting you. This home has a fully fenced back yard and is just behind the post office. This home makes a great starter home for first time home buyers.
-
2017-07-28$78,500 Active 204-char remark
Show marketing remark (204 chars)
This quaint 3 bedroom one bath home in Franklin is awaiting you. This home has a fully fenced back yard and is just behind the post office. This home makes a great starter home for first time home buyers.
-
2008-09-19soldstatus $40,000
-
2008-07-18$40,000
-
2002-04-15soldstatus $36,000
-
2001-12-27$44,900
-
2001-12-15historical
-
2001-08-16$74,950
-
2000-10-15historical
-
2000-06-15$78,900
ⓘ Source: listings_history table (triggers on properties + properties_extension) + one-shot
backfill from property_details.listing_events for pre-trigger history.
Tax reassessment forecast IN · Partial reset (capped growth)
- Current annual tax
- $1,163 · $97/mo
- Projected year-2 tax
- $1,283 · $107/mo
- Expected delta
- +$120/yr (+$10/mo · 10.3%)
ⓘ Screening estimate from a state-policy table — verify with the county assessor before closing.
Climate risk First Street
- Flood 6/10 Major FEMA zone AO · 73% chance over 30 yrs
- Wildfire 1/10 Low
- Heat 4/10 Moderate 7 d/yr ≥101°F today · 19 d/yr by 30 yrs out
- Wind 2/10 Low 100% chance of damaging wind over 30 yrs
- Air quality 2/10 Low 1 unhealthy d/yr today · 1 by 30 yrs out
Nearby sold comps map
Loading sold comps map…
Walkable amenities ~0.75 mi
Loading nearby amenities…
Taxation est. · year 1
- Rental income
- $20,089
- − Mortgage interest
- −$9,243
- − Property taxes
- −$1,163
- − Insurance
- −$2,292
- − Repairs & maintenance
- −$1,607
- − Management
- −$1,607
- − Depreciation
- −$4,800
- Taxable loss
- −$623
- Est. tax savings @ 24.0%
- +$150
- After-tax cash flow
- $2,181/yr
For passive investors: Depreciation is non-cash, so a rental often shows a tax loss while cash-flowing — sheltering income. Rental losses are passive: they offset passive income freely, and up to $25,000/yr can offset ordinary (W-2) income if you actively participate and your MAGI is under $100k (phasing out to $0 by $150k); unused losses carry forward. On sale, claimed depreciation is recaptured at up to 25%, and gains may owe capital-gains tax (a 1031 exchange can defer both). Figures are a year-1 estimate at your 24.0% rate — not tax advice; consult a CPA.
Schools (NCES district)
- District
- Franklin Community School Corporation
- NCES district ID
- 1803690
- Math proficiency
- 36% ▼ -11.00%
- Reading proficiency
- 44% ▼ -8.00%
- Median HH income
- $54,855
- Composite
- 34.93/100
- National rank
- #5066
- State rank
- #133 of 301 in IN
Livability — Franklin
- Score
- 65/100
- State rank
- #351
- US rank
- #13428
Category grades
Schools grade is shown separately in the Schools card above.
Census & demographics
- Census place
- Franklin, IN
- County
- Johnson County · 154,261 people
- City population
- 34,647
- Metro
- Indianapolis-Carmel-Anderson, IN
- Population (ZIP)
- 34,647
- Household income
- $85,076
- Rent vs Own
- Severe rent burden
- 984.0
Population outlook (Johnson County) Hauer SSP2
- Today (2025)
- 170,080 people
- By 2030
- 179,983 · +5.8%
- By 2040
- 198,580 · +16.8%
- By 2050
- 214,661 · +26.2%
- By 2075
- 247,990 · +45.8%
- By 2100
- 257,821 · +51.6%
Race, ethnicity, and origin ACS 2023
- Neighborhood character
- Predominantly White (92%)
- Race & ethnicity
- White 92% Two or more races 4% Hispanic / Latino 2% Black 2%
- Common ancestry
- Slovak 2% Italian 1% Serbian 1%
- Foreign-born
- 2% · Canada
- Languages at home
- 97% English-only · Spanish 2% Russian/Polish/Slavic 1% Other Asian/Pacific 1%
Political lean MEDSL · Johnson
- 2024 margin
- Solid R (+34.3) · D 32.0% · R 66.3% · Other 1.7%
- 2008→2024 swing
- -8.9pp toward R · 2008: -25.5pp · 2024: -34.3pp
- All cycles
- 2024: R+34.3 2020: R+34.1 2016: R+42.5 2012: R+38.5 2008: R+25.5
Not yet ingested
- Civics
- —
Market trends
- HPI YoY
- ▼ -90.53%
- Current HPI
- 235.0009
- Rent YoY
- ▲ 4.68%
- Metro
- Indianapolis-Carmel-Anderson, IN
- State GDP YoY
- ▲ 2.90%
- F500 in state
- 18
Industry mix (Fortune 500 HQ in IN)
| Industry | F500 HQs | Revenue |
|---|---|---|
| Industrial Machinery | 2 | $37B |
|
||
| Healthcare | 1 | $177B |
|
||
| Pharmaceuticals | 1 | $45B |
|
||
| Metals / Steel | 1 | $18B |
|
||
| Agriculture | 1 | $17B |
|
||
| Packaging | 1 | $12B |
|
||
Price history
+109.1% since first listed19 events — show timeline
- 2026-04-28 Pending — MIBOR as Distributed by MLS Grid
- 2026-04-09 Listed $165,000 MIBOR as Distributed by MLS Grid
- 2021-09-27 Sold (MLS) $118,000 MIBOR as Distributed by MLS Grid
- 2021-08-13 Listing Removed — MIBOR as Distributed by MLS Grid
- 2021-08-12 Listed $117,500 MIBOR as Distributed by MLS Grid
- 2017-10-13 Sold (MLS) $72,000 MIBOR as Distributed by MLS Grid
- 2017-09-12 Pending — MIBOR as Distributed by MLS Grid
- 2017-09-08 Relisted — MIBOR as Distributed by MLS Grid
- 2017-08-25 Pending — MIBOR as Distributed by MLS Grid
- 2017-08-21 Price Changed $73,900 MIBOR as Distributed by MLS Grid
- 2017-07-28 Listed $78,500 MIBOR as Distributed by MLS Grid
- 2008-09-19 Sold (MLS) $40,000 MIBOR as Distributed by MLS Grid
- 2008-07-18 Listed $40,000 MIBOR as Distributed by MLS Grid
- 2002-04-15 Sold (MLS) $36,000 MIBOR as Distributed by MLS Grid
- 2001-12-27 Listed $44,900 MIBOR as Distributed by MLS Grid
- 2001-12-15 Listing Removed — MIBOR as Distributed by MLS Grid
- 2001-08-16 Listed $74,950 MIBOR as Distributed by MLS Grid
- 2000-10-15 Listing Removed — MIBOR as Distributed by MLS Grid
- 2000-06-15 Listed $78,900 MIBOR as Distributed by MLS Grid
Property tax history
+0.7%/yrLatest (2024): $1,163 · +8.0% YoY. Source: county tax records.
Cash-flow waterfall
monthlySold comps — $/sqft
last 12 mo · ≤1 miLoading sold comps…