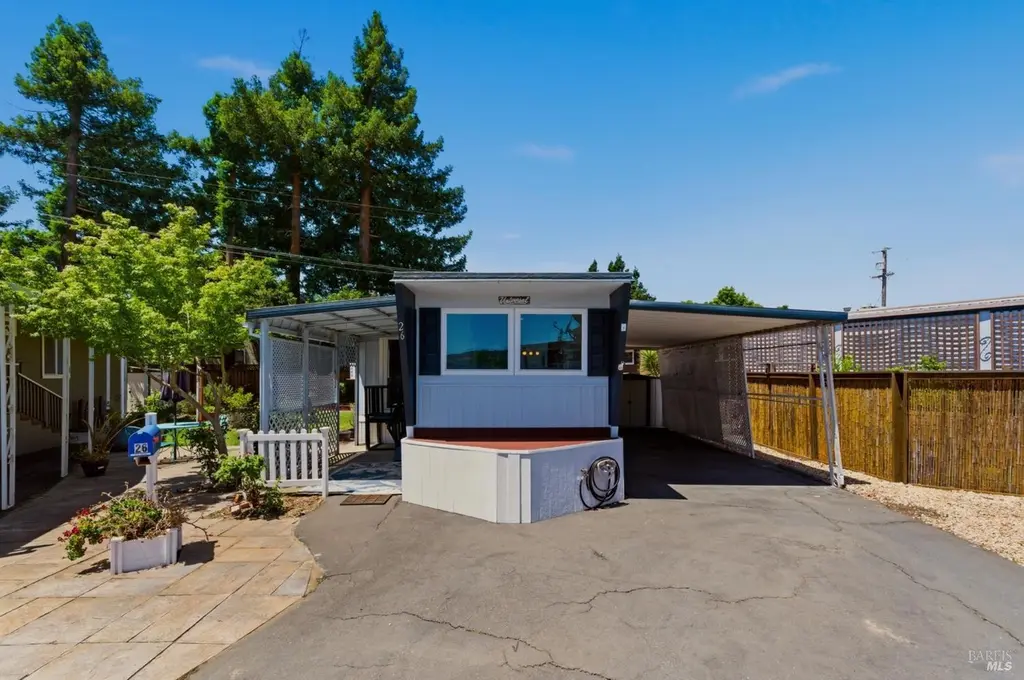
770 Lincoln Ave #26 · Napa, CA
Flood risk 8/10 · Major
- FEMA flood zone
- X (unshaded)
- Chance of flooding over 30 yrs
- 0.97%
- Est. flood insurance / yr
- $507 – $1,088
Fire risk 5/10 · Moderate
- Est. fire insurance / yr
- $659 – $1,223
Heat risk 5/10 · Moderate
- Hot days now (above 95°F)
- 7 days/yr
- Hot days in 30 yrs
- 15 days/yr
Wind risk 1/10 · Minimal
- Chance of severe wind over 30 yrs
- —
Air-quality risk 9/10 · Severe
- Unhealthy air days now
- 16 days/yr
- Unhealthy air days in 30 yrs
- 17 days/yr
Risk factors via First Street. Map © Google.
Why this score? — see what drove the B+ grade
The composite is a weighted blend of 9 inputs, each scored 0–100. Each bar is that input's sub-score; the figure is the points it added to the 100-point composite (weight × sub-score).
- Cash flow +30.0/30.0
- ARV discount +15.0/15.0
- 1% rule +10.0/10.0
- DSCR +10.0/10.0
- Schools +4.0/10.0
- Livability +3.5/5.0
- Condition / age +2.5/5.0
- Rent growth +2.4/5.0
- Appreciation +0.0/10.0
$79,500
🖨 Deal sheet 📄 Offer letter ✓ Due diligence
Listing remarks MLS
One bedroom, one bath home tucked away in a quiet senior community on Lincoln Ave. This home boasts a large yard for entertaining or just to enjoy a quiet evening in the Napa Valley.
Key facts
- Two storage sheds
- Peaceful setting
- Community atmosphere
Tags
Property features AI
Finance
- Financial info: Land lease applies; land lease amount $750
- HOA & community: No homeowners association; Senior community
Exterior
- Parking: Covered parking; on-street parking available (total 2 spaces)
- Utilities: Individual electric meter; Individual gas meter; Public sewer
- Home design: Manufactured home in park (single wide); Faces east; Property listed as fixer
- Construction: Skirting: aluminum, metal, and wood
- Exterior features: Covered deck with railing; Patio awning; Storage shed
Interior
- Kitchen: Breakfast area; Laminate countertops; Pantry cabinet; Free standing electric range; Free standing gas range
- Bedrooms: 1 bedroom
- Flooring: Laminate
- Bathrooms: 1 full bathroom; Shower stall; Low-flow toilet(s)
- Heating & cooling: Central heating; Window air conditioning unit(s)
- Interior features: Free standing electric range and free standing gas range; Gas water heater; Breakfast area; Laminate countertops; Pantry cabinet; Unfurnished
- Laundry & utility: No laundry facilities in unit
Neighborhood map
What this means for you Summary
Snapshot
- This is a 1-bed/1.0-bath manufactured listed at $80k.
Deal economics
- At list price, monthly cash flow is $1k ($14k/yr) — positive.
- The deal already cash-flows at list — no discount required.
- Meets the 1% rule at list price ($2k rent vs $80k).
- Recommended offer: $78k (1.5% below list) — sets the bar for market timing.
- Cap rate 24.8% vs local median 2.0% in Napa — top-decile yield for the area; either an underpriced asset or a hidden risk that comps aren't pricing in. Stress-test before assuming the spread holds.
Location & tenants
- Location reads 70/100 on livability (#227 in CA) — a middle-class / working-renter tenant base. Strengths: employment A+, health & safety A+, amenities B+; Watch: commute F, cost of living F.
- Napa Valley Unified (urban): math 35% / reading 48% proficiency, ranked #599 of 1,400 in CA (top 43%) — families likely to look elsewhere, expect single-tenant / working-renter base with shorter leases.
- Market conditions: Rents soft (-0.5%/yr); 538 active listings in the ZIP; 14 comparable units currently listed for rent nearby; rentals leasing fast (median 14d on market — plan ~1-2 weeks tenant-placement turnaround); high-income renter base; 427 units permitted in Napa County in 2024 (189 in 5+ unit buildings).
Forward outlook
- Local home prices are declining (-3.0%/yr); year-one equity from $550 of loan paydown is wiped out by about $2k of value loss. Plan a longer hold.
- Napa County population projected at +14% by 2050 — modest demand growth; plan on rents tracking national, not racing it.
- At projected returns (-3.0% appreciation + 0.0% rent growth), your $22k cash investment doubles in ~2 years — after that, you're playing with house money.
Negotiation context
- It's been on market 27 days — a 2% lower offer ($78k) is reasonable based on typical stale-listing flexibility.
- 2 sale attempts since 9y ago; this cycle's ask has dropped $6k (6%) from the opening price — seller is motivated, your offer sets the floor, not the list.
- Current owner paid $48k; list at $80k implies a 66% gain — meaningful room to come down on a strong offer.
Risks & watch-outs
- Watch-outs: flood insurance adds $66/mo.
- Climate carrying-cost: severe flood risk; moderate wildfire risk; extreme-heat days projected 7→15/yr by 2055 (HVAC capex compounding) — expect insurance premiums to compound above CPI over the hold.
Questions for the listing agent
- Built in 1962 — when were the roof, HVAC, electrical panel, plumbing, and water heater last replaced?
- What's the actual annual flood-insurance premium (NFIP or private), and is the property in a SFHA with mandatory coverage?
- Is there a deadline driving the sale (1031 exchange, divorce, estate, relocation)? That informs how much negotiation room exists.
- What's the average days-on-market for RENTAL listings here right now (not sales)? A rising rental-DOM trend means longer vacancies and softer asking-rent achievability than the comps imply.
- What's the recent tenant-quality profile in this submarket — average credit score on applications, eviction rate, late-payment / NSF rate, and stable-employment percentage? A property-management company in the area should have these aggregated.
- How much new for-sale + rental construction is in the pipeline within 1–3 miles? Heavy new supply typically softens prices + rents 12–24 months out; constrained supply supports both.
Investment metrics
- 1% rule
- 2.83% ✓
- Cap rate
- 24.79%
- Cash-on-cash
- 66.04%
- DSCR
- 3.94
- GRM
- 2.9
CMA / ARV
- ARV (on-the-fly)
- $96,250
- Comps found
- 1
Show comp detail 1 sale within ~0.75 mi
| Address | Dist | Beds/Ba | Sqft | Sold | Price | $/sf | Match |
|---|---|---|---|---|---|---|---|
| 770 Lincoln Ave #48 | 0.00mi | 1/1.0 | 600 (+9%) | 8mo | $105,000 | $175 | 78 |
Match score weights: distance 35% · size 25% · config 20% · recency 20%. Top-matched comps best support the ARV.
Projected returns pro-forma
-3.0% appreciation · 0.0% rent growth · sell at horizon
- IRR
- 57.9%
- Equity multiple
- 3.44×
- Total profit
- $54,406
- Equity at exit
- $11,854
- IRR
- 61.6%
- Equity multiple
- 6.27×
- Total profit
- $117,264
- Equity at exit
- $6,874
Cash invested: $22,260 (down + closing). Projections, not guarantees.
Landlord ↔ Tenant lean methodology
- Overall (STATE)
- 18 Strongly Tenant-Friendly
- State California
- 18 Strongly Tenant-Friendly · D+13
- County
- — inherits STATE
- City
- — inherits STATE
ZIP-level market 94558
- Rents YoY
- -0.5%
- Active inventory
- 538
- Price-to-rent
- 2.9×
Monthly cashflow live
- Estimated rent
- $2,246 high interval (Pro) →
- Mortgage (P&I)
- −$417
- Tax est. 1.5%
- −$99 /mo · $1,192/yr
- Insurance
- −$33
- Flood insurance flood zone
- −$66 /mo · $798/yr
- HOA
- −$0
- Vacancy / Maint / Mgmt
- −$472
- Net cashflow
- $1,159
Break-even live
UW: 25.0% down · 7.5% · 30yr · 1.5% tax · 5.0% vac · 8.0% maint · 8.0% mgmt
Financing live
Cash to close
- Down payment
- $19,875
- Closing costs
- $2,385
- Reserves months
- —
- Total cash needed
- —
Loan-product check · same deal, 3 products live
Conventional
25% down · 7.5% · 30yr
- Down + closing
- —
- Monthly P&I
- —
- Monthly cashflow
- —
- DSCR
- —
- Eligible?
- —
Personal DTI + credit; lowest rate.
DSCR
20% down · 8.5% · 30yr
- Down + closing
- —
- Monthly P&I
- —
- Monthly cashflow
- —
- DSCR
- —
- Eligible?
- —
No personal income docs; deal must DSCR.
Hard money
10% down · 12.0% · 12mo
- Down + closing
- —
- Monthly P&I
- —
- Monthly cashflow
- —
- DSCR
- —
- Eligible?
- —
Short-term bridge; refi at stabilization.
Rent comps 14 comps
| Address | Beds | Baths | Sqft | Rent | $/sqft | DOM | Units | Dist |
|---|---|---|---|---|---|---|---|---|
| 847 Central Ave Unit A Napa, CA | 2.0 | 1.0 | 660 | $2,300 | $3.48 | 43d | 1 | 0.11mi |
| 727 Central Ave Napa, CA | 1.0–2.0 | 1.0–2.0 | 1210 | $2,420 | $2.00 | 13d | 7 | 0.13mi |
| 700 Stonehouse Dr Napa, CA | 1.0–3.0 | 1.0–2.0 | 1045 | $2,453 | $2.35 | 13d | 8 | 0.40mi |
| 601 River Glen Dr Napa, CA | 1.0 | 1.0 | 700 | $2,018 | $2.88 | 23d | 3 | 0.43mi |
| 550 River Glen Dr Napa, CA | 1.0–2.0 | 1.0 | 790 | $1,898 | $2.40 | 13d | 12 | 0.44mi |
| 2942 Soscol Ave Napa, CA | 1.0–2.0 | 1.0–2.0 | 898 | $2,376 | $2.64 | 13d | 18 | 0.59mi |
| 3200 Soscol Ave Napa, CA | 1.0–2.0 | 1.0–2.0 | 874 | $2,389 | $2.73 | 13d | 13 | 0.69mi |
| 713 Trancas St Napa, CA | 1.0–2.0 | 1.0 | 833 | $1,949 | $2.34 | 13d | 6 | 0.74mi |
| 3285 Beard Rd Unit 3271 Napa, CA | 1.0 | 1.0 | 616 | $1,950 | $3.17 | 13d | 1 | 0.77mi |
| 463 Coffield Ave Apt 8 Napa, CA | 2.0 | 1.0 | 700 | $2,099 | $3.00 | 23d | 1 | 1.09mi |
| 2123 2nd St Napa, CA | 1.0 | 1.0 | 500 | $2,045 | $4.09 | 43d | 1 | 1.20mi |
| 2614 1st St Napa, CA | 1.0–2.0 | 1.0–2.0 | 867 | $2,245 | $2.59 | 13d | 2 | 1.27mi |
| 2638 1st St Napa, CA | 1.0–3.0 | 1.0–2.0 | 902 | $2,275 | $2.52 | 13d | 6 | 1.29mi |
| 511 Riverside Dr Unit RIV515 Napa, CA | 1.0 | 1.0 | 732 | $1,875 | $2.56 | 43d | 1 | 1.40mi |
Listing history 22 events
-
2026-06-18days on market $79,500 Active 27 DOM
-
2026-06-17days on market $79,500 Active 26 DOM
-
2026-06-16days on market $79,500 Active 25 DOM
-
2026-06-15days on market $79,500 Active 24 DOM
-
2026-06-14pricedays on market $79,500 Active 22 DOM
-
2026-06-13days on market $85,000 Active 21 DOM
-
2026-06-10days on market $85,000 Active 19 DOM
-
2026-06-09days on market $85,000 Active 18 DOM
-
2026-06-08days on market $85,000 Active 17 DOM
-
2026-06-07days on market $85,000 Active 16 DOM
-
2026-06-05days on market $85,000 Active 13 DOM
-
2026-06-03days on market $85,000 Active 12 DOM
-
2026-06-02days on market $85,000 Active 11 DOM
-
2026-06-01days on market $85,000 Active 10 DOM
-
2026-05-31days on market $85,000 Active 9 DOM
-
2026-05-30days on market $85,000 Active 8 DOM
-
2026-05-22$85,000 Active
-
2017-07-06soldstatus $48,000 Sold 182-char remark
Show marketing remark (182 chars)
One bedroom, one bath home tucked away in a quiet senior community on Lincoln Ave. This home boasts a large yard for entertaining or just to enjoy a quiet evening in the Napa Valley.
-
2017-07-02status Pending 182-char remark
Show marketing remark (182 chars)
One bedroom, one bath home tucked away in a quiet senior community on Lincoln Ave. This home boasts a large yard for entertaining or just to enjoy a quiet evening in the Napa Valley.
-
2017-06-19historical Contingent 182-char remark
Show marketing remark (182 chars)
One bedroom, one bath home tucked away in a quiet senior community on Lincoln Ave. This home boasts a large yard for entertaining or just to enjoy a quiet evening in the Napa Valley.
-
2017-06-09price $55,900 182-char remark
Show marketing remark (182 chars)
One bedroom, one bath home tucked away in a quiet senior community on Lincoln Ave. This home boasts a large yard for entertaining or just to enjoy a quiet evening in the Napa Valley.
-
2017-05-23$57,500 Active 182-char remark
Show marketing remark (182 chars)
One bedroom, one bath home tucked away in a quiet senior community on Lincoln Ave. This home boasts a large yard for entertaining or just to enjoy a quiet evening in the Napa Valley.
ⓘ Source: listings_history table (triggers on properties + properties_extension) + one-shot
backfill from property_details.listing_events for pre-trigger history.
Climate risk First Street
- Flood 8/10 Severe FEMA zone X (unshaded) · 97% chance over 30 yrs
- Wildfire 5/10 Major
- Heat 5/10 Major 7 d/yr ≥95°F today · 15 d/yr by 30 yrs out
- Wind 1/10 Low
- Air quality 9/10 Extreme 16 unhealthy d/yr today · 17 by 30 yrs out
Nearby sold comps map
Loading sold comps map…
Walkable amenities ~0.75 mi
Loading nearby amenities…
Taxation est. · year 1
- Rental income
- $26,955
- − Mortgage interest
- −$4,453
- − Property taxes
- −$1,192
- − Insurance
- −$1,195
- − Repairs & maintenance
- −$2,156
- − Management
- −$2,156
- − Depreciation
- −$2,313
- Taxable income
- $13,489
- Est. tax owed @ 24.0%
- −$3,237
- After-tax cash flow
- $10,667/yr
For passive investors: Depreciation is non-cash, so a rental often shows a tax loss while cash-flowing — sheltering income. Rental losses are passive: they offset passive income freely, and up to $25,000/yr can offset ordinary (W-2) income if you actively participate and your MAGI is under $100k (phasing out to $0 by $150k); unused losses carry forward. On sale, claimed depreciation is recaptured at up to 25%, and gains may owe capital-gains tax (a 1031 exchange can defer both). Figures are a year-1 estimate at your 24.0% rate — not tax advice; consult a CPA.
Schools (NCES district)
- District
- Napa Valley Unified
- NCES district ID
- 0626640
- Math proficiency
- 35% ▲ 1.00%
- Reading proficiency
- 48% ▲ 2.00%
- Median HH income
- $72,007
- Composite
- 40.18/100
- National rank
- #7827
- State rank
- #599 of 1400 in CA
Livability — Napa
- Score
- 70/100
- State rank
- #227
- US rank
- #7435
Category grades
Schools grade is shown separately in the Schools card above.
Census & demographics
- Census place
- Napa, CA
- County
- Napa County · 120,669 people
- City population
- 91,371
- Metro
- Napa, CA
- Population (ZIP)
- 63,657
- Household income
- $113,269
- Rent vs Own
- Severe rent burden
- 2095.0
Population outlook (Napa County) Hauer SSP2
- Today (2025)
- 153,987 people
- By 2030
- 159,490 · +3.6%
- By 2040
- 168,796 · +9.6%
- By 2050
- 176,213 · +14.4%
- By 2075
- 190,113 · +23.5%
- By 2100
- 190,528 · +23.7%
Race, ethnicity, and origin ACS 2023
- Neighborhood character
- Diverse neighborhood (Simpson 0.56)
- Race & ethnicity
- White 54% Hispanic / Latino 37% Two or more races 15% Asian 3% Native American 1%
- Hispanic origin (detail)
- Mexican 31%
- Common ancestry
- Italian 4% Lithuanian 2% Portuguese 2%
- Foreign-born
- 21% · Canada
- Languages at home
- 68% English-only · Spanish 28% Other Indo-European 1% Tagalog/Filipino 1%
Political lean MEDSL · Napa
- 2024 margin
- Solid D (+34.9) · D 65.9% · R 31.1% · Other 3.0%
- 2008→2024 swing
- +2.4pp toward D · 2008: 32.5pp · 2024: 34.9pp
- All cycles
- 2024: D+34.9 2020: D+40.4 2016: D+35.2 2012: D+25.7 2008: D+32.5
Not yet ingested
- Civics
- —
Market trends
- HPI YoY
- ▼ -842.94%
- Current HPI
- 296.0661
- Rent YoY
- ▼ -0.50%
- Metro
- Napa, CA
- State GDP YoY
- ▲ 3.21%
- F500 in state
- 116
Industry mix (Fortune 500 HQ in CA)
| Industry | F500 HQs | Revenue |
|---|---|---|
| Technology | 27 | $1,492B |
|
||
| Financial Services | 3 | $174B |
|
||
| Retail | 3 | $44B |
|
||
| Insurance | 3 | $26B |
|
||
| Media / Entertainment | 2 | $115B |
|
||
| Pharmaceuticals / Biotech | 2 | $62B |
|
||
Price history
+47.8% since first listed6 events — show timeline
- 2026-05-22 Listed $85,000 BAREIS
- 2017-07-06 Sold (MLS) $48,000 BAREIS
- 2017-07-02 Pending — BAREIS
- 2017-06-19 Contingent — BAREIS
- 2017-06-09 Price Changed $55,900 BAREIS
- 2017-05-23 Listed $57,500 BAREIS
Cash-flow waterfall
monthlySold comps — $/sqft
last 12 mo · ≤1 miLoading sold comps…