125 Freeport St · Delmont, PA
Flood risk 1/10 · Minimal
- FEMA flood zone
- X (unshaded)
- Chance of flooding over 30 yrs
- 0.0%
- Est. flood insurance / yr
- $507 – $1,088
Fire risk 1/10 · Minimal
- Est. fire insurance / yr
- $511 – $949
Heat risk 3/10 · Minor
- Hot days now (above 95°F)
- 7 days/yr
- Hot days in 30 yrs
- 18 days/yr
Wind risk 2/10 · Minimal
- Chance of severe wind over 30 yrs
- —
Air-quality risk 3/10 · Minor
- Unhealthy air days now
- 3 days/yr
- Unhealthy air days in 30 yrs
- 5 days/yr
Risk factors via First Street. Map © Google.
Why this score? — see what drove the F grade
The composite is a weighted blend of 9 inputs, each scored 0–100. Each bar is that input's sub-score; the figure is the points it added to the 100-point composite (weight × sub-score).
- ARV discount +7.5/15.0
- Livability +3.6/5.0
- Schools +3.5/10.0
- Rent growth +2.5/5.0
- Condition / age +2.5/5.0
- Cash flow +0.0/30.0
- 1% rule +0.0/10.0
- DSCR +0.0/10.0
- Appreciation +0.0/10.0
$189,900
🖨 Deal sheet 📄 Offer letter ✓ Due diligence
Listing remarks
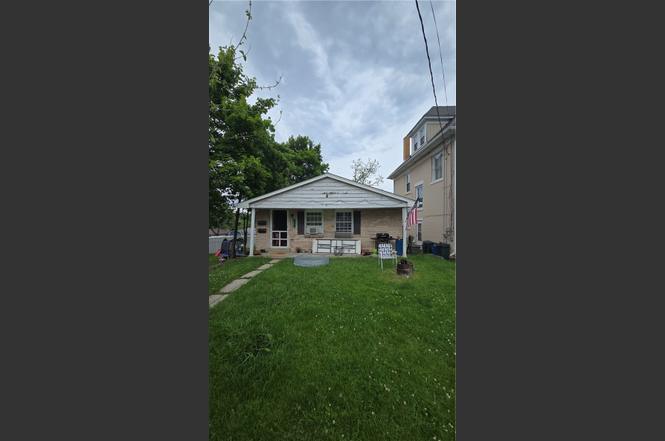
Welcome to 125 Freeport Street, a well-maintained duplex offering two levels of finished living space in the heart of Delmont. This income-producing property presents an excellent opportunity for investors seeking strong rental potential in a desirable and convenient location. The front unit features an upper-level living area, a finished basement, and a covered front porch, while the rear unit offers an upper-level living area, a finished basement, and a private rear deck. Both units are separately metered for gas and electric and include private entrances, individual furnaces, and separate hot water tanks, providing ease of management and added tenant convenience. Each unit also includes
Key facts
- Covered front porch
- Separately metered
- Private rear deck
Tags
Property features AI
Finance
- Financial info: Two total units; Gross income reported: $2,025; Unit rents reported: $1,000 and $1,025; Maintenance expense: $4,743; Utilities expense: $374; Insurance expense: $950; Other expense: $445
Exterior
- Parking: Off-street parking; total 3 spaces
- Utilities: Electricity available; Natural gas available; Public water available; Public sewer available
- Home design: Multi-family property (2 units)
- Construction: Brick and vinyl siding exterior; Shake roof
- Exterior features: Off-street parking for three vehicles; Zoned MUL (multi-unit); Public transportation nearby
Interior
- Bedrooms: Two 2-bedroom units
- Bathrooms: Each unit has one full bathroom
- Interior features: Finished basement
Neighborhood map
What this means for you Summary
Snapshot
- This is a 4-bed/2.0-bath other listed at $190k.
Deal economics
- At list price, monthly cash flow is $-1k ($-16k/yr) — negative.
- Rent doesn't cover operating costs at any purchase price — skip.
Location & tenants
- Location reads 72/100 on livability (#663 in PA) — a middle-class / working-renter tenant base. Strengths: crime A+, cost of living A+, housing A+; Watch: schools D+, amenities F, commute F.
- Greensburg Salem SD (suburban): math 31% / reading 52% proficiency, ranked #346 of 539 in PA (top 64%) — families likely to look elsewhere, expect single-tenant / working-renter base with shorter leases.
- Market conditions: 22 active listings in the ZIP; 415 units permitted in Westmoreland County in 2024 (10 in 5+ unit buildings).
Forward outlook
- Local home prices are declining (-3.0%/yr); year-one equity from $1k of loan paydown is wiped out by about $6k of value loss. Plan a longer hold.
- Westmoreland County population projected at -19% by 2050 — secular population decline; favor cash flow + early exit over multi-decade hold.
Negotiation context
- Only 2 days on market — expect competitive offers; lowballing is unlikely to land.
- Current owner paid $98k; list at $190k implies a 94% gain — meaningful room to come down on a strong offer.
Questions for the listing agent
- What do current leases actually rent for vs. the listed asking? Can we see a recent rent roll and the last 12 months of T-12 income?
- Built in 1967 — when were the roof, HVAC, electrical panel, plumbing, and water heater last replaced?
- Is there a deadline driving the sale (1031 exchange, divorce, estate, relocation)? That informs how much negotiation room exists.
- Schools are D-rated, which usually means shorter tenancies and higher turnover. Who's the typical renter profile here, and what's been the actual vacancy rate?
- The area grade is low — what's the realistic commute time and amenity access for the typical tenant pool here? Any planned neighborhood developments (good or bad) we should know about?
- What's the average days-on-market for RENTAL listings here right now (not sales)? A rising rental-DOM trend means longer vacancies and softer asking-rent achievability than the comps imply.
- What's the recent tenant-quality profile in this submarket — average credit score on applications, eviction rate, late-payment / NSF rate, and stable-employment percentage? A property-management company in the area should have these aggregated.
- How much new for-sale + rental construction is in the pipeline within 1–3 miles? Heavy new supply typically softens prices + rents 12–24 months out; constrained supply supports both.
Investment metrics
- 1% rule
- 0.00% ✗
- Cap rate
- -2.29%
- Cash-on-cash
- -30.64%
- DSCR
- -0.36
- GRM
- 0.0
CMA / ARV
No comps found within radius.
Projected returns pro-forma
-3.0% appreciation · 3.0% rent growth · sell at horizon
- IRR
- -90.3%
- Equity multiple
- -1.20×
- Total profit
- $-117,213
- Equity at exit
- $28,315
- IRR
- —
- Equity multiple
- -3.01×
- Total profit
- $-213,297
- Equity at exit
- $16,419
Cash invested: $53,172 (down + closing). Projections, not guarantees.
Landlord ↔ Tenant lean methodology
- Overall (STATE)
- 62 Landlord-Friendly
- State Pennsylvania
- 62 Landlord-Friendly · EVEN
- County
- — inherits STATE
- City
- — inherits STATE
ZIP-level market 15626
- Active inventory
- 22
Monthly cashflow live
- Estimated rent
- $0 none
- Mortgage (P&I)
- −$996
- Tax from tax record
- −$283 /mo · $3,392/yr
- Insurance
- −$79
- HOA
- −$0
- Vacancy / Maint / Mgmt
- −$0
- Net cashflow
- $-1,358
Break-even live
UW: 25.0% down · 7.5% · 30yr · 1.5% tax · 5.0% vac · 8.0% maint · 8.0% mgmt
Financing live
Cash to close
- Down payment
- $47,475
- Closing costs
- $5,697
- Reserves months
- —
- Total cash needed
- —
Loan-product check · same deal, 3 products live
Conventional
25% down · 7.5% · 30yr
- Down + closing
- —
- Monthly P&I
- —
- Monthly cashflow
- —
- DSCR
- —
- Eligible?
- —
Personal DTI + credit; lowest rate.
DSCR
20% down · 8.5% · 30yr
- Down + closing
- —
- Monthly P&I
- —
- Monthly cashflow
- —
- DSCR
- —
- Eligible?
- —
No personal income docs; deal must DSCR.
Hard money
10% down · 12.0% · 12mo
- Down + closing
- —
- Monthly P&I
- —
- Monthly cashflow
- —
- DSCR
- —
- Eligible?
- —
Short-term bridge; refi at stabilization.
Listing history 3 events
-
2026-06-18days on market $189,900 Active 2 DOM
-
2026-06-16remarks 699-char remark
-
2026-06-16$189,900 Active 1 DOM
ⓘ Source: listings_history table (triggers on properties + properties_extension) + one-shot
backfill from property_details.listing_events for pre-trigger history.
Tax reassessment forecast PA · Partial reset (capped growth)
- Current annual tax
- $3,392 · $283/mo
- Projected year-2 tax
- $3,392 · $283/mo
- Expected delta
- $0/yr ($0/mo · 0.0%)
ⓘ Screening estimate from a state-policy table — verify with the county assessor before closing.
Climate risk First Street
- Flood 1/10 Low FEMA zone X (unshaded) · 0% chance over 30 yrs
- Wildfire 1/10 Low
- Heat 3/10 Moderate 7 d/yr ≥95°F today · 18 d/yr by 30 yrs out
- Wind 2/10 Low
- Air quality 3/10 Moderate 3 unhealthy d/yr today · 5 by 30 yrs out
Nearby sold comps map
Loading sold comps map…
Walkable amenities ~0.75 mi
Loading nearby amenities…
Taxation est. · year 1
- Rental income
- $0
- − Mortgage interest
- −$10,637
- − Property taxes
- −$3,392
- − Insurance
- −$950
- − Repairs & maintenance
- −$0
- − Management
- −$0
- − Depreciation
- −$5,524
- Taxable loss
- −$20,503
- Est. tax savings @ 24.0%
- +$4,921
- After-tax cash flow
- $-11,371/yr
For passive investors: Depreciation is non-cash, so a rental often shows a tax loss while cash-flowing — sheltering income. Rental losses are passive: they offset passive income freely, and up to $25,000/yr can offset ordinary (W-2) income if you actively participate and your MAGI is under $100k (phasing out to $0 by $150k); unused losses carry forward. On sale, claimed depreciation is recaptured at up to 25%, and gains may owe capital-gains tax (a 1031 exchange can defer both). Figures are a year-1 estimate at your 24.0% rate — not tax advice; consult a CPA.
Schools (NCES district)
- District
- Greensburg Salem SD
- NCES district ID
- 4210920
- Math proficiency
- 31% ▼ -21.00%
- Reading proficiency
- 52% ▼ -15.00%
- Median HH income
- $41,295
- Composite
- 34.82/100
- National rank
- #5101
- State rank
- #346 of 539 in PA
Livability — Delmont
- Score
- 72/100
- State rank
- #663
- US rank
- #6485
Category grades
Schools grade is shown separately in the Schools card above.
Census & demographics
- Census place
- Delmont, PA
- City population
- 5,168
- Population (ZIP)
- 5,168
Population outlook (Westmoreland County) Hauer SSP2
- Today (2025)
- 342,555 people
- By 2030
- 331,717 · -3.2%
- By 2040
- 304,976 · -11.0%
- By 2050
- 277,444 · -19.0%
- By 2075
- 224,607 · -34.4%
- By 2100
- 171,084 · -50.1%
Race, ethnicity, and origin ACS 2023
- Neighborhood character
- Predominantly White (92%)
- Race & ethnicity
- White 92% Two or more races 4% Asian 4%
- Common ancestry
- Romanian 8% Serbian 4% Italian 3%
- Foreign-born
- 3% · China, Canada
- Languages at home
- 94% English-only · Other Indo-European 2% Chinese 2% Other Asian/Pacific 1%
Political lean MEDSL · Westmoreland
- 2024 margin
- Strong R (+28.4) · D 35.4% · R 63.9%
- 2008→2024 swing
- -11.7pp toward R · 2008: -16.7pp · 2024: -28.4pp
- All cycles
- 2024: R+28.4 2020: R+28.3 2016: R+31.3 2012: R+23.7 2008: R+16.7
Not yet ingested
- Civics
- —
Market trends
- HPI YoY
- ▼ -103.96%
- Current HPI
- 179.0345
- Rent YoY
- —
- Metro
- —
- State GDP YoY
- ▲ 1.68%
- F500 in state
- 34
Industry mix (Fortune 500 HQ in PA)
| Industry | F500 HQs | Revenue |
|---|---|---|
| Healthcare | 2 | $309B |
|
||
| Insurance | 2 | $27B |
|
||
| Telecommunications / Media | 1 | $124B |
|
||
| Industrial Distribution | 1 | $22B |
|
||
| Financial Services | 1 | $20B |
|
||
| Chemicals / Materials | 1 | $18B |
|
||
Price history
+93.8% since first listed2 events — show timeline
- 2026-06-09 Listed $189,900 West Penn MLS
- 2017-09-26 Sold (Public Records) $98,000 Public Records
Property tax history
+2.3%/yrLatest (2026): $3,392 · +0.0% YoY. Source: county tax records.
Cash-flow waterfall
monthlySold comps — $/sqft
last 12 mo · ≤1 miLoading sold comps…