 Multi-family
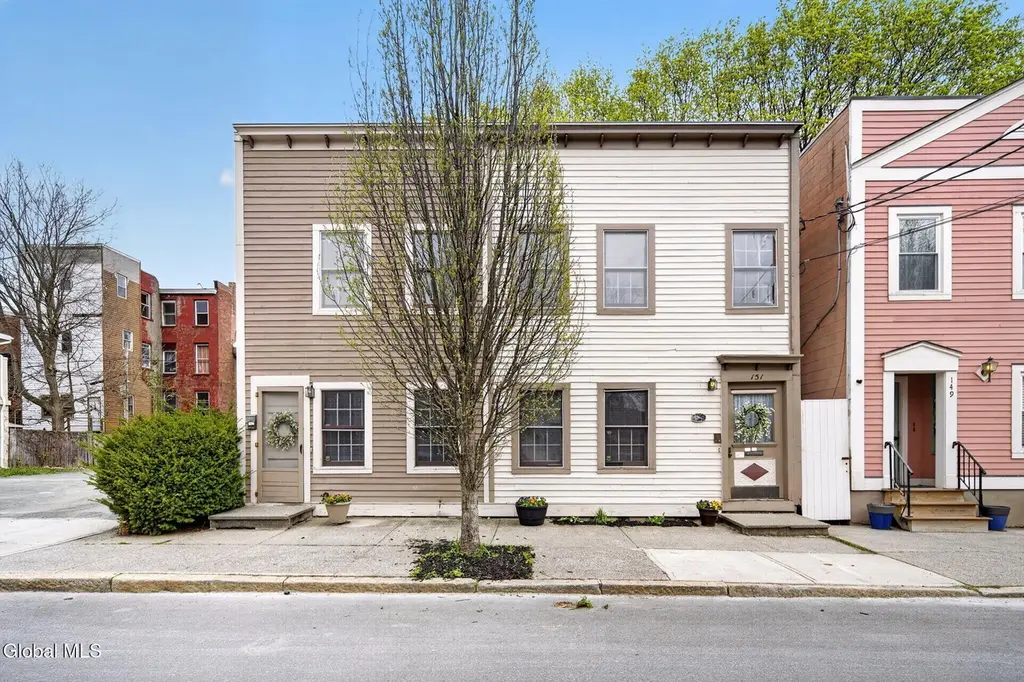
151 Jefferson St · Albany, NY
Flood risk 1/10 · Minimal
- FEMA flood zone
- X (unshaded)
- Chance of flooding over 30 yrs
- 0.0%
- Est. flood insurance / yr
- $473 – $860
Fire risk 1/10 · Minimal
- Est. fire insurance / yr
- $691 – $1,283
Heat risk 4/10 · Minor
- Hot days now (above 97°F)
- 7 days/yr
- Hot days in 30 yrs
- 16 days/yr
Wind risk 3/10 · Minor
- Chance of severe wind over 30 yrs
- 6.0%
Air-quality risk 1/10 · Minimal
- Unhealthy air days now
- 0 days/yr
- Unhealthy air days in 30 yrs
- 0 days/yr
Risk factors via First Street. Map © Google.
Why this score? — see what drove the B grade
The composite is a weighted blend of 9 inputs, each scored 0–100. Each bar is that input's sub-score; the figure is the points it added to the 100-point composite (weight × sub-score).
- Cash flow +25.2/30.0
- ARV discount +15.0/15.0
- DSCR +8.3/10.0
- 1% rule +7.2/10.0
- Rent growth +4.2/5.0
- Livability +4.0/5.0
- Schools +3.2/10.0
- Condition / age +2.5/5.0
- Appreciation +2.0/10.0
$389,800
🖨 Deal sheet 📄 Offer letter ✓ Due diligence
Multi-family units
County records classify this as Multi-Family (2-4 Unit). Listing-text estimate: 1 unit. estimate disagrees with records
Listing remarks
Historic and truly unique property located between Lark Street's Business/Restaurant District and Albany's Downtown including the Empire State Plaza, Museum, Capitol Building, and State Street Offices! 151 Jefferson St. offers 3 units - 2 (1) bed and 1 (2) bed apartments - that have been restored from its original mid-19th century construction by highly regarded and award-winning owners. The entire property encompasses what was formerly 2 buildings (sometimes referred to as 151 and 151 B), with Units A and B residing on the first floor while Unit C occupies the entirety of the 2nd floor. Unit A is 1 bed/1bath and features a striking fireplace and mantel that serve as the centerpiece of the
Key facts
- Historic property
- Natural light
- Unique property
Tags
Property features AI
Finance
- Financial info: 3 total units; Tenants pay electricity and gas; Owner pays water and sewer
Exterior
- Parking: Off-street parking (11 spaces)
- Utilities: Public water; Public sewer; Circuit breaker electrical service; Cable available
- Home design: Triplex; Wood siding construction
- Construction: Rubber roof
- Exterior features: Deck; Garden
Interior
- Bedrooms: Unit 1: 1 bedroom (level: not specified); Unit 2: 1 bedroom (level: not specified); Unit 3: 2 bedrooms (level: not specified)
- Bathrooms: 3 full bathrooms total; Two full bathrooms on the 1st level and one full bathroom on the 2nd level
- Heating & cooling: Baseboard heating; Electric heating; Space heater(s); Natural gas heating
- Interior features: Built-in features; Unfinished basement; Has fireplace (1 total)
- Laundry & utility: Laundry located in the basement
Neighborhood map
What this means for you Summary
Snapshot
- This is a 4-bed/3.0-bath multifamily listed at $390k.
Deal economics
- At list price, monthly cash flow is $874 ($10k/yr) — positive.
- The deal already cash-flows at list — no discount required.
- Meets the 1% rule at list price ($5k rent vs $390k).
- Cap rate 9.0% vs local median 5.7% in Albany — top-decile yield for the area; either an underpriced asset or a hidden risk that comps aren't pricing in. Stress-test before assuming the spread holds.
Location & tenants
- Location reads 79/100 on livability (#129 in NY, #2,083 nationally) — a middle-class / working-renter tenant base. Strengths: amenities A+, commute A+, housing A+; Watch: employment C-, crime F.
- Albany City School District (urban): math 37% / reading 40% proficiency, ranked #543 of 590 in NY (top 92%) — families likely to look elsewhere, expect single-tenant / working-renter base with shorter leases; 66% free/reduced lunch — lower-income household profile, screen leases tightly.
- Zoned schools: Albany High School (math 74% / reading 67%, grade B+, #710 of 1,100 statewide, top 65%, 2,676 students, 69% FRL) — zoned schools at 69% FRL track the district average.
- Zoned-school proficiency averages 70% at this address vs 38% district-wide (+32 pts) — the actual schools serving this property are materially stronger than the Albany City School District average implies; a family-tenant draw the district grade alone would hide.
- Market conditions: Rents rising fast (+6.9%/yr); 70 active listings in the ZIP; 6 comparable units currently listed for rent nearby; rentals lingering (median 44d on market — plan ~5-8 weeks vacancy on turnover, expect pricing pressure); 83% of comp listings sitting > 30 days — soft ceiling on asking rent; 675 units permitted in Albany County in 2024 (451 in 5+ unit buildings).
- At $4,769/mo this rent would consume 102% of the median local household income ($56k/yr) (locally 1211% of renters already pay >50% of income on rent) — very limited rent-growth headroom before tenants either downsize or default.
Forward outlook
- Local home prices are declining (-3.0%/yr); year-one equity from $3k of loan paydown is wiped out by about $12k of value loss. Plan a longer hold.
- Albany County population projected at +9% by 2050 — modest demand growth; plan on rents tracking national, not racing it.
- At projected returns (-3.0% appreciation + 6.9% rent growth), your $109k cash investment doubles in ~8 years — after that, you're playing with house money.
Negotiation context
- Only 12 days on market — expect competitive offers; lowballing is unlikely to land.
Risks & watch-outs
- Watch-outs: built in 1842 — expect roof / HVAC / electrical / plumbing capex.
Questions for the listing agent
- Built in 1842 — when were the roof, HVAC, electrical panel, plumbing, and water heater last replaced?
- Is there a deadline driving the sale (1031 exchange, divorce, estate, relocation)? That informs how much negotiation room exists.
- Crime grade is F in this area — have there been break-ins, vandalism, or insurance claims at this property in the last 3 years? What carrier currently insures it and at what premium?
- What's the average days-on-market for RENTAL listings here right now (not sales)? A rising rental-DOM trend means longer vacancies and softer asking-rent achievability than the comps imply.
- What's the recent tenant-quality profile in this submarket — average credit score on applications, eviction rate, late-payment / NSF rate, and stable-employment percentage? A property-management company in the area should have these aggregated.
- How much new apartment / multifamily construction is in the pipeline within 1–3 miles? Heavy new supply (>2% of stock underway) typically softens rents 12–24 months out; light construction supports rent growth.
Investment metrics
- 1% rule
- 1.22% ✓
- Cap rate
- 8.98%
- Cash-on-cash
- 9.61%
- DSCR
- 1.43
- GRM
- 6.8
CMA / ARV
- ARV (median comp)
- $508,188
- List price
- $389,800
- Delta
- -23.30%
- Verdict
- UNDERPRICED
- Comps
- 20 within 1.0 mi
Show comp detail 12 sales within ~0.75 mi
| Address | Dist | Beds/Ba | Sqft | Sold | Price | $/sf | Match |
|---|---|---|---|---|---|---|---|
| 208 Elm St | 0.06mi | 4/3.0 | 2,508 (+4%) | 3mo | $420,000 | $167 | 88 |
| 184 Elm St | 0.09mi | 4/2.0 | 2,394 (-1%) | 7mo | $375,000 | $157 | 84 |
| 285.5 Hudson Ave | 0.16mi | 4/4.0 | 2,478 (+3%) | 5mo | $430,000 | $174 | 80 |
| 369 Madison Ave | 0.06mi | 3/2.0 (-1) | 2,280 (-6%) | 4mo | $230,000 | $101 | 76 |
| 8 Avondale Ter | 0.54mi | 4/2.0 | 2,296 (-5%) | 2mo | $189,000 | $82 | 61 |
| 242 Elm St | 0.09mi | 3/2.5 (-1) | 2,112 (-13%) | 11mo | $304,000 | $144 | 58 |
| 26 Trinity Pl | 0.58mi | 5/2.0 (+1) | 2,508 (+4%) | 11mo | $230,000 | $92 | 48 |
| 211 Clinton Ave | 0.69mi | 5/3.0 (+1) | 2,640 (+9%) | 4mo | $250,000 | $95 | 44 |
| 270 Morton Ave | 0.46mi | 5/4.0 (+1) | 2,714 (+12%) | 9mo | $477,000 | $176 | 42 |
| 64 Clinton St | 0.75mi | 5/3.0 (+1) | 2,640 (+9%) | 6mo | $140,000 | $53 | 40 |
| 24 Delaware St | 0.71mi | 5/2.5 (+1) | 2,112 (-13%) | 2mo | $240,000 | $114 | 38 |
| 12 Grandview Ter | 0.74mi | 5/2.0 (+1) | 2,244 (-7%) | 10mo | $249,900 | $111 | 36 |
Match score weights: distance 35% · size 25% · config 20% · recency 20%. Top-matched comps best support the ARV.
Projected returns pro-forma
-3.0% appreciation · 6.86% rent growth · sell at horizon
- IRR
- 2.7%
- Equity multiple
- 1.11×
- Total profit
- $11,912
- Equity at exit
- $58,120
- IRR
- 15.9%
- Equity multiple
- 2.54×
- Total profit
- $168,304
- Equity at exit
- $33,703
Cash invested: $109,144 (down + closing). Projections, not guarantees.
Landlord ↔ Tenant lean methodology
- Overall (STATE)
- 15 Strongly Tenant-Friendly
- State New York
- 15 Strongly Tenant-Friendly · D+10
- County
- — inherits STATE
- City
- — inherits STATE
ZIP-level market 12210
- Home prices YoY
- -2.3%
- Rents YoY
- 6.9%
- Active inventory
- 70
- Price-to-rent
- 21.8×
Monthly cashflow live
- Estimated rent
- $4,769 high interval (Pro) →
- Mortgage (P&I)
- −$2,044
- Tax from tax record
- −$687 /mo · $8,248/yr
- Insurance
- −$162
- HOA
- −$0
- Vacancy / Maint / Mgmt
- −$1,001
- Net cashflow
- $874
Break-even live
3-unit breakdown (identical units grouped — click to expand)
| Units | Beds | Baths | Est. rent |
|---|---|---|---|
| 1× unit | 1 | 1 | $1,488 |
| 2× units | 2 | 1 | $3,282 |
| #2 | 2 | 1 | $1,641 |
| #3 | 2 | 1 | $1,641 |
| Total (3 units) | $4,769 | ||
UW: 25.0% down · 7.5% · 30yr · 1.5% tax · 5.0% vac · 8.0% maint · 8.0% mgmt
Financing live
Cash to close
- Down payment
- $97,450
- Closing costs
- $11,694
- Reserves months
- —
- Total cash needed
- —
Loan-product check · same deal, 3 products live
Conventional
25% down · 7.5% · 30yr
- Down + closing
- —
- Monthly P&I
- —
- Monthly cashflow
- —
- DSCR
- —
- Eligible?
- —
Personal DTI + credit; lowest rate.
DSCR
20% down · 8.5% · 30yr
- Down + closing
- —
- Monthly P&I
- —
- Monthly cashflow
- —
- DSCR
- —
- Eligible?
- —
No personal income docs; deal must DSCR.
Hard money
10% down · 12.0% · 12mo
- Down + closing
- —
- Monthly P&I
- —
- Monthly cashflow
- —
- DSCR
- —
- Eligible?
- —
Short-term bridge; refi at stabilization.
Rent comps 6 comps
| Address | Beds | Baths | Sqft | Rent | $/sqft | DOM | Units | Dist |
|---|---|---|---|---|---|---|---|---|
| 201 Park Ave Unit 10 Albany, NY | 3.0 | 2.0 | 1600 | $2,100 | $1.31 | 43d | 1 | 0.14mi |
| 119 Grand St Albany, NY | 3.0 | 1.0 | 1600 | $1,300 | $0.81 | 43d | 1 | 0.52mi |
| 32 1st St Albany, NY | 4.0 | 1.5 | 1773 | $1,850 | $1.04 | 43d | 1 | 0.78mi |
| 257 Quail St Albany, NY | 4.0 | 2.5 | 2208 | $2,800 | $1.27 | 43d | 1 | 1.01mi |
| 15 Stanwix St Albany, NY | 4.0 | 1.5 | 1660 | $2,500 | $1.51 | 14d | 1 | 1.08mi |
| 154 Spring St Albany, NY | 3.0 | 1.0 | 2500 | $1,695 | $0.68 | 43d | 1 | 1.12mi |
Listing history 2 events
-
2026-05-05status Pending 1658-char remark
-
2026-04-23$389,800 Active 1658-char remark
ⓘ Source: listings_history table (triggers on properties + properties_extension) + one-shot
backfill from property_details.listing_events for pre-trigger history.
Tax reassessment forecast NY · Partial reset (capped growth)
- Current annual tax
- $8,248 · $687/mo
- Projected year-2 tax
- $8,248 · $687/mo
- Expected delta
- $0/yr ($0/mo · 0.0%)
ⓘ Screening estimate from a state-policy table — verify with the county assessor before closing.
Climate risk First Street
- Flood 1/10 Low FEMA zone X (unshaded) · 0% chance over 30 yrs
- Wildfire 1/10 Low
- Heat 4/10 Moderate 7 d/yr ≥97°F today · 16 d/yr by 30 yrs out
- Wind 3/10 Moderate 6% chance of damaging wind over 30 yrs
- Air quality 1/10 Low 0 unhealthy d/yr today · 0 by 30 yrs out
Nearby sold comps map
Loading sold comps map…
Walkable amenities ~0.75 mi
Loading nearby amenities…
Taxation est. · year 1
- Rental income
- $57,228
- − Mortgage interest
- −$21,835
- − Property taxes
- −$8,248
- − Insurance
- −$1,949
- − Repairs & maintenance
- −$4,578
- − Management
- −$4,578
- − Depreciation
- −$11,340
- Taxable income
- $4,700
- Est. tax owed @ 24.0%
- −$1,128
- After-tax cash flow
- $9,356/yr
For passive investors: Depreciation is non-cash, so a rental often shows a tax loss while cash-flowing — sheltering income. Rental losses are passive: they offset passive income freely, and up to $25,000/yr can offset ordinary (W-2) income if you actively participate and your MAGI is under $100k (phasing out to $0 by $150k); unused losses carry forward. On sale, claimed depreciation is recaptured at up to 25%, and gains may owe capital-gains tax (a 1031 exchange can defer both). Figures are a year-1 estimate at your 24.0% rate — not tax advice; consult a CPA.
Schools (NCES district)
- District
- Albany City School District
- NCES district ID
- 3602460
- Math proficiency
- 37% ▲ 6.00%
- Reading proficiency
- 40% ▲ 7.00%
- Median HH income
- $40,568
- Composite
- 32.34/100
- National rank
- #5744
- State rank
- #543 of 590 in NY
Livability — Albany
- Score
- 79/100
- State rank
- #129
- US rank
- #2083
Category grades
Schools grade is shown separately in the Schools card above.
Census & demographics
- Census place
- Albany, NY
- County
- Albany County · 196,626 people
- City population
- 116,921
- Metro
- Albany-Schenectady-Troy, NY
- Population (ZIP)
- 10,297
- Household income
- $55,843
- Rent vs Own
- Severe rent burden
- 1211.0
Population outlook (Albany County) Hauer SSP2
- Today (2025)
- 320,794 people
- By 2030
- 327,401 · +2.1%
- By 2040
- 338,218 · +5.4%
- By 2050
- 348,467 · +8.6%
- By 2075
- 381,693 · +19.0%
- By 2100
- 393,809 · +22.8%
Race, ethnicity, and origin ACS 2023
- Neighborhood character
- Diverse neighborhood (Simpson 0.63)
- Race & ethnicity
- White 44% Black 41% Two or more races 7% Hispanic / Latino 7% Asian 3%
- Hispanic origin (detail)
- Puerto Rican 3% Dominican 2%
- Common ancestry
- Romanian 4% Lithuanian 2% Serbian 2%
- Foreign-born
- 8% · Canada, China, Vietnam
- Languages at home
- 89% English-only · Spanish 3% French/Haitian/Cajun 2% Other Indo-European 2%
Political lean MEDSL · Albany
- 2024 margin
- Strong D (+25.8) · D 62.9% · R 37.1%
- 2008→2024 swing
- -3.6pp toward R · 2008: 29.4pp · 2024: 25.8pp
- All cycles
- 2024: D+25.8 2020: D+31.4 2016: D+24.3 2012: D+31.0 2008: D+29.4
Not yet ingested
- Civics
- —
Market trends
- HPI YoY
- ▼ -5.92%
- Current HPI
- 252.3084
- Rent YoY
- ▲ 6.86%
- Metro
- Albany-Schenectady-Troy, NY
- State GDP YoY
- ▲ 2.60%
- F500 in state
- 92
Industry mix (Fortune 500 HQ in NY)
| Industry | F500 HQs | Revenue |
|---|---|---|
| Financial Services | 10 | $950B |
|
||
| Consumer Goods | 9 | $162B |
|
||
| Insurance | 4 | $225B |
|
||
| Telecommunications | 2 | $144B |
|
||
| Pharmaceuticals | 2 | $112B |
|
||
| Media / Entertainment | 2 | $69B |
|
||
Price history
2 events — show timeline
- 2026-05-05 Pending — Global MLS
- 2026-04-23 Listed $389,800 Global MLS
Property tax history
+5.4%/yrLatest (2025): $8,248 · +3.4% YoY. Source: county tax records.
Cash-flow waterfall
monthlySold comps — $/sqft
last 12 mo · ≤1 miLoading sold comps…