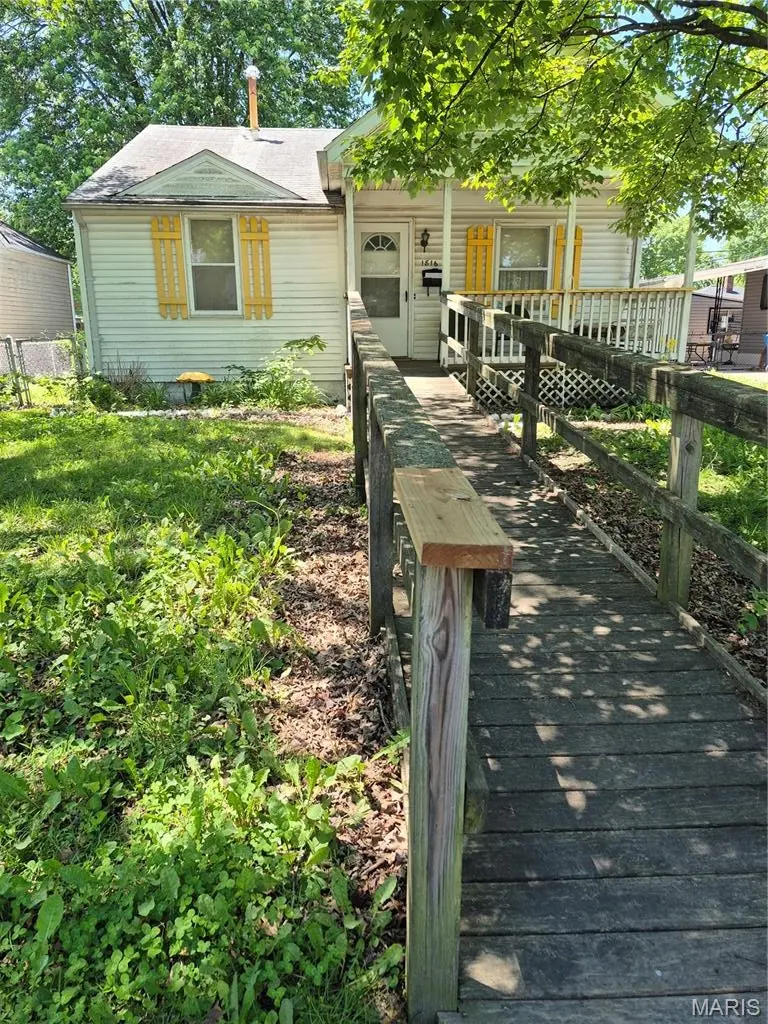
1816 Ferguson Ave · Granite City, IL
Flood risk 1/10 · Minimal
- FEMA flood zone
- X
- Chance of flooding over 30 yrs
- 0.0%
- Est. flood insurance / yr
- $473 – $860
Fire risk 1/10 · Minimal
- Est. fire insurance / yr
- $804 – $1,492
Heat risk 6/10 · Moderate
- Hot days now (above 107°F)
- 7 days/yr
- Hot days in 30 yrs
- 21 days/yr
Wind risk 2/10 · Minimal
- Chance of severe wind over 30 yrs
- 1.0%
Air-quality risk 4/10 · Minor
- Unhealthy air days now
- 4 days/yr
- Unhealthy air days in 30 yrs
- 5 days/yr
Risk factors via First Street. Map © Google.
Why this score? — see what drove the B- grade
The composite is a weighted blend of 9 inputs, each scored 0–100. Each bar is that input's sub-score; the figure is the points it added to the 100-point composite (weight × sub-score).
- Cash flow +30.0/30.0
- 1% rule +10.0/10.0
- DSCR +10.0/10.0
- ARV discount +7.5/15.0
- Livability +3.2/5.0
- Rent growth +2.9/5.0
- Condition / age +2.5/5.0
- Schools +0.9/10.0
- Appreciation +0.0/10.0
$50,000
🖨 Deal sheet (PDF) 📄 Offer letter ✓ Due diligence
Listing remarks
THREE BEDROOM ONE BATH IN CONVENIENT LOCATION. NEEDS TLC. SELLING AS-IS. SUBJECT TO OWNER MOVING TO ASSISTED LIVING FACILITY. SELLER TAKING SOME PERSONAL ITEMS AND SOME FURNITURE. BUYER RESPONSIBLE FOR CLEAN OUT. ALL APPLIANCES WILL STAY. LARGE PANTRY. FRIDGE ABOUT 2 YRS OLD. FREEZER 10-11 YRS OLD. FURNACE & HWH ABOUT 7 YRS OLD. A/C UNIT 2-3 YRS OLD. PARTIAL BASEMENT HAS W/ D HOOKUP. LARGE ROOM OFF THE KITCHEN HAS WASHER/DRYER AND FREEZER THAT STAYS. FUSES IN ELECTRIC PANEL. ENCLOSED SUN ROOM ADDS TO SQ FOOTAGE OF THE HOME. ONE CAR DETACHED GARAGE. WHEELCHAIR RAMP. SELLER WILL MAKE NO REPAIRS AND WILL NOT PASS CITY FOR OCCUPANCY
Key facts
- 5,998 sq ft lot
- Garage
- Built 1948
Property features AI
Finance
- Other: Living area reported as 1,270 (owner source); Lot dimensions approximately 50 x 120
Exterior
- Parking: Detached garage (1 car); Driveway; Alley access; Gravel parking areas; Off-street and on-street parking available
- Utilities: Public water; Public sewer; Electricity available and connected; Natural gas available and connected; Electric service type listed as Other
- Home design: Single-family residential house; One story; Private ownership; Fixer condition
- Construction: Vinyl siding; Composition/shingle roof; Block foundation; Basement: partial, block
- Exterior features: Back and front yard; Level lot; Chain link fencing in back yard; Concrete road access
Interior
- Kitchen: Eat-in kitchen; Gas cooktop; Built-in gas oven; Freezer; Refrigerator
- Bedrooms: Three bedrooms, all on the main level
- Flooring: Carpet
- Bathrooms: One full bathroom on the main level
- Heating & cooling: Forced air heating (natural gas); Central air conditioning; Ceiling fan(s); Gas-powered cooling component listed
- Interior features: Pantry; Wood window frames; Knotty pine wall accents; Enclosed sunroom included in living area
- Laundry & utility: Main-level laundry; Washer and dryer included; Gas water heater
Neighborhood map
What this means for you Summary
Snapshot
- This is a 2-bed/1.0-bath single-family listed at $50k.
Deal economics
- At list price, monthly cash flow is $452 ($5k/yr) — positive.
- The deal already cash-flows at list — no discount required.
- Meets the 1% rule at list price ($1k rent vs $50k).
- Recommended offer: $48k (3.0% below list) — sets the bar for market timing.
- Cap rate 17.1% vs local median 7.0% in Granite City — top-decile yield for the area; either an underpriced asset or a hidden risk that comps aren't pricing in. Stress-test before assuming the spread holds.
Location & tenants
- Location reads 65/100 on livability (#623 in IL) — a middle-class / working-renter tenant base. Strengths: cost of living A+, housing A+; Watch: crime F, amenities F, commute F.
- Granite City CUSD 9 (suburban): math 9% / reading 11% proficiency, ranked #570 of 620 in IL (top 92%) — low school quality limits family demand, transient renter base, plan for 1-2y turnover.
- Zoned schools: Granite City High School (math 10% / reading 12%, grade F, #522 of 693 statewide, top 76%, 1,805 students, 0% FRL) — zoned schools average 0% FRL vs 59% district-wide (59 pts lower); this property's tenant base skews higher-income than the district average.
- Market conditions: Rents rising (+1.7%/yr); 194 active listings in the ZIP; 2 comparable units currently listed for rent nearby; 336 units permitted in Madison County in 2024 (0 in 5+ unit buildings).
Forward outlook
- Local home prices are declining (-3.0%/yr); year-one equity from $346 of loan paydown is wiped out by about $2k of value loss. Plan a longer hold.
- Madison County population projected at -18% by 2050 — secular population decline; favor cash flow + early exit over multi-decade hold.
- At projected returns (-3.0% appreciation + 1.7% rent growth), your $14k cash investment doubles in ~4 years — after that, you're playing with house money.
Negotiation context
- It's been on market 32 days — a 3% lower offer ($48k) is reasonable based on typical stale-listing flexibility.
Risks & watch-outs
- Watch-outs: property tax is 2.6% of price; built in 1948 — expect roof / HVAC / electrical / plumbing capex.
- Climate carrying-cost: extreme-heat days projected 7→21/yr by 2055 (HVAC capex compounding) — expect insurance premiums to compound above CPI over the hold.
Questions for the listing agent
- It's been on market 32 days. Have you received any prior offers? Is the seller open to a 3% concession, seller financing, or rate buy-down credit?
- Built in 1948 — when were the roof, HVAC, electrical panel, plumbing, and water heater last replaced?
- Property tax is high relative to price — has the assessment been appealed recently, and will the sale trigger a re-assessment?
- Is there a deadline driving the sale (1031 exchange, divorce, estate, relocation)? That informs how much negotiation room exists.
- Schools are F-rated, which usually means shorter tenancies and higher turnover. Who's the typical renter profile here, and what's been the actual vacancy rate?
- Crime grade is F in this area — have there been break-ins, vandalism, or insurance claims at this property in the last 3 years? What carrier currently insures it and at what premium?
- What's the average days-on-market for RENTAL listings here right now (not sales)? A rising rental-DOM trend means longer vacancies and softer asking-rent achievability than the comps imply.
- What's the recent tenant-quality profile in this submarket — average credit score on applications, eviction rate, late-payment / NSF rate, and stable-employment percentage? A property-management company in the area should have these aggregated.
- How much new for-sale + rental construction is in the pipeline within 1–3 miles? Heavy new supply typically softens prices + rents 12–24 months out; constrained supply supports both.
Investment metrics
- 1% rule
- 2.13% ✓
- Cap rate
- 17.13%
- Cash-on-cash
- 38.71%
- DSCR
- 2.72
- GRM
- 3.9
CMA / ARV
- ARV (median comp)
- $138,057
- List price
- $50,000
- Delta
- -63.78%
- Verdict
- UNDERPRICED
- Comps
- 20 within 1.0 mi
Show comp detail 12 sales within ~0.75 mi
| Address | Dist | Beds/Ba | Sqft | Sold | Price | $/sf | Match |
|---|---|---|---|---|---|---|---|
| 1724 Sycamore St | 0.15mi | 2/2.0 | 1,080 (-6%) | 5mo | $30,000 | $28 | 75 |
| 1745 Venice Ave | 0.21mi | 2/1.0 | 1,044 (-9%) | 4mo | $106,500 | $102 | 72 |
| 2125 Lynch Ave | 0.13mi | 2/1.0 | 1,264 (+10%) | 6mo | $150,000 | $119 | 71 |
| 1612 Mitchell Ave | 0.40mi | 3/1.5 (+1) | 1,132 (-1%) | 6mo | $144,900 | $128 | 68 |
| 2030 Pontoon Rd | 0.21mi | 3/1.0 (+1) | 1,040 (-9%) | 4mo | $164,900 | $159 | 67 |
| 1737 Moro Ave | 0.27mi | 2/1.0 | 1,016 (-11%) | 4mo | $125,000 | $123 | 66 |
| 1420 Norwood Dr | 0.62mi | 3/1.0 (+1) | 1,128 (-1%) | 1mo | $109,900 | $97 | 62 |
| 2132 Orville Ave | 0.16mi | 3/1.0 (+1) | 980 (-14%) | 6mo | $125,000 | $128 | 59 |
| 1517 Garfield Ave | 0.64mi | 2/1.0 | 1,084 (-5%) | 3mo | $129,900 | $120 | 59 |
| 13 Miami Ct | 0.60mi | 3/2.0 (+1) | 1,200 (+5%) | 3mo | $209,000 | $174 | 53 |
| 2345 Paul Ave | 0.51mi | 3/1.0 (+1) | 1,008 (-12%) | 5mo | $93,000 | $92 | 48 |
| 1511 Cottage Ave | 0.68mi | 2/1.0 | 1,019 (-11%) | 4mo | $130,000 | $128 | 46 |
Match score weights: distance 35% · size 25% · config 20% · recency 20%. Top-matched comps best support the ARV.
Projected returns pro-forma
-3.0% appreciation · 1.67% rent growth · sell at horizon
- IRR
- 33.3%
- Equity multiple
- 2.38×
- Total profit
- $19,293
- Equity at exit
- $7,455
- IRR
- 39.5%
- Equity multiple
- 4.46×
- Total profit
- $48,384
- Equity at exit
- $4,323
Cash invested: $14,000 (down + closing). Projections, not guarantees.
Landlord ↔ Tenant lean methodology
- Overall (STATE)
- 43 Moderately Tenant-Leaning
- State Illinois
- 43 Moderately Tenant-Leaning · D+7
- County
- — inherits STATE
- City
- — inherits STATE
ZIP-level market 62040
- Home prices YoY
- -21.8%
- Rents YoY
- 1.7%
- Active inventory
- 194
- Price-to-rent
- 3.9×
Monthly cashflow live
- Estimated rent
- $1,067 medium interval (Pro) →
- Mortgage (P&I)
- −$262
- Tax from tax record
- −$108 /mo · $1,297/yr
- Insurance
- −$21
- HOA
- −$0
- Vacancy / Maint / Mgmt
- −$224
- Net cashflow
- $452
Break-even live
Sensitivity live
| Price | -10% $480 | -5% $466 | +0% $452 | +5% $437 | +10% $423 |
|---|---|---|---|---|---|
| Rent | -10% $367 | -5% $409 | +0% $452 | +5% $494 | +10% $536 |
| Rate | -1.0pp $477 | -0.5pp $464 | base $452 | +0.5pp $439 | +1.0pp $425 |
UW: 25.0% down · 7.5% · 30yr · 1.5% tax · 5.0% vac · 8.0% maint · 8.0% mgmt
Financing live
Cash to close
- Down payment
- $12,500
- Closing costs
- $1,500
- Reserves months
- —
- Total cash needed
- —
Loan-product check · same deal, 3 products live
Conventional
25% down · 7.5% · 30yr
- Down + closing
- —
- Monthly P&I
- —
- Monthly cashflow
- —
- DSCR
- —
- Eligible?
- —
Personal DTI + credit; lowest rate.
DSCR
20% down · 8.5% · 30yr
- Down + closing
- —
- Monthly P&I
- —
- Monthly cashflow
- —
- DSCR
- —
- Eligible?
- —
No personal income docs; deal must DSCR.
Hard money
10% down · 12.0% · 12mo
- Down + closing
- —
- Monthly P&I
- —
- Monthly cashflow
- —
- DSCR
- —
- Eligible?
- —
Short-term bridge; refi at stabilization.
Rent comps 2 comps
| Address | Beds | Baths | Sqft | Rent | $/sqft | DOM | Units | Dist |
|---|---|---|---|---|---|---|---|---|
| 4404 Wabash Ave Granite City, IL | 2.0 | 1.0 | 864 | $1,025 | $1.19 | 3d | 1 | 0.13mi |
| 303 Wilson Park Ln Granite City, IL | 3.0 | 1.0 | 900 | $1,200 | $1.33 | 8d | 1 | 1.25mi |
Listing history 16 events
-
2026-06-18days on market $50,000 Active 32 DOM
-
2026-06-17days on market $50,000 Active 31 DOM
-
2026-06-16days on market $50,000 Active 30 DOM
-
2026-06-15days on market $50,000 Active 29 DOM
-
2026-06-13days on market $50,000 Active 27 DOM
-
2026-06-13days on market $50,000 Active 26 DOM
-
2026-06-09days on market $50,000 Active 23 DOM
-
2026-06-08days on market $50,000 Active 22 DOM
-
2026-06-07days on market $50,000 Active 21 DOM
-
2026-06-05days on market $50,000 Active 18 DOM
-
2026-06-03days on market $50,000 Active 17 DOM
-
2026-06-02days on market $50,000 Active 16 DOM
-
2026-06-01days on market $50,000 Active 15 DOM
-
2026-05-31days on market $50,000 Active 14 DOM
-
2026-05-17$50,000 Active 640-char remark
-
2026-05-14historical $50,000 640-char remark
ⓘ Source: listings_history table (triggers on properties + properties_extension) + one-shot
backfill from property_details.listing_events for pre-trigger history.
Tax reassessment forecast IL · Partial reset (capped growth)
- Current annual tax
- $1,297 · $108/mo
- Projected year-2 tax
- $1,297 · $108/mo
- Expected delta
- $0/yr ($0/mo · 0.0%)
ⓘ Screening estimate from a state-policy table — verify with the county assessor before closing.
Climate risk First Street
- Flood 1/10 Low FEMA zone X · 0% chance over 30 yrs
- Wildfire 1/10 Low
- Heat 6/10 Major 7 d/yr ≥107°F today · 21 d/yr by 30 yrs out
- Wind 2/10 Low 100% chance of damaging wind over 30 yrs
- Air quality 4/10 Moderate 4 unhealthy d/yr today · 5 by 30 yrs out
Nearby sold comps map
Loading sold comps map…
Walkable amenities ~0.75 mi
Loading nearby amenities…
Taxation est. · year 1
- Rental income
- $12,800
- − Mortgage interest
- −$2,801
- − Property taxes
- −$1,297
- − Insurance
- −$250
- − Repairs & maintenance
- −$1,024
- − Management
- −$1,024
- − Depreciation
- −$1,455
- Taxable income
- $4,950
- Est. tax owed @ 24.0%
- −$1,188
- After-tax cash flow
- $4,231/yr
For passive investors: Depreciation is non-cash, so a rental often shows a tax loss while cash-flowing — sheltering income. Rental losses are passive: they offset passive income freely, and up to $25,000/yr can offset ordinary (W-2) income if you actively participate and your MAGI is under $100k (phasing out to $0 by $150k); unused losses carry forward. On sale, claimed depreciation is recaptured at up to 25%, and gains may owe capital-gains tax (a 1031 exchange can defer both). Figures are a year-1 estimate at your 24.0% rate — not tax advice; consult a CPA.
Schools (NCES district)
- District
- Granite City CUSD 9
- NCES district ID
- 1717280
- Math proficiency
- 9% ▼ -4.00%
- Reading proficiency
- 11% ▼ -7.00%
- Median HH income
- $45,082
- Composite
- 9.15/100
- National rank
- #9864
- State rank
- #570 of 620 in IL
Livability — Granite City
- Score
- 65/100
- State rank
- #623
- US rank
- #12751
Category grades
Schools grade is shown separately in the Schools card above.
Census & demographics
- Census place
- Granite City, IL
- County
- Madison County · 189,064 people
- City population
- 40,404
- Metro
- St. Louis, MO-IL
- Population (ZIP)
- 40,404
- Household income
- $60,031
- Rent vs Own
- Severe rent burden
- 923.0
Population outlook (Madison County) Hauer SSP2
- Today (2025)
- 258,371 people
- By 2030
- 251,523 · -2.7%
- By 2040
- 233,640 · -9.6%
- By 2050
- 213,042 · -17.5%
- By 2075
- 165,255 · -36.0%
- By 2100
- 123,953 · -52.0%
Race, ethnicity, and origin ACS 2023
- Neighborhood character
- Predominantly White (76%)
- Race & ethnicity
- White 76% Hispanic / Latino 9% Black 9% Two or more races 7% Asian 1%
- Hispanic origin (detail)
- Mexican 7%
- Common ancestry
- Romanian 2% Lithuanian 2% Serbian 2%
- Foreign-born
- 3% · Canada, Vietnam
- Languages at home
- 93% English-only · Spanish 5%
Political lean MEDSL · Madison
- 2024 margin
- R (+13.3) · D 42.5% · R 55.8% · Other 1.8%
- 2008→2024 swing
- -22.5pp toward R · 2008: 9.2pp · 2024: -13.3pp
- All cycles
- 2024: R+13.3 2020: R+13.2 2016: R+15.6 2012: R+1.4 2008: D+9.2
Not yet ingested
- Civics
- —
Market trends
- HPI YoY
- ▼ -56.88%
- Current HPI
- 204.4612
- Rent YoY
- ▲ 1.67%
- Metro
- St. Louis, MO-IL
- State GDP YoY
- ▲ 1.59%
- F500 in state
- 60
Industry mix (Fortune 500 HQ in IL)
| Industry | F500 HQs | Revenue |
|---|---|---|
| Insurance | 4 | $201B |
|
||
| Consumer Goods | 4 | $87B |
|
||
| Industrial Machinery | 3 | $64B |
|
||
| Healthcare | 2 | $55B |
|
||
| Retail / Pharmacy | 1 | $148B |
|
||
| Agriculture / Food | 1 | $86B |
|
||
Price history
+0.0% since first listed2 events — show timeline
- 2026-05-17 Listed $50,000 MARIS as Distributed by MLS Grid
- 2026-05-14 Coming Soon $50,000 MARIS as Distributed by MLS Grid
Property tax history
+12.8%/yrLatest (2024): $1,297 · -8.5% YoY. Source: county tax records.
Cash-flow waterfall
monthlySold comps — $/sqft
last 12 mo · ≤1 miLoading sold comps…