 🏷️ Likely Rental
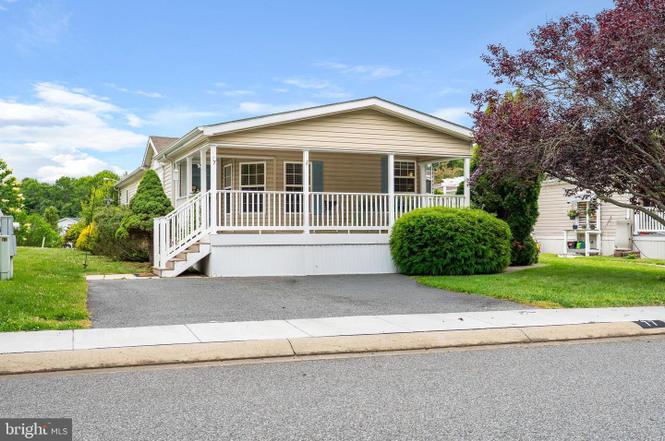
77 Woods Way · North East, MD
Flood risk No data
- FEMA flood zone
- —
- Chance of flooding over 30 yrs
- —
- Est. flood insurance / yr
- —
Fire risk No data
- Est. fire insurance / yr
- —
Heat risk No data
- Hot days now (above threshold)
- —
- Hot days in 30 yrs
- —
Wind risk No data
- Chance of severe wind over 30 yrs
- —
Air-quality risk No data
- Unhealthy air days now
- —
- Unhealthy air days in 30 yrs
- —
Risk factors via First Street. Map © Google.
Why this score? — see what drove the B+ grade
The composite is a weighted blend of 9 inputs, each scored 0–100. Each bar is that input's sub-score; the figure is the points it added to the 100-point composite (weight × sub-score).
- Cash flow +30.0/30.0
- ARV discount +15.0/15.0
- DSCR +10.0/10.0
- 1% rule +8.5/10.0
- Condition / age +3.8/5.0
- Livability +3.5/5.0
- Rent growth +3.1/5.0
- Schools +2.2/10.0
- Appreciation +0.0/10.0
$140,000
🖨 Deal sheet (PDF) 📄 Offer letter ✓ Due diligence
Listing remarks
Move-in ready manufactured rancher located in the highly sought-after 55+ community of Cecil Woods. As you enter the front door, you are greeted with a bright living room with laminate plank flooring, which flows seamlessly into the dining room. The kitchen offers ample cabinet space and a breakfast nook. Down the hall is a utility/laundry room with exterior access, two spacious bedrooms, and two full bathrooms. The primary bedroom offers a walk-in closet and expansive ensuite bathroom with double sink. Exterior features include a charming front porch and storage shed. HVAC new within the last year! NO PROPERTY TAXES! Current ground rent is $665/month. Monthly ground rent includes community
Key facts
- Breakfast nook
- Utility laundry room
- Bright living room
Tags
Property features AI
Finance
- Other: Property manager present; Ground rent listed as an annual/recurring expense
- Financial info: Ground rent exists and is paid monthly
- HOA & community: Association amenities include clubhouse, community center, exercise room, game room, library, meeting/party rooms, billiard room, common grounds, jog/walk path; retirement community services; HOA covers common area maintenance, water, sewer, trash, and snow removal
Exterior
- Parking: Paved driveway; Two driveway parking spaces (total 2 parking spaces)
- Utilities: Public water; Public sewer; Electric hot water; Electric cooling; Propane heating
- Home design: Manufactured double-wide home; Estimated year built; Level entry with accessibility improvements; Senior community (55+)
- Construction: Vinyl siding; Shingle roof; Slab and crawl space foundation; Double-wide (27 ft by 56 ft)
- Exterior features: Porch; Sidewalks; Shed; Above-grade outdoor structures
Interior
- Kitchen: Dishwasher; Gas range/oven; Microwave; Range hood; Refrigerator; Stainless steel appliances
- Bedrooms: Two main-level bedrooms; Entry-level bedroom
- Flooring: Laminate plank; Carpet
- Bathrooms: Two full bathrooms (both on main level)
- Heating & cooling: Forced air heating; Central heating; Propane (metered) fuel for heat; Central electric air conditioning
- Interior features: Open floor plan; Combination dining/living area; Dining area; Breakfast area; Kitchen with table space; Ceiling fans; Stall shower; Tub/shower combination; Storm door(s)
- Laundry & utility: Washer and dryer included; Electric hot water
Neighborhood map
What this means for you Summary
Snapshot
- This is a 2-bed/2.0-bath single-family listed at $140k. Condition is rated good.
Deal economics
- At list price, monthly cash flow is $530 ($6k/yr) — positive.
- The deal already cash-flows at list — no discount required.
- Meets the 1% rule at list price ($2k rent vs $140k).
- Cap rate 10.8% vs local median 3.2% in North East — top-decile yield for the area; either an underpriced asset or a hidden risk that comps aren't pricing in. Stress-test before assuming the spread holds.
Location & tenants
- Location reads 70/100 on livability (#164 in MD) — a middle-class / working-renter tenant base. Strengths: cost of living A+, health & safety A+, housing A; Watch: amenities D+, crime D-, commute F.
- Cecil County Public Schools (rural): math 15% / reading 30% proficiency, ranked #15 of 24 in MD (top 62%) — low school quality limits family demand, transient renter base, plan for 1-2y turnover.
- Zoned schools: Leeds Elementary (math 8% / reading 12%, grade F, #614 of 860 statewide, top 75%, 334 students, 56% FRL); North East Middle (math 8% / reading 29%, grade F, #159 of 225 statewide, top 73%, 791 students, 54% FRL); North East High (math 32% / reading 78%, grade C, #88 of 222 statewide, top 40%, 1,069 students, 49% FRL) — zoned schools average 53% FRL vs 37% district-wide (16 pts higher); higher-poverty schools than district average — tighter screening recommended.
- Market conditions: Rents rising (+2.3%/yr); 206 active listings in the ZIP; 2 comparable units currently listed for rent nearby; solid renter incomes; 563 units permitted in Cecil County in 2024 (330 in 5+ unit buildings).
Forward outlook
- Local home prices are declining (-3.0%/yr); year-one equity from $968 of loan paydown is wiped out by about $4k of value loss. Plan a longer hold.
- At projected returns (-3.0% appreciation + 2.3% rent growth), your $39k cash investment doubles in ~8 years — after that, you're playing with house money.
Negotiation context
- Only 11 days on market — expect competitive offers; lowballing is unlikely to land.
Questions for the listing agent
- Is there a deadline driving the sale (1031 exchange, divorce, estate, relocation)? That informs how much negotiation room exists.
- Schools are D-rated, which usually means shorter tenancies and higher turnover. Who's the typical renter profile here, and what's been the actual vacancy rate?
- Crime grade is D in this area — have there been break-ins, vandalism, or insurance claims at this property in the last 3 years? What carrier currently insures it and at what premium?
- What's the average days-on-market for RENTAL listings here right now (not sales)? A rising rental-DOM trend means longer vacancies and softer asking-rent achievability than the comps imply.
- What's the recent tenant-quality profile in this submarket — average credit score on applications, eviction rate, late-payment / NSF rate, and stable-employment percentage? A property-management company in the area should have these aggregated.
- How much new for-sale + rental construction is in the pipeline within 1–3 miles? Heavy new supply typically softens prices + rents 12–24 months out; constrained supply supports both.
Investment metrics
- 1% rule
- 1.35% ✓
- Cap rate
- 10.84%
- Cash-on-cash
- 16.23%
- DSCR
- 1.72
- GRM
- 6.2
CMA / ARV
- ARV (on-the-fly)
- $223,776
- Comps found
- 12
Show comp detail 12 sales within ~0.75 mi
| Address | Dist | Beds/Ba | Sqft | Sold | Price | $/sf | Match |
|---|---|---|---|---|---|---|---|
| 123 Woods Way | 0.05mi | 2/2.0 | 1,384 (-8%) | 0mo | $185,000 | $134 | 83 |
| 57 Admirals Way | 0.23mi | 2/2.0 | 1,588 (+5%) | 3mo | $248,000 | $156 | 79 |
| 12 Tern Ct | 0.06mi | 2/2.0 | 1,384 (-8%) | 7mo | $130,000 | $94 | 77 |
| 22 Farragut Ct | 0.24mi | 2/2.0 | 1,620 (+7%) | 4mo | $240,000 | $148 | 73 |
| 20 Nimitz Ct | 0.16mi | 2/2.0 | 1,588 (+5%) | 13mo | $240,000 | $151 | 73 |
| 167 Woods Way | 0.10mi | 3/2.0 (+1) | 1,344 (-11%) | 1mo | $145,000 | $108 | 71 |
| 6 Raven Ct | 0.10mi | 3/2.0 (+1) | 1,336 (-12%) | 1mo | $120,000 | $90 | 70 |
| 10 Woods Way | 0.12mi | 2/2.0 | 1,344 (-11%) | 10mo | $127,000 | $94 | 68 |
| 16 Farragut Ct | 0.23mi | 2/2.0 | 1,620 (+7%) | 14mo | $243,000 | $150 | 66 |
| 213 Woods Way | 0.18mi | 2/2.0 | 1,736 (+15%) | 6mo | $140,000 | $81 | 62 |
| 653 Mechanics Valley Rd | 0.57mi | 3/2.0 (+1) | 1,556 (+3%) | 7mo | $345,000 | $222 | 58 |
| 57 Falls Rd | 0.61mi | 3/1.0 (+1) | 1,635 (+8%) | 5mo | $330,000 | $202 | 45 |
Match score weights: distance 35% · size 25% · config 20% · recency 20%. Top-matched comps best support the ARV.
Projected returns pro-forma
-3.0% appreciation · 2.32% rent growth · sell at horizon
- IRR
- 6.5%
- Equity multiple
- 1.25×
- Total profit
- $9,832
- Equity at exit
- $20,874
- IRR
- 15.2%
- Equity multiple
- 2.20×
- Total profit
- $46,956
- Equity at exit
- $12,105
Cash invested: $39,200 (down + closing). Projections, not guarantees.
Landlord ↔ Tenant lean methodology
- Overall (STATE)
- 27 Tenant-Leaning
- State Maryland
- 27 Tenant-Leaning · D+14
- County
- — inherits STATE
- City
- — inherits STATE
ZIP-level market 21921
- Rents YoY
- 2.3%
- Active inventory
- 206
- Price-to-rent
- 6.2×
Monthly cashflow live
- Estimated rent
- $1,896 medium interval (Pro) →
- Mortgage (P&I)
- −$734
- Tax est. 1.5%
- −$175 /mo · $2,100/yr
- Insurance
- −$58
- HOA
- −$0
- Vacancy / Maint / Mgmt
- −$398
- Net cashflow
- $530
Break-even live
Sensitivity live
| Price | -10% $627 | -5% $579 | +0% $530 | +5% $482 | +10% $434 |
|---|---|---|---|---|---|
| Rent | -10% $381 | -5% $455 | +0% $530 | +5% $605 | +10% $680 |
| Rate | -1.0pp $601 | -0.5pp $566 | base $530 | +0.5pp $494 | +1.0pp $457 |
UW: 25.0% down · 7.5% · 30yr · 1.5% tax · 5.0% vac · 8.0% maint · 8.0% mgmt
Financing live
Cash to close
- Down payment
- $35,000
- Closing costs
- $4,200
- Reserves months
- —
- Total cash needed
- —
Loan-product check · same deal, 3 products live
Conventional
25% down · 7.5% · 30yr
- Down + closing
- —
- Monthly P&I
- —
- Monthly cashflow
- —
- DSCR
- —
- Eligible?
- —
Personal DTI + credit; lowest rate.
DSCR
20% down · 8.5% · 30yr
- Down + closing
- —
- Monthly P&I
- —
- Monthly cashflow
- —
- DSCR
- —
- Eligible?
- —
No personal income docs; deal must DSCR.
Hard money
10% down · 12.0% · 12mo
- Down + closing
- —
- Monthly P&I
- —
- Monthly cashflow
- —
- DSCR
- —
- Eligible?
- —
Short-term bridge; refi at stabilization.
Rent comps 2 comps
| Address | Beds | Baths | Sqft | Rent | $/sqft | DOM | Units | Dist |
|---|---|---|---|---|---|---|---|---|
| 100 Cypress Dr North East, MD | 3.0 | 1.5 | 1540 | $2,000 | $1.30 | 3d | 1 | 1.31mi |
| 30 Sycamore Dr North East, MD | 2.0 | 1.5 | 1188 | $1,750 | $1.47 | 18d | 1 | 1.37mi |
Listing history 7 events
-
2026-06-21days on market $140,000 Active 11 DOM
-
2026-06-18days on market $140,000 Active 8 DOM
-
2026-06-17days on market $140,000 Active 7 DOM
-
2026-06-16days on market $140,000 Active 6 DOM
-
2026-06-15days on market $140,000 Active 5 DOM
-
2026-06-13remarks 699-char remark
-
2026-06-13$140,000 Active 3 DOM
ⓘ Source: listings_history table (triggers on properties + properties_extension) + one-shot
backfill from property_details.listing_events for pre-trigger history.
Nearby sold comps map
Loading sold comps map…
Walkable amenities ~0.75 mi
Loading nearby amenities…
Taxation est. · year 1
- Rental income
- $22,752
- − Mortgage interest
- −$7,842
- − Property taxes
- −$2,100
- − Insurance
- −$700
- − Repairs & maintenance
- −$1,820
- − Management
- −$1,820
- − Depreciation
- −$4,073
- Taxable income
- $4,397
- Est. tax owed @ 24.0%
- −$1,055
- After-tax cash flow
- $5,309/yr
For passive investors: Depreciation is non-cash, so a rental often shows a tax loss while cash-flowing — sheltering income. Rental losses are passive: they offset passive income freely, and up to $25,000/yr can offset ordinary (W-2) income if you actively participate and your MAGI is under $100k (phasing out to $0 by $150k); unused losses carry forward. On sale, claimed depreciation is recaptured at up to 25%, and gains may owe capital-gains tax (a 1031 exchange can defer both). Figures are a year-1 estimate at your 24.0% rate — not tax advice; consult a CPA.
Condition & rehab AI · 13 photos
This move-in ready manufactured rancher is in good condition with minimal repairs needed. It offers a bright and spacious interior with good curb appeal.
Value-add opportunities
- Resale Paint exterior trim — Fresh paint enhances curb appeal and property value
- Rental Clean gutters — Clean gutters improve drainage and reduce maintenance costs
Renovation cost estimate screening
Value-add ROI direction
- Resale Paint exterior trim — Fresh paint enhances curb appeal and property value ↑
- Rental Clean gutters — Clean gutters improve drainage and reduce maintenance costs ↑
ⓘ Cost ranges are severity-bucket heuristics (US national rule-of-thumb). Get contractor quotes + a written scope before underwriting a rehab budget.
Schools (NCES district)
- District
- Cecil County Public Schools
- NCES district ID
- 2400240
- Math proficiency
- 15% ▼ -21.00%
- Reading proficiency
- 30% ▼ -15.00%
- Median HH income
- $66,544
- Composite
- 21.51/100
- National rank
- #8322
- State rank
- #15 of 24 in MD
Livability — North East
- Score
- 70/100
- State rank
- #164
- US rank
- #7366
Category grades
Schools grade is shown separately in the Schools card above.
Census & demographics
- County
- Cecil County · 65,041 people
- City population
- 19,514
- Metro
- Philadelphia-Camden-Wilmington, PA-NJ-DE-MD
- Population (ZIP)
- 45,527
- Household income
- $85,775
- Rent vs Own
- Severe rent burden
- 1438.0
Population outlook (Cecil County) Hauer SSP2
- Today (2025)
- 105,877 people
- By 2030
- 106,905 · +1.0%
- By 2040
- 107,156 · +1.2%
- By 2050
- 104,170 · -1.6%
- By 2075
- 95,771 · -9.5%
- By 2100
- 82,381 · -22.2%
Race, ethnicity, and origin ACS 2023
- Neighborhood character
- Predominantly White (76%)
- Race & ethnicity
- White 76% Black 9% Two or more races 8% Hispanic / Latino 6% Asian 2%
- Hispanic origin (detail)
- Mexican 2% Puerto Rican 2%
- Common ancestry
- Romanian 6% Slovak 2% Italian 1%
- Foreign-born
- 5% · Canada
- Languages at home
- 92% English-only · Spanish 3% Other Indo-European 1% Other Asian/Pacific 1%
Political lean MEDSL · Cecil
- 2024 margin
- Solid R (+30.9) · D 33.5% · R 64.4% · Other 2.1%
- 2008→2024 swing
- -16.3pp toward R · 2008: -14.6pp · 2024: -30.9pp
- All cycles
- 2024: R+30.9 2020: R+26.6 2016: R+35.3 2012: R+20.4 2008: R+14.6
Not yet ingested
- Civics
- —
Market trends
- HPI YoY
- ▼ -192.67%
- Current HPI
- 253.7641
- Rent YoY
- ▲ 2.32%
- Metro
- Philadelphia-Camden-Wilmington, PA-NJ-DE-MD
- State GDP YoY
- ▲ 2.97%
- F500 in state
- 12
Industry mix (Fortune 500 HQ in MD)
| Industry | F500 HQs | Revenue |
|---|---|---|
| Aerospace / Defense | 1 | $71B |
|
||
| Utilities | 1 | $25B |
|
||
| Hotels | 1 | $24B |
|
||
| Consumer Goods | 1 | $7B |
|
||
| Real Estate | 1 | $6B |
|
||
| Chemicals | 1 | $2B |
|
||
Price history
1 event — show timeline
- 2026-06-10 Listed $140,000 BRIGHT MLS
Cash-flow waterfall
monthlySold comps — $/sqft
last 12 mo · ≤1 miLoading sold comps…