17951 Route 152 · Wayne, WV
Flood risk 5/10 · Moderate
- FEMA flood zone
- X (unshaded)
- Chance of flooding over 30 yrs
- 0.27%
- Est. flood insurance / yr
- $507 – $1,088
Fire risk 6/10 · Moderate
- Est. fire insurance / yr
- $787 – $1,461
Heat risk 4/10 · Minor
- Hot days now (above 100°F)
- 7 days/yr
- Hot days in 30 yrs
- 19 days/yr
Wind risk 2/10 · Minimal
- Chance of severe wind over 30 yrs
- 1.0%
Air-quality risk 1/10 · Minimal
- Unhealthy air days now
- 0 days/yr
- Unhealthy air days in 30 yrs
- 0 days/yr
Risk factors via First Street. Map © Google.
Why this score? — see what drove the C+ grade
The composite is a weighted blend of 9 inputs, each scored 0–100. Each bar is that input's sub-score; the figure is the points it added to the 100-point composite (weight × sub-score).
- Cash flow +18.2/30.0
- ARV discount +15.0/15.0
- Appreciation +6.6/10.0
- DSCR +5.7/10.0
- 1% rule +4.9/10.0
- Livability +3.0/5.0
- Schools +2.6/10.0
- Rent growth +2.5/5.0
- Condition / age +2.5/5.0
$125,000
🖨 Deal sheet (PDF) 📄 Offer letter ✓ Due diligence
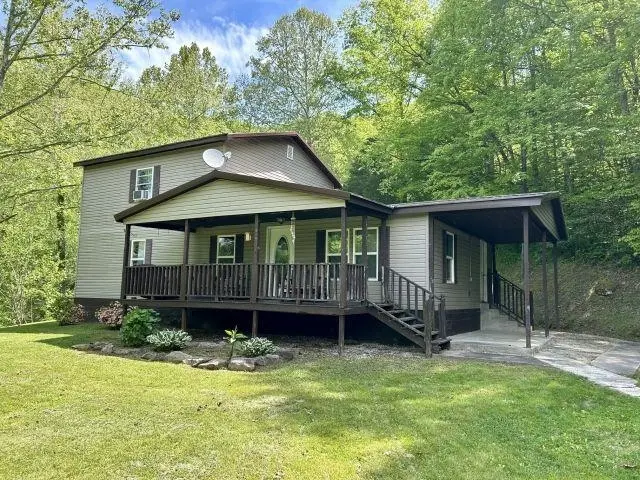
Listing remarks
Four bedroom, two bath home situated on a private 1 acre lot. The covered deck overlooks a spacious front yard and interior invites comfortable living with large bedrooms and a fully furnished kitchen. Located just about 6 miles from Wayne.
Key facts
- 1 acre lot
- Built 1982
- Listed 27 days
Property features AI
Exterior
- Utilities: Public water; Septic tank
- Home design: Single family residence; One story
- Construction: Vinyl siding; Metal roof
- Exterior features: Deck; Rolling slope lot
Interior
- Kitchen: Dishwasher; Microwave; Range/Oven; Refrigerator
- Flooring: Laminate; Vinyl
- Bathrooms: 2 full bathrooms
- Heating & cooling: Central heating; Electric heating; Central air conditioning; Window unit air conditioning
- Interior features: Dishwasher; Dryer; Microwave; Range/Oven; Refrigerator; Washer; Laminate flooring; Vinyl flooring; Crawl space basement
- Laundry & utility: Washer; Dryer
Neighborhood map
What this means for you Summary
Snapshot
- This is a 4-bed/2.0-bath manufactured listed at $125k.
Deal economics
- At list price, monthly cash flow is $111 ($1k/yr) — positive.
- The deal already cash-flows at list — no discount required.
- To meet the 1% rule (rent ≥ 1% of price), the offer needs to be $123k (1.2% below list).
- Recommended offer: $123k (1.5% below list) — sets the bar for market timing.
Location & tenants
- Location reads 59/100 on livability (#226 in WV) — a working-class tenant base; expect higher turnover. Strengths: crime A+, cost of living A+, housing A-; Watch: amenities F, commute F, employment F.
- Wayne County Schools (rural): math 25% / reading 38% proficiency, ranked #25 of 55 in WV (top 46%) — families likely to look elsewhere, expect single-tenant / working-renter base with shorter leases.
- Zoned schools: Wayne Elementary School (math 25% / reading 25%, grade F, #286 of 377 statewide, top 76%, 467 students, 0% FRL); Wayne Middle School (math 15% / reading 34%, grade F, #84 of 109 statewide, top 81%, 371 students, 0% FRL); Wayne High School (math 12% / reading 47%, grade F, #69 of 110 statewide, top 71%, 611 students, 0% FRL) — zoned schools average 0% FRL vs 46% district-wide (46 pts lower); this property's tenant base skews higher-income than the district average.
- Market conditions: 10 active listings in the ZIP; 67 units permitted in Wayne County in 2024 (0 in 5+ unit buildings).
Forward outlook
- In year one you build about $5k of equity ($864 loan paydown + $4k appreciation (3.2% local appreciation)).
- Wayne County population projected at -22% by 2050 — secular population decline; favor cash flow + early exit over multi-decade hold.
- At projected returns (3.2% appreciation + 3.0% rent growth), your $35k cash investment doubles in ~5 years — after that, you're playing with house money.
- By year 7, paydown + projected appreciation supports a ~$31k cash-out refi (75% LTV) — recoverable capital for the next deal without selling this one.
Negotiation context
- It's been on market 27 days — a 2% lower offer ($123k) is reasonable based on typical stale-listing flexibility.
- Current owner paid $72k; list at $125k implies a 74% gain — meaningful room to come down on a strong offer.
Risks & watch-outs
- Climate carrying-cost: moderate flood risk; major wildfire risk — expect insurance premiums to compound above CPI over the hold.
Questions for the listing agent
- Is there a deadline driving the sale (1031 exchange, divorce, estate, relocation)? That informs how much negotiation room exists.
- Schools are F-rated, which usually means shorter tenancies and higher turnover. Who's the typical renter profile here, and what's been the actual vacancy rate?
- What's the average days-on-market for RENTAL listings here right now (not sales)? A rising rental-DOM trend means longer vacancies and softer asking-rent achievability than the comps imply.
- What's the recent tenant-quality profile in this submarket — average credit score on applications, eviction rate, late-payment / NSF rate, and stable-employment percentage? A property-management company in the area should have these aggregated.
- How much new for-sale + rental construction is in the pipeline within 1–3 miles? Heavy new supply typically softens prices + rents 12–24 months out; constrained supply supports both.
Investment metrics
- 1% rule
- 0.99% ✗
- Cap rate
- 7.36%
- Cash-on-cash
- 3.82%
- DSCR
- 1.17
- GRM
- 8.4
CMA / ARV
- ARV (median comp)
- $183,064
- List price
- $125,000
- Delta
- -31.72%
- Verdict
- UNDERPRICED
- Comps
- 2 within 2.0 mi
Projected returns pro-forma
3.18% appreciation · 3.0% rent growth · sell at horizon
- IRR
- 11.6%
- Equity multiple
- 1.67×
- Total profit
- $23,386
- Equity at exit
- $57,494
- IRR
- 13.6%
- Equity multiple
- 3.05×
- Total profit
- $71,859
- Equity at exit
- $89,620
Cash invested: $35,000 (down + closing). Projections, not guarantees.
Landlord ↔ Tenant lean methodology
- Overall (STATE)
- 83 Strongly Landlord-Friendly
- State West Virginia
- 83 Strongly Landlord-Friendly · R+22
- County
- — inherits STATE
- City
- — inherits STATE
ZIP-level market 25517
- Home prices YoY
- 2.5%
- Active inventory
- 10
- Price-to-rent
- 8.4×
Monthly cashflow live
- Estimated rent
- $1,235 medium interval (Pro) →
- Mortgage (P&I)
- −$656
- Tax est. 1.5%
- −$156 /mo · $1,875/yr
- Insurance
- −$52
- HOA
- −$0
- Vacancy / Maint / Mgmt
- −$259
- Net cashflow
- $111
Break-even live
Sensitivity live
| Price | -10% $198 | -5% $155 | +0% $111 | +5% $68 | +10% $25 |
|---|---|---|---|---|---|
| Rent | -10% $14 | -5% $63 | +0% $111 | +5% $160 | +10% $209 |
| Rate | -1.0pp $174 | -0.5pp $143 | base $111 | +0.5pp $79 | +1.0pp $46 |
UW: 25.0% down · 7.5% · 30yr · 1.5% tax · 5.0% vac · 8.0% maint · 8.0% mgmt
Financing live
Cash to close
- Down payment
- $31,250
- Closing costs
- $3,750
- Reserves months
- —
- Total cash needed
- —
Loan-product check · same deal, 3 products live
Conventional
25% down · 7.5% · 30yr
- Down + closing
- —
- Monthly P&I
- —
- Monthly cashflow
- —
- DSCR
- —
- Eligible?
- —
Personal DTI + credit; lowest rate.
DSCR
20% down · 8.5% · 30yr
- Down + closing
- —
- Monthly P&I
- —
- Monthly cashflow
- —
- DSCR
- —
- Eligible?
- —
No personal income docs; deal must DSCR.
Hard money
10% down · 12.0% · 12mo
- Down + closing
- —
- Monthly P&I
- —
- Monthly cashflow
- —
- DSCR
- —
- Eligible?
- —
Short-term bridge; refi at stabilization.
Listing history 9 events
-
2026-06-02status $125,000 Pending 27 DOM
-
2026-06-01days on market $125,000 Active 27 DOM
-
2026-05-31days on market $125,000 Active 26 DOM
-
2026-05-30days on market $125,000 Active 25 DOM
-
2026-05-05$125,000 Active 240-char remark
-
2020-01-16soldstatus $72,000
-
2017-08-11soldstatus $100,000
-
2003-05-14soldstatus $11,000
-
1996-01-05soldstatus $9,000
ⓘ Source: listings_history table (triggers on properties + properties_extension) + one-shot
backfill from property_details.listing_events for pre-trigger history.
Climate risk First Street
- Flood 5/10 Major FEMA zone X (unshaded) · 27% chance over 30 yrs
- Wildfire 6/10 Major
- Heat 4/10 Moderate 7 d/yr ≥100°F today · 19 d/yr by 30 yrs out
- Wind 2/10 Low 100% chance of damaging wind over 30 yrs
- Air quality 1/10 Low 0 unhealthy d/yr today · 0 by 30 yrs out
Nearby sold comps map
Loading sold comps map…
Walkable amenities ~0.75 mi
Loading nearby amenities…
Taxation est. · year 1
- Rental income
- $14,815
- − Mortgage interest
- −$7,002
- − Property taxes
- −$1,875
- − Insurance
- −$625
- − Repairs & maintenance
- −$1,185
- − Management
- −$1,185
- − Depreciation
- −$3,636
- Taxable loss
- −$694
- Est. tax savings @ 24.0%
- +$167
- After-tax cash flow
- $1,504/yr
For passive investors: Depreciation is non-cash, so a rental often shows a tax loss while cash-flowing — sheltering income. Rental losses are passive: they offset passive income freely, and up to $25,000/yr can offset ordinary (W-2) income if you actively participate and your MAGI is under $100k (phasing out to $0 by $150k); unused losses carry forward. On sale, claimed depreciation is recaptured at up to 25%, and gains may owe capital-gains tax (a 1031 exchange can defer both). Figures are a year-1 estimate at your 24.0% rate — not tax advice; consult a CPA.
Schools (NCES district)
- District
- Wayne County Schools
- NCES district ID
- 5401500
- Math proficiency
- 25% ▼ -15.00%
- Reading proficiency
- 38% ▼ -10.00%
- Median HH income
- $36,283
- Composite
- 26.08/100
- National rank
- #7297
- State rank
- #25 of 55 in WV
Livability — Wayne
- Score
- 59/100
- State rank
- #226
- US rank
- #19755
Category grades
Schools grade is shown separately in the Schools card above.
Census & demographics
- Population (ZIP)
- 1,328
Population outlook (Wayne County) Hauer SSP2
- Today (2025)
- 38,267 people
- By 2030
- 36,578 · -4.4%
- By 2040
- 33,034 · -13.7%
- By 2050
- 29,671 · -22.5%
- By 2075
- 22,901 · -40.2%
- By 2100
- 17,421 · -54.5%
Race, ethnicity, and origin ACS 2023
- Neighborhood character
- Predominantly White (99%)
- Race & ethnicity
- White 99%
- Common ancestry
- Slovak 6% Italian 1%
Political lean MEDSL · Wayne
- 2024 margin
- Solid R (+53.4) · D 22.4% · R 75.8% · Other 1.8%
- 2008→2024 swing
- -35.1pp toward R · 2008: -18.2pp · 2024: -53.4pp
- All cycles
- 2024: R+53.4 2020: R+50.1 2016: R+51.3 2012: R+27.0 2008: R+18.2
Not yet ingested
- Civics
- —
Market trends
- HPI YoY
- ▲ 3.18%
- Current HPI
- 128.6283
- Rent YoY
- —
- Metro
- —
- State GDP YoY
- —
- F500 in state
- 0
Price history
+1288.9% since first listed6 events — show timeline
- 2026-06-01 Pending — HBRMLS
- 2026-05-05 Listed $125,000 HBRMLS
- 2020-01-16 Sold (Public Records) $72,000 Public Records
- 2017-08-11 Sold (Public Records) $100,000 Public Records
- 2003-05-14 Sold (Public Records) $11,000 Public Records
- 1996-01-05 Sold (Public Records) $9,000 Public Records
Property tax history
-5.7%/yrLatest (2025): $103 · +7.6% YoY. Source: county tax records.
Cash-flow waterfall
monthlySold comps — $/sqft
last 12 mo · ≤1 miLoading sold comps…