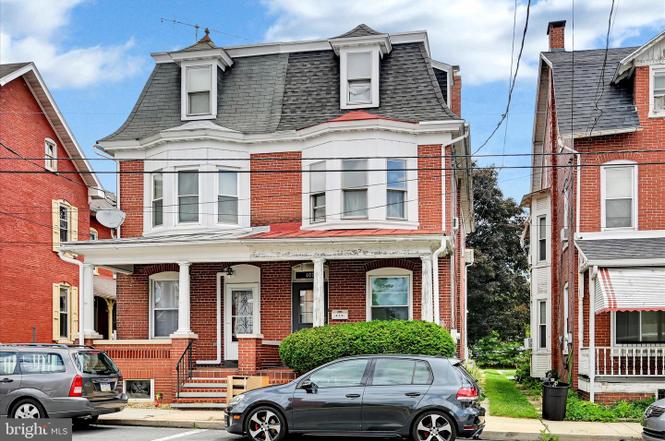
107 Woodrow Ave · Sinking Spring, PA
Flood risk 1/10 · Minimal
- FEMA flood zone
- X (unshaded)
- Chance of flooding over 30 yrs
- 0.0%
- Est. flood insurance / yr
- $473 – $860
Fire risk 3/10 · Minor
- Est. fire insurance / yr
- $511 – $949
Heat risk 5/10 · Moderate
- Hot days now (above 99°F)
- 7 days/yr
- Hot days in 30 yrs
- 16 days/yr
Wind risk 4/10 · Minor
- Chance of severe wind over 30 yrs
- 14.0%
Air-quality risk 3/10 · Minor
- Unhealthy air days now
- 2 days/yr
- Unhealthy air days in 30 yrs
- 3 days/yr
Risk factors via First Street. Map © Google.
Why this score? — see what drove the B grade
The composite is a weighted blend of 9 inputs, each scored 0–100. Each bar is that input's sub-score; the figure is the points it added to the 100-point composite (weight × sub-score).
- Cash flow +26.1/30.0
- ARV discount +15.0/15.0
- DSCR +8.8/10.0
- 1% rule +7.6/10.0
- Schools +4.6/10.0
- Livability +3.9/5.0
- Rent growth +2.5/5.0
- Condition / age +2.5/5.0
- Appreciation +0.0/10.0
$175,000
🖨 Deal sheet (PDF) 📄 Offer letter ✓ Due diligence
Listing remarks MLS
Large Semi With 3 Bedrooms, Possible 5 Bedrooms (2 On 3Rd Floor). Modern Kitchen, Large Garage, Nice Yard And Large Rooms. Lots Of Storage. Wilson Schools. Close To Shopping. Large Basement With Exit.
Key facts
- Covered front porch
- Mudroom pantry
- Garage
Tags
Property features AI
Finance
- Other: Total below-grade area reported (600); Finished above-grade area reported (2,010)
- HOA & community: Ground rent paid annually
Exterior
- Parking: Detached garage (rear entry) with one garage space; Garage includes additional storage area and is oversized; On-street parking available
- Utilities: Public water; Public sewer; Heating fueled by natural gas; Hot water uses oil
- Home design: Semi-detached structure; Entry level details not specified; Ownership is fee simple
- Construction: Brick construction; Stone foundation; Building not winterized; Above-grade finished living area recorded; below-grade unfinished area present
- Exterior features: Semi-detached property; Above- and below-grade structures; Property condition listed as average; Not in a federal flood zone
Interior
- Kitchen: Kitchen (appliances not specified)
- Bedrooms: Three bedrooms on the first upper level; Two bedrooms on the second upper level
- Bathrooms: One full bathroom (upper levels); One half bathroom on the main level
- Heating & cooling: Baseboard hot water heating; Window air conditioning units (electric)
- Interior features: Not furnished; Full unfinished walkout basement with interior access and rear/outside entrance
- Laundry & utility: Laundry located in the basement
Neighborhood map
What this means for you Summary
Snapshot
- This is a 3-bed/1.0-bath townhouse listed at $175k.
Deal economics
- At list price, monthly cash flow is $443 ($5k/yr) — positive.
- The deal already cash-flows at list — no discount required.
- Meets the 1% rule at list price ($2k rent vs $175k).
- Cap rate 9.3% vs local median 2.9% in Sinking Spring — top-decile yield for the area; either an underpriced asset or a hidden risk that comps aren't pricing in. Stress-test before assuming the spread holds.
Location & tenants
- Location reads 77/100 on livability (#346 in PA, #3,047 nationally) — a middle-class / working-renter tenant base. Strengths: crime A+, housing A+, health & safety A+; Watch: amenities F, commute F.
- Wilson SD (suburban): math 46% / reading 59% proficiency, ranked #127 of 539 in PA (top 24%) — acceptable for families but not a draw, mixed tenant base, ~2y average lease.
- Zoned schools: Wilson Hs (math 61% / reading 24%, grade F, #225 of 437 statewide, top 51%, 2,059 students, 34% FRL).
- Market conditions: 89 active listings in the ZIP; 1 comparable units currently listed for rent nearby; high-income renter base; 258 units permitted in Berks County in 2024 (27 in 5+ unit buildings).
Forward outlook
- Local home prices are declining (-3.0%/yr); year-one equity from $1k of loan paydown is wiped out by about $5k of value loss. Plan a longer hold.
- Berks County population projected at +3% by 2050 — modest demand growth; plan on rents tracking national, not racing it.
- At projected returns (-3.0% appreciation + 3.0% rent growth), your $49k cash investment doubles in ~10 years — after that, you're playing with house money.
Negotiation context
- Only 2 days on market — expect competitive offers; lowballing is unlikely to land.
- 2 sale attempts since 26y ago; this cycle's ask is 150% above the opening price — seller raised mid-cycle; expect resistance to lowballs.
- Current owner paid $70k; list at $175k implies a 150% gain — meaningful room to come down on a strong offer.
Risks & watch-outs
- Watch-outs: built in 1897 — expect roof / HVAC / electrical / plumbing capex.
- Climate carrying-cost: extreme-heat days projected 7→16/yr by 2055 (HVAC capex compounding) — expect insurance premiums to compound above CPI over the hold.
Questions for the listing agent
- Built in 1897 — when were the roof, HVAC, electrical panel, plumbing, and water heater last replaced?
- Is there a deadline driving the sale (1031 exchange, divorce, estate, relocation)? That informs how much negotiation room exists.
- Schools are B-rated — typically a magnet for longer-tenancy family renters. What's the average tenant stay here, and is there a school-zone premium baked into asking?
- What's the average days-on-market for RENTAL listings here right now (not sales)? A rising rental-DOM trend means longer vacancies and softer asking-rent achievability than the comps imply.
- What's the recent tenant-quality profile in this submarket — average credit score on applications, eviction rate, late-payment / NSF rate, and stable-employment percentage? A property-management company in the area should have these aggregated.
- How much new for-sale + rental construction is in the pipeline within 1–3 miles? Heavy new supply typically softens prices + rents 12–24 months out; constrained supply supports both.
Investment metrics
- 1% rule
- 1.26% ✓
- Cap rate
- 9.33%
- Cash-on-cash
- 10.84%
- DSCR
- 1.48
- GRM
- 6.6
CMA / ARV
- ARV (on-the-fly)
- $325,620
- Comps found
- 12
Show comp detail 12 sales within ~0.75 mi
| Address | Dist | Beds/Ba | Sqft | Sold | Price | $/sf | Match |
|---|---|---|---|---|---|---|---|
| 104 Michigan Dr | 0.29mi | 3/2.5 | 2,152 (+7%) | 0mo | $351,000 | $163 | 68 |
| 19 Michigan Dr | 0.41mi | 3/2.5 | 1,992 (-1%) | 15mo | $336,000 | $169 | 60 |
| 78 Michigan Dr | 0.40mi | 3/2.5 | 2,025 (+1%) | 17mo | $329,000 | $162 | 60 |
| 725 Maria | 0.47mi | 3/2.5 | 2,020 (+0%) | 19mo | $316,000 | $156 | 55 |
| 1548 Huron Dr | 0.46mi | 3/3.0 | 2,200 (+10%) | 1mo | $400,000 | $182 | 54 |
| 3311 Wyoming Dr N | 0.49mi | 3/2.5 | 1,964 (-2%) | 17mo | $330,000 | $168 | 54 |
| 374 Oneida Dr | 0.42mi | 3/3.5 | 1,974 (-2%) | 19mo | $275,000 | $139 | 52 |
| 148 Michigan Dr | 0.35mi | 3/2.5 | 2,266 (+13%) | 11mo | $344,000 | $152 | 47 |
| 39 Michigan Dr | 0.42mi | 3/2.0 | 2,205 (+10%) | 18mo | $340,000 | $154 | 45 |
| 1526 Huron Dr | 0.52mi | 3/2.5 | 2,268 (+13%) | 12mo | $335,000 | $148 | 38 |
| 1408 Hillpoint | 0.60mi | 3/2.5 | 2,266 (+13%) | 11mo | $345,000 | $152 | 36 |
| 383 Oneida Dr | 0.47mi | 3/2.5 | 1,720 (-14%) | 16mo | $325,000 | $189 | 34 |
Match score weights: distance 35% · size 25% · config 20% · recency 20%. Top-matched comps best support the ARV.
Projected returns pro-forma
-3.0% appreciation · 3.0% rent growth · sell at horizon
- IRR
- -0.0%
- Equity multiple
- 1.00×
- Total profit
- $-81
- Equity at exit
- $26,093
- IRR
- 9.7%
- Equity multiple
- 1.75×
- Total profit
- $36,597
- Equity at exit
- $15,131
Cash invested: $49,000 (down + closing). Projections, not guarantees.
Landlord ↔ Tenant lean methodology
- Overall (STATE)
- 62 Landlord-Friendly
- State Pennsylvania
- 62 Landlord-Friendly · EVEN
- County
- — inherits STATE
- City
- — inherits STATE
ZIP-level market 19608
- Home prices YoY
- -21.4%
- Active inventory
- 89
- Price-to-rent
- 6.6×
Monthly cashflow live
- Estimated rent
- $2,213 medium interval (Pro) →
- Mortgage (P&I)
- −$918
- Tax from tax record
- −$315 /mo · $3,780/yr
- Insurance
- −$73
- HOA
- −$0
- Vacancy / Maint / Mgmt
- −$465
- Net cashflow
- $443
Break-even live
Sensitivity live
| Price | -10% $542 | -5% $492 | +0% $443 | +5% $393 | +10% $343 |
|---|---|---|---|---|---|
| Rent | -10% $268 | -5% $355 | +0% $443 | +5% $530 | +10% $617 |
| Rate | -1.0pp $531 | -0.5pp $487 | base $443 | +0.5pp $397 | +1.0pp $351 |
UW: 25.0% down · 7.5% · 30yr · 1.5% tax · 5.0% vac · 8.0% maint · 8.0% mgmt
Financing live
Cash to close
- Down payment
- $43,750
- Closing costs
- $5,250
- Reserves months
- —
- Total cash needed
- —
Loan-product check · same deal, 3 products live
Conventional
25% down · 7.5% · 30yr
- Down + closing
- —
- Monthly P&I
- —
- Monthly cashflow
- —
- DSCR
- —
- Eligible?
- —
Personal DTI + credit; lowest rate.
DSCR
20% down · 8.5% · 30yr
- Down + closing
- —
- Monthly P&I
- —
- Monthly cashflow
- —
- DSCR
- —
- Eligible?
- —
No personal income docs; deal must DSCR.
Hard money
10% down · 12.0% · 12mo
- Down + closing
- —
- Monthly P&I
- —
- Monthly cashflow
- —
- DSCR
- —
- Eligible?
- —
Short-term bridge; refi at stabilization.
Rent comps 1 comps
| Address | Beds | Baths | Sqft | Rent | $/sqft | DOM | Units | Dist |
|---|---|---|---|---|---|---|---|---|
| 2603 Eisenhower Ct Reading, PA | 3.0 | 2.0 | 1452 | $2,000 | $1.38 | 14d | 1 | 1.30mi |
Listing history 3 events
-
2026-06-18days on market $175,000 Coming Soon 2 DOM
-
2026-06-17remarks 699-char remark
-
2026-06-17$175,000 Coming Soon 1 DOM
ⓘ Source: listings_history table (triggers on properties + properties_extension) + one-shot
backfill from property_details.listing_events for pre-trigger history.
Tax reassessment forecast PA · Partial reset (capped growth)
- Current annual tax
- $3,780 · $315/mo
- Projected year-2 tax
- $3,780 · $315/mo
- Expected delta
- $0/yr ($0/mo · 0.0%)
ⓘ Screening estimate from a state-policy table — verify with the county assessor before closing.
Climate risk First Street
- Flood 1/10 Low FEMA zone X (unshaded) · 0% chance over 30 yrs
- Wildfire 3/10 Moderate
- Heat 5/10 Major 7 d/yr ≥99°F today · 16 d/yr by 30 yrs out
- Wind 4/10 Moderate 14% chance of damaging wind over 30 yrs
- Air quality 3/10 Moderate 2 unhealthy d/yr today · 3 by 30 yrs out
Nearby sold comps map
Loading sold comps map…
Walkable amenities ~0.75 mi
Loading nearby amenities…
Taxation est. · year 1
- Rental income
- $26,555
- − Mortgage interest
- −$9,803
- − Property taxes
- −$3,780
- − Insurance
- −$875
- − Repairs & maintenance
- −$2,124
- − Management
- −$2,124
- − Depreciation
- −$5,091
- Taxable income
- $2,757
- Est. tax owed @ 24.0%
- −$662
- After-tax cash flow
- $4,649/yr
For passive investors: Depreciation is non-cash, so a rental often shows a tax loss while cash-flowing — sheltering income. Rental losses are passive: they offset passive income freely, and up to $25,000/yr can offset ordinary (W-2) income if you actively participate and your MAGI is under $100k (phasing out to $0 by $150k); unused losses carry forward. On sale, claimed depreciation is recaptured at up to 25%, and gains may owe capital-gains tax (a 1031 exchange can defer both). Figures are a year-1 estimate at your 24.0% rate — not tax advice; consult a CPA.
Schools (NCES district)
- District
- Wilson SD
- NCES district ID
- 4226580
- Math proficiency
- 46% ▼ -10.00%
- Reading proficiency
- 59% ▼ -11.00%
- Median HH income
- $65,787
- Composite
- 46.32/100
- National rank
- #2471
- State rank
- #127 of 539 in PA
Livability — Sinking Spring
- Score
- 77/100
- State rank
- #346
- US rank
- #3047
Category grades
Schools grade is shown separately in the Schools card above.
Census & demographics
- Census place
- Sinking Spring, PA
- County
- Berks County · 195,629 people
- Metro
- Reading, PA
- Population (ZIP)
- 24,178
- Household income
- $110,173
- Rent vs Own
- Severe rent burden
- 411.0
Population outlook (Berks County) Hauer SSP2
- Today (2025)
- 425,767 people
- By 2030
- 428,814 · +0.7%
- By 2040
- 433,463 · +1.8%
- By 2050
- 439,426 · +3.2%
- By 2075
- 478,647 · +12.4%
- By 2100
- 518,507 · +21.8%
Race, ethnicity, and origin ACS 2023
- Neighborhood character
- Predominantly White (78%)
- Race & ethnicity
- White 78% Hispanic / Latino 11% Two or more races 6% Asian 4% Black 4%
- Hispanic origin (detail)
- Puerto Rican 4% Cuban 1% Dominican 3%
- Common ancestry
- Romanian 6% Scandinavian 2% Polish 2%
- Foreign-born
- 9% · Canada, Vietnam, Jamaica
- Languages at home
- 85% English-only · Spanish 7% Other Indo-European 4% Vietnamese 1%
Political lean MEDSL · Berks
- 2024 margin
- R (+12.2) · D 43.4% · R 55.6%
- 2008→2024 swing
- -21.4pp toward R · 2008: 9.2pp · 2024: -12.2pp
- All cycles
- 2024: R+12.2 2020: R+8.2 2016: R+10.2 2012: R+0.6 2008: D+9.2
Not yet ingested
- Civics
- —
Market trends
- HPI YoY
- ▼ -72.86%
- Current HPI
- 267.9363
- Rent YoY
- —
- Metro
- Reading, PA
- State GDP YoY
- ▲ 1.68%
- F500 in state
- 34
Industry mix (Fortune 500 HQ in PA)
| Industry | F500 HQs | Revenue |
|---|---|---|
| Healthcare | 2 | $309B |
|
||
| Insurance | 2 | $27B |
|
||
| Telecommunications / Media | 1 | $124B |
|
||
| Industrial Distribution | 1 | $22B |
|
||
| Financial Services | 1 | $20B |
|
||
| Chemicals / Materials | 1 | $18B |
|
||
Price history
+197.8% since first listed8 events — show timeline
- 2026-06-17 Coming Soon $175,000 BRIGHT MLS
- 2001-05-22 Sold (Public Records) $69,900 Public Records
- 2001-05-17 Sold (MLS) $69,900 BRIGHT MLS
- 2001-04-02 Listing Removed — BRIGHT MLS
- 2001-01-10 Listed $69,900 BRIGHT MLS
- 2000-10-16 Listing Removed — BRIGHT MLS
- 2000-10-16 Listed $74,900 BRIGHT MLS
- 1995-06-19 Sold (Public Records) $58,765 Public Records
Property tax history
+3.4%/yrLatest (2026): $3,780 · +1.1% YoY. Source: county tax records.
Cash-flow waterfall
monthlySold comps — $/sqft
last 12 mo · ≤1 miLoading sold comps…