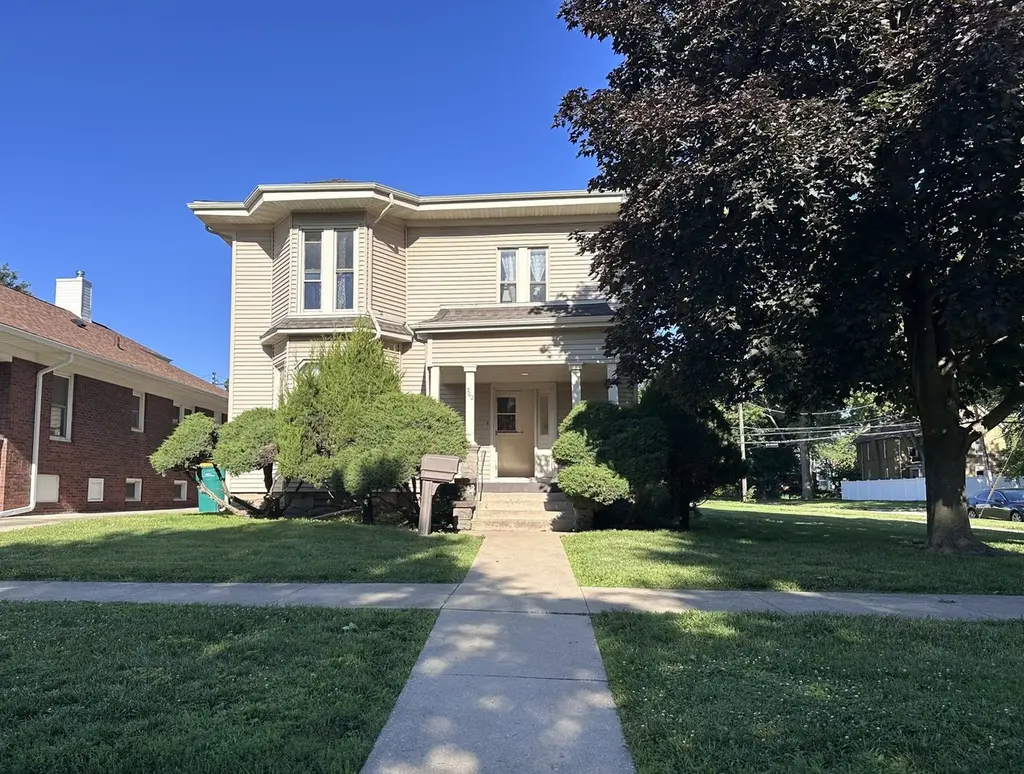
302 S Vermillion St · Streator, IL
Flood risk 1/10 · Minimal
- FEMA flood zone
- X (unshaded)
- Chance of flooding over 30 yrs
- 0.0%
- Est. flood insurance / yr
- $473 – $860
Fire risk 1/10 · Minimal
- Est. fire insurance / yr
- $804 – $1,492
Heat risk 3/10 · Minor
- Hot days now (above 104°F)
- 7 days/yr
- Hot days in 30 yrs
- 17 days/yr
Wind risk 2/10 · Minimal
- Chance of severe wind over 30 yrs
- 1.0%
Air-quality risk 2/10 · Minimal
- Unhealthy air days now
- 1 days/yr
- Unhealthy air days in 30 yrs
- 1 days/yr
Risk factors via First Street. Map © Google.
Why this score? — see what drove the D- grade
The composite is a weighted blend of 9 inputs, each scored 0–100. Each bar is that input's sub-score; the figure is the points it added to the 100-point composite (weight × sub-score).
- Cash flow +13.5/30.0
- ARV discount +7.5/15.0
- DSCR +4.1/10.0
- 1% rule +3.7/10.0
- Livability +3.2/5.0
- Rent growth +2.5/5.0
- Condition / age +2.5/5.0
- Schools +1.3/10.0
- Appreciation +0.0/10.0
$197,500
🖨 Deal sheet 📄 Offer letter ✓ Due diligence
Listing remarks MLS
Extremely well-maintained three unit apartment for sale. Live in one and rent the other two Two lower level apartments, one with one bedroom and one with two bedrooms One upper level apartment with three bedrooms and separate dining room all utilities for each unit are separate All apartments have access to the basement for storage Each unit is 100 amp service. Heating is gas forced air. All water pipes replaced approximately 10 years ago. Fairly new water heaters to each unit Newer windows, Two new composite covered porches. Some original hardwood flooring. Downstairs units have an enclosed entry space.
Key facts
- 6,534 sq ft lot
- Built 1885
- Listed 2 days
Property features AI
Finance
- Other: School bus service available
- Financial info: Three-unit building; Current rents noted per unit: $900, $1,050, $570; Security deposits noted per unit: $900, $1,050, $515; Units are month-to-month leases; Special service area: No
Exterior
- Utilities: Public water; Public sewer
- Home design: Two- to four-unit property; Fee simple ownership; Over 100 years old; Built before 1978
- Construction: Vinyl siding
- Exterior features: Corner lot; Lot dimensions approximately 61 x 105; Less than 0.25 acre
Interior
- Kitchen: Stove; Refrigerator
- Bedrooms: 5 bedrooms (all possible/available as listed)
- Bathrooms: 3 full bathrooms
- Heating & cooling: Natural gas heating
- Interior features: 13 total rooms; Unfinished full basement
- Laundry & utility: Tenant pays electric, gas, heat, and water (for units)
Neighborhood map
What this means for you Summary
Snapshot
- This is a 15-bed/9.0-bath single-family listed at $198k.
Deal economics
- At list price, monthly cash flow is $8 ($96/yr) — positive.
- The deal already cash-flows at list — no discount required.
- To meet the 1% rule (rent ≥ 1% of price), the offer needs to be $172k (13.1% below list).
- Recommended offer: $172k (13.1% below list) — sets the bar for 1% rule.
Location & tenants
- Location reads 63/100 on livability (#752 in IL) — a middle-class / working-renter tenant base. Strengths: cost of living A+, health & safety A+, housing B+; Watch: schools F, amenities F, commute F.
- Streator Twp Hsd 40 (town): math 11% / reading 19% proficiency, ranked #513 of 620 in IL (top 83%) — low school quality limits family demand, transient renter base, plan for 1-2y turnover.
- Market conditions: 87 active listings in the ZIP; 82 units permitted in LaSalle County in 2024 (0 in 5+ unit buildings).
- This rent runs 35% of the median local income ($59k/yr) — at the standard rent-burdened threshold; future hikes will face affordability resistance.
Forward outlook
- Local home prices are declining (-3.0%/yr); year-one equity from $1k of loan paydown is wiped out by about $6k of value loss. Plan a longer hold.
- LaSalle County population projected at -16% by 2050 — secular population decline; favor cash flow + early exit over multi-decade hold.
Negotiation context
- Only 3 days on market — expect competitive offers; lowballing is unlikely to land.
- 4 sale attempts since 2y ago with the ask held roughly flat each time — persistent listings suggest the price (not the market) is what's stuck; bring a comps-based counter.
- Current owner paid $153k; 29% above their basis — modest negotiation headroom, anchor on the comps not their cost.
Risks & watch-outs
- Watch-outs: built in 1885 — expect roof / HVAC / electrical / plumbing capex.
Questions for the listing agent
- Built in 1885 — when were the roof, HVAC, electrical panel, plumbing, and water heater last replaced?
- Is there a deadline driving the sale (1031 exchange, divorce, estate, relocation)? That informs how much negotiation room exists.
- Schools are F-rated, which usually means shorter tenancies and higher turnover. Who's the typical renter profile here, and what's been the actual vacancy rate?
- The area grade is low — what's the realistic commute time and amenity access for the typical tenant pool here? Any planned neighborhood developments (good or bad) we should know about?
- What's the average days-on-market for RENTAL listings here right now (not sales)? A rising rental-DOM trend means longer vacancies and softer asking-rent achievability than the comps imply.
- What's the recent tenant-quality profile in this submarket — average credit score on applications, eviction rate, late-payment / NSF rate, and stable-employment percentage? A property-management company in the area should have these aggregated.
- How much new for-sale + rental construction is in the pipeline within 1–3 miles? Heavy new supply typically softens prices + rents 12–24 months out; constrained supply supports both.
Investment metrics
- 1% rule
- 0.87% ✗
- Cap rate
- 6.34%
- Cash-on-cash
- 0.17%
- DSCR
- 1.01
- GRM
- 9.6
CMA / ARV
No comps found within radius.
Projected returns pro-forma
-3.0% appreciation · 3.0% rent growth · sell at horizon
- IRR
- -16.0%
- Equity multiple
- 0.43×
- Total profit
- $-31,479
- Equity at exit
- $29,448
- IRR
- -7.6%
- Equity multiple
- 0.52×
- Total profit
- $-26,695
- Equity at exit
- $17,076
Cash invested: $55,300 (down + closing). Projections, not guarantees.
Landlord ↔ Tenant lean methodology
- Overall (STATE)
- 43 Moderately Tenant-Leaning
- State Illinois
- 43 Moderately Tenant-Leaning · D+7
- County
- — inherits STATE
- City
- — inherits STATE
ZIP-level market 61364
- Home prices YoY
- -31.1%
- Active inventory
- 87
- Price-to-rent
- 9.6×
Monthly cashflow live
- Estimated rent
- $1,716 medium interval (Pro) →
- Mortgage (P&I)
- −$1,036
- Tax from tax record
- −$230 /mo · $2,755/yr
- Insurance
- −$82
- HOA
- −$0
- Vacancy / Maint / Mgmt
- −$360
- Net cashflow
- $8
Break-even live
UW: 25.0% down · 7.5% · 30yr · 1.5% tax · 5.0% vac · 8.0% maint · 8.0% mgmt
Financing live
Cash to close
- Down payment
- $49,375
- Closing costs
- $5,925
- Reserves months
- —
- Total cash needed
- —
Loan-product check · same deal, 3 products live
Conventional
25% down · 7.5% · 30yr
- Down + closing
- —
- Monthly P&I
- —
- Monthly cashflow
- —
- DSCR
- —
- Eligible?
- —
Personal DTI + credit; lowest rate.
DSCR
20% down · 8.5% · 30yr
- Down + closing
- —
- Monthly P&I
- —
- Monthly cashflow
- —
- DSCR
- —
- Eligible?
- —
No personal income docs; deal must DSCR.
Hard money
10% down · 12.0% · 12mo
- Down + closing
- —
- Monthly P&I
- —
- Monthly cashflow
- —
- DSCR
- —
- Eligible?
- —
Short-term bridge; refi at stabilization.
Listing history 4 events
-
2026-06-19days on market $197,500 Active 3 DOM
-
2026-06-18days on market $197,500 Active 2 DOM
-
2026-06-17remarks 695-char remark
-
2026-06-17$197,500 Active 1 DOM
ⓘ Source: listings_history table (triggers on properties + properties_extension) + one-shot
backfill from property_details.listing_events for pre-trigger history.
Tax reassessment forecast IL · Partial reset (capped growth)
- Current annual tax
- $2,755 · $230/mo
- Projected year-2 tax
- $3,619 · $302/mo
- Expected delta
- +$864/yr (+$72/mo · 31.4%)
ⓘ Screening estimate from a state-policy table — verify with the county assessor before closing.
Climate risk First Street
- Flood 1/10 Low FEMA zone X (unshaded) · 0% chance over 30 yrs
- Wildfire 1/10 Low
- Heat 3/10 Moderate 7 d/yr ≥104°F today · 17 d/yr by 30 yrs out
- Wind 2/10 Low 100% chance of damaging wind over 30 yrs
- Air quality 2/10 Low 1 unhealthy d/yr today · 1 by 30 yrs out
Nearby sold comps map
Loading sold comps map…
Walkable amenities ~0.75 mi
Loading nearby amenities…
Taxation est. · year 1
- Rental income
- $20,590
- − Mortgage interest
- −$11,063
- − Property taxes
- −$2,755
- − Insurance
- −$988
- − Repairs & maintenance
- −$1,647
- − Management
- −$1,647
- − Depreciation
- −$5,745
- Taxable loss
- −$3,255
- Est. tax savings @ 24.0%
- +$781
- After-tax cash flow
- $877/yr
For passive investors: Depreciation is non-cash, so a rental often shows a tax loss while cash-flowing — sheltering income. Rental losses are passive: they offset passive income freely, and up to $25,000/yr can offset ordinary (W-2) income if you actively participate and your MAGI is under $100k (phasing out to $0 by $150k); unused losses carry forward. On sale, claimed depreciation is recaptured at up to 25%, and gains may owe capital-gains tax (a 1031 exchange can defer both). Figures are a year-1 estimate at your 24.0% rate — not tax advice; consult a CPA.
Schools (NCES district)
- District
- Streator Twp Hsd 40
- NCES district ID
- 1738100
- Math proficiency
- 11% ▼ -4.00%
- Reading proficiency
- 19% ▼ -1.00%
- Median HH income
- $43,002
- Composite
- 13.07/100
- National rank
- #9561
- State rank
- #513 of 620 in IL
Livability — Streator
- Score
- 63/100
- State rank
- #752
- US rank
- #15266
Category grades
Schools grade is shown separately in the Schools card above.
Census & demographics
- Census place
- Streator, IL
- County
- La Salle County · 41,676 people
- City population
- 17,963
- Metro
- Ottawa, IL
- Population (ZIP)
- 17,963
- Household income
- $59,060
- Rent vs Own
- Severe rent burden
- 450.0
Population outlook (LaSalle County) Hauer SSP2
- Today (2025)
- 107,080 people
- By 2030
- 104,196 · -2.7%
- By 2040
- 97,413 · -9.0%
- By 2050
- 90,294 · -15.7%
- By 2075
- 76,252 · -28.8%
- By 2100
- 61,339 · -42.7%
Race, ethnicity, and origin ACS 2023
- Neighborhood character
- Predominantly White (83%)
- Race & ethnicity
- White 83% Hispanic / Latino 11% Two or more races 4% Black 3%
- Hispanic origin (detail)
- Mexican 10%
- Common ancestry
- Romanian 3% Lithuanian 2% Slovak 2%
- Foreign-born
- 3% · Canada
- Languages at home
- 93% English-only · Spanish 6%
Political lean MEDSL · LaSalle
- 2024 margin
- R (+18.5) · D 40.1% · R 58.6% · Other 1.3%
- 2008→2024 swing
- -29.6pp toward R · 2008: 11.1pp · 2024: -18.5pp
- All cycles
- 2024: R+18.5 2020: R+14.3 2016: R+14.4 2012: R+0.4 2008: D+11.1
Not yet ingested
- Civics
- —
Market trends
- HPI YoY
- ▼ -105.28%
- Current HPI
- 233.5533
- Rent YoY
- —
- Metro
- Ottawa, IL
- State GDP YoY
- ▲ 1.59%
- F500 in state
- 60
Industry mix (Fortune 500 HQ in IL)
| Industry | F500 HQs | Revenue |
|---|---|---|
| Insurance | 4 | $201B |
|
||
| Consumer Goods | 4 | $87B |
|
||
| Industrial Machinery | 3 | $64B |
|
||
| Healthcare | 2 | $55B |
|
||
| Retail / Pharmacy | 1 | $148B |
|
||
| Agriculture / Food | 1 | $86B |
|
||
Price history
+32.6% since first listed10 events — show timeline
- 2026-06-16 Listed $197,500 MRED as Distributed by MLS Grid
- 2025-02-06 Sold (Public Records) $153,000 Public Records
- 2025-02-04 Sold (MLS) $153,000 MRED as Distributed by MLS Grid
- 2024-11-27 Pending — MRED as Distributed by MLS Grid
- 2024-11-27 Relisted — MRED as Distributed by MLS Grid
- 2024-11-27 Contingent — MRED as Distributed by MLS Grid
- 2024-10-10 Relisted — MRED as Distributed by MLS Grid
- 2024-10-07 Contingent — MRED as Distributed by MLS Grid
- 2024-09-11 Price Changed $159,000 MRED as Distributed by MLS Grid
- 2024-09-10 Listed $149,000 MRED as Distributed by MLS Grid
Property tax history
+2.6%/yrLatest (2024): $2,755 · +8.1% YoY. Source: county tax records.
Cash-flow waterfall
monthlySold comps — $/sqft
last 12 mo · ≤1 miLoading sold comps…