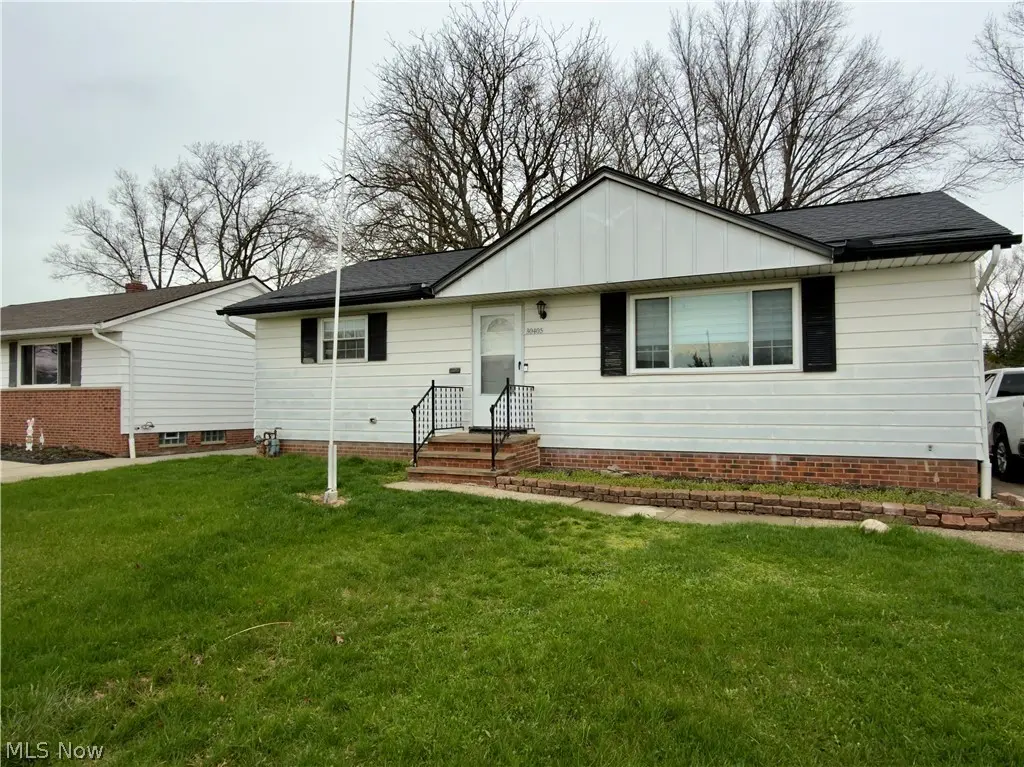
30405 Vineyard Rd · Willowick, OH
Flood risk 1/10 · Minimal
- FEMA flood zone
- X (unshaded)
- Chance of flooding over 30 yrs
- 0.0%
- Est. flood insurance / yr
- $473 – $860
Fire risk 1/10 · Minimal
- Est. fire insurance / yr
- $713 – $1,323
Heat risk 3/10 · Minor
- Hot days now (above 95°F)
- 7 days/yr
- Hot days in 30 yrs
- 18 days/yr
Wind risk 1/10 · Minimal
- Chance of severe wind over 30 yrs
- —
Air-quality risk 3/10 · Minor
- Unhealthy air days now
- 3 days/yr
- Unhealthy air days in 30 yrs
- 4 days/yr
Risk factors via First Street. Map © Google.
Why this score? — see what drove the C grade
The composite is a weighted blend of 9 inputs, each scored 0–100. Each bar is that input's sub-score; the figure is the points it added to the 100-point composite (weight × sub-score).
- Cash flow +17.2/30.0
- ARV discount +13.8/15.0
- DSCR +5.4/10.0
- 1% rule +5.3/10.0
- Schools +4.3/10.0
- Livability +4.2/5.0
- Rent growth +3.7/5.0
- Condition / age +2.5/5.0
- Appreciation +0.0/10.0
$165,000
🖨 Deal sheet 📄 Offer letter ✓ Due diligence
Listing remarks
Welcome to 3405 Vineyard Rd — a solid, move-in-ready home with the big-ticket items already handled, giving you the opportunity to add your own finishes and build equity. This 3-bedroom, 2 full bath ranch offers true single-level living with a functional layout. The main living and dining areas feature new luxury vinyl flooring, creating a clean, modern feel, while the bedrooms offer hardwood flooring ready to be refinished or customized to your style. A newer furnace and A/C provide added peace of mind. The finished basement expands the living space significantly, offering flexibility for a rec room, home office, gym, or additional entertaining area — a major value-add not alwa
Key facts
- 7,405 sq ft lot
- 2 garage spots
- Built 1959
Neighborhood map
What this means for you Summary
Snapshot
- This is a 3-bed/1.0-bath single-family listed at $165k.
Deal economics
- At list price, monthly cash flow is $118 ($1k/yr) — positive.
- The deal already cash-flows at list — no discount required.
- Meets the 1% rule at list price ($2k rent vs $165k).
- Cap rate 7.2% vs local median 5.4% in Willowick — top-decile yield for the area; either an underpriced asset or a hidden risk that comps aren't pricing in. Stress-test before assuming the spread holds.
Location & tenants
- Location reads 84/100 on livability (#50 in OH, #706 nationally) — a professional / high-income tenant draw. Strengths: crime A+, amenities A+, cost of living A+; Watch: commute F.
- Willoughby-Eastlake City (suburban): math 42% / reading 58% proficiency, ranked #434 of 656 in OH (top 66%) — acceptable for families but not a draw, mixed tenant base, ~2y average lease.
- Market conditions: Rents rising fast (+4.8%/yr); 129 active listings in the ZIP; 8 comparable units currently listed for rent nearby; rentals at typical pace (median 19d on market — plan ~3-4 weeks tenant-placement turnaround); 448 units permitted in Lake County in 2024 (0 in 5+ unit buildings).
Forward outlook
- Local home prices are declining (-3.0%/yr); year-one equity from $1k of loan paydown is wiped out by about $5k of value loss. Plan a longer hold.
- Lake County population projected to shrink 8% by 2050 — rents likely to lag national; underwrite the cash flow, not the appreciation.
Negotiation context
- Only 14 days on market — expect competitive offers; lowballing is unlikely to land.
- Current owner paid $111k; 49% above their basis — modest negotiation headroom, anchor on the comps not their cost.
Risks & watch-outs
- Watch-outs: built in 1959 — expect roof / HVAC / electrical / plumbing capex.
Questions for the listing agent
- Built in 1959 — when were the roof, HVAC, electrical panel, plumbing, and water heater last replaced?
- Is there a deadline driving the sale (1031 exchange, divorce, estate, relocation)? That informs how much negotiation room exists.
- Schools are B-rated — typically a magnet for longer-tenancy family renters. What's the average tenant stay here, and is there a school-zone premium baked into asking?
- What's the average days-on-market for RENTAL listings here right now (not sales)? A rising rental-DOM trend means longer vacancies and softer asking-rent achievability than the comps imply.
- What's the recent tenant-quality profile in this submarket — average credit score on applications, eviction rate, late-payment / NSF rate, and stable-employment percentage? A property-management company in the area should have these aggregated.
- How much new for-sale + rental construction is in the pipeline within 1–3 miles? Heavy new supply typically softens prices + rents 12–24 months out; constrained supply supports both.
Investment metrics
- 1% rule
- 1.03% ✓
- Cap rate
- 7.15%
- Cash-on-cash
- 3.07%
- DSCR
- 1.14
- GRM
- 8.1
CMA / ARV
- ARV (on-the-fly)
- $192,000
- Comps found
- 12
Show comp detail 12 sales within ~0.75 mi
| Address | Dist | Beds/Ba | Sqft | Sold | Price | $/sf | Match |
|---|---|---|---|---|---|---|---|
| 30405 Vineyard Rd | 0.00mi | 3/2.0 | 960 (0%) | 1mo | $162,500 | $169 | 96 |
| 30424 Fern Dr | 0.21mi | 3/2.0 | 1,014 (+6%) | 0mo | $201,000 | $198 | 77 |
| 30404 Gebhart Pl | 0.04mi | 3/1.5 | 1,062 (+11%) | 5mo | $209,900 | $198 | 74 |
| 30153 Truman Ave | 0.40mi | 3/2.0 | 988 (+3%) | 1mo | $234,000 | $237 | 72 |
| 30232 Forestgrove Rd | 0.23mi | 3/2.5 | 1,062 (+11%) | 5mo | $220,000 | $207 | 62 |
| 30812 Ronald Dr | 0.21mi | 3/2.0 | 1,094 (+14%) | 4mo | $240,000 | $219 | 59 |
| 29070 W Willowick Dr | 0.64mi | 4/1.0 (+1) | 1,014 (+6%) | 2mo | $220,000 | $217 | 54 |
| 845 Charles St | 0.50mi | 3/1.0 | 1,102 (+15%) | 3mo | $253,400 | $230 | 50 |
| 29050 Edgewood Dr | 0.66mi | 3/2.0 | 1,050 (+9%) | 0mo | $210,000 | $200 | 49 |
| 518 E 305th St | 0.46mi | 3/2.0 | 1,102 (+15%) | 2mo | $215,000 | $195 | 49 |
| 29010 Barjode Rd | 0.66mi | 3/1.0 | 1,064 (+11%) | 3mo | $164,000 | $154 | 48 |
| 30545 Willow Ln | 0.60mi | 3/1.5 | 1,080 (+12%) | 1mo | $179,900 | $167 | 48 |
Match score weights: distance 35% · size 25% · config 20% · recency 20%. Top-matched comps best support the ARV.
Projected returns pro-forma
-3.0% appreciation · 4.81% rent growth · sell at horizon
- IRR
- -9.3%
- Equity multiple
- 0.65×
- Total profit
- $-15,993
- Equity at exit
- $24,602
- IRR
- 2.6%
- Equity multiple
- 1.20×
- Total profit
- $9,437
- Equity at exit
- $14,266
Cash invested: $46,200 (down + closing). Projections, not guarantees.
Landlord ↔ Tenant lean methodology
- Overall (STATE)
- 73 Landlord-Friendly
- State Ohio
- 73 Landlord-Friendly · R+6
- County
- — inherits STATE
- City
- — inherits STATE
ZIP-level market 44095
- Rents YoY
- 4.8%
- Active inventory
- 129
- Price-to-rent
- 8.1×
Monthly cashflow live
- Estimated rent
- $1,693 high interval (Pro) →
- Mortgage (P&I)
- −$865
- Tax from tax record
- −$285 /mo · $3,422/yr
- Insurance
- −$69
- HOA
- −$0
- Vacancy / Maint / Mgmt
- −$356
- Net cashflow
- $118
Break-even live
UW: 25.0% down · 7.5% · 30yr · 1.5% tax · 5.0% vac · 8.0% maint · 8.0% mgmt
Financing live
Cash to close
- Down payment
- $41,250
- Closing costs
- $4,950
- Reserves months
- —
- Total cash needed
- —
Loan-product check · same deal, 3 products live
Conventional
25% down · 7.5% · 30yr
- Down + closing
- —
- Monthly P&I
- —
- Monthly cashflow
- —
- DSCR
- —
- Eligible?
- —
Personal DTI + credit; lowest rate.
DSCR
20% down · 8.5% · 30yr
- Down + closing
- —
- Monthly P&I
- —
- Monthly cashflow
- —
- DSCR
- —
- Eligible?
- —
No personal income docs; deal must DSCR.
Hard money
10% down · 12.0% · 12mo
- Down + closing
- —
- Monthly P&I
- —
- Monthly cashflow
- —
- DSCR
- —
- Eligible?
- —
Short-term bridge; refi at stabilization.
Rent comps 8 comps
| Address | Beds | Baths | Sqft | Rent | $/sqft | DOM | Units | Dist |
|---|---|---|---|---|---|---|---|---|
| 679 Dickerson Rd Willowick, OH | 4.0 | 2.0 | 806 | $1,649 | $2.05 | 1d | 1 | 0.59mi |
| 29103 Barjode Rd Willowick, OH | 3.0 | 2.0 | 1116 | $1,950 | $1.75 | 19d | 1 | 0.59mi |
| 29210 Green Dr Willowick, OH | 3.0 | 1.0 | 1002 | $1,700 | $1.70 | 1d | 1 | 0.65mi |
| 30446 Euclid Ave Wickliffe, OH | 2.0 | 1.5 | 1044 | $1,350 | $1.29 | 43d | 1 | 0.69mi |
| 30050 Euclid Ave Unit A2 Wickliffe, OH | 2.0 | 1.0 | 1036 | $1,350 | $1.30 | 43d | 1 | 0.89mi |
| 29007 Foxboro St Willowick, OH | 4.0 | 2.0 | 976 | $1,550 | $1.59 | 17d | 1 | 1.07mi |
| 33201 Vine St Willowick, OH | 1.0–2.0 | 1.0 | 621 | $1,200 | $1.93 | 20d | 1 | 1.29mi |
| 360 E 326th St Willowick, OH | 2.0 | 2.0 | 1053 | $1,447 | $1.37 | 2d | 1 | 1.33mi |
Listing history 4 events
-
2026-04-20status Pending
-
2026-04-15price $165,000
-
2026-04-06$169,900 Active
-
2018-07-12soldstatus $111,000
ⓘ Source: listings_history table (triggers on properties + properties_extension) + one-shot
backfill from property_details.listing_events for pre-trigger history.
Tax reassessment forecast OH · Partial reset (capped growth)
- Current annual tax
- $3,422 · $285/mo
- Projected year-2 tax
- $3,422 · $285/mo
- Expected delta
- $0/yr ($0/mo · 0.0%)
ⓘ Screening estimate from a state-policy table — verify with the county assessor before closing.
Climate risk First Street
- Flood 1/10 Low FEMA zone X (unshaded) · 0% chance over 30 yrs
- Wildfire 1/10 Low
- Heat 3/10 Moderate 7 d/yr ≥95°F today · 18 d/yr by 30 yrs out
- Wind 1/10 Low
- Air quality 3/10 Moderate 3 unhealthy d/yr today · 4 by 30 yrs out
Nearby sold comps map
Loading sold comps map…
Walkable amenities ~0.75 mi
Loading nearby amenities…
Taxation est. · year 1
- Rental income
- $20,315
- − Mortgage interest
- −$9,243
- − Property taxes
- −$3,422
- − Insurance
- −$825
- − Repairs & maintenance
- −$1,625
- − Management
- −$1,625
- − Depreciation
- −$4,800
- Taxable loss
- −$1,224
- Est. tax savings @ 24.0%
- +$294
- After-tax cash flow
- $1,713/yr
For passive investors: Depreciation is non-cash, so a rental often shows a tax loss while cash-flowing — sheltering income. Rental losses are passive: they offset passive income freely, and up to $25,000/yr can offset ordinary (W-2) income if you actively participate and your MAGI is under $100k (phasing out to $0 by $150k); unused losses carry forward. On sale, claimed depreciation is recaptured at up to 25%, and gains may owe capital-gains tax (a 1031 exchange can defer both). Figures are a year-1 estimate at your 24.0% rate — not tax advice; consult a CPA.
Schools (NCES district)
- District
- Willoughby-Eastlake City
- NCES district ID
- 3904510
- Math proficiency
- 42% ▼ -21.00%
- Reading proficiency
- 58% ▼ -11.00%
- Median HH income
- $52,500
- Composite
- 42.96/100
- National rank
- #3110
- State rank
- #434 of 656 in OH
Livability — Willowick
- Score
- 84/100
- State rank
- #50
- US rank
- #706
Category grades
Schools grade is shown separately in the Schools card above.
Census & demographics
- Census place
- Willowick, OH
- County
- Lake County · 204,927 people
- Metro
- Cleveland-Elyria, OH
- Population (ZIP)
- 32,363
- Household income
- $71,543
- Rent vs Own
- Severe rent burden
- 590.0
Population outlook (Lake County) Hauer SSP2
- Today (2025)
- 230,022 people
- By 2030
- 228,151 · -0.8%
- By 2040
- 221,018 · -3.9%
- By 2050
- 212,754 · -7.5%
- By 2075
- 200,309 · -12.9%
- By 2100
- 183,315 · -20.3%
Race, ethnicity, and origin ACS 2023
- Neighborhood character
- Predominantly White (87%)
- Race & ethnicity
- White 87% Black 5% Two or more races 5% Hispanic / Latino 3%
- Common ancestry
- Romanian 8% Slovak 2% Lithuanian 2%
- Foreign-born
- 3% · Canada
- Languages at home
- 94% English-only · Russian/Polish/Slavic 3% Spanish 1% German/W. Germanic 1%
Political lean MEDSL · Lake
- 2024 margin
- R (+14.3) · D 42.4% · R 56.7%
- 2008→2024 swing
- -15.2pp toward R · 2008: 0.8pp · 2024: -14.3pp
- All cycles
- 2024: R+14.3 2020: R+13.6 2016: R+15.6 2012: R+1.7 2008: D+0.8
Not yet ingested
- Civics
- —
Market trends
- HPI YoY
- ▼ -187.78%
- Current HPI
- 171.8121
- Rent YoY
- ▲ 4.81%
- Metro
- Cleveland-Elyria, OH
- State GDP YoY
- ▲ 1.98%
- F500 in state
- 48
Industry mix (Fortune 500 HQ in OH)
| Industry | F500 HQs | Revenue |
|---|---|---|
| Insurance | 3 | $145B |
|
||
| Industrial Machinery | 3 | $49B |
|
||
| Financial Services | 3 | $24B |
|
||
| Consumer Goods | 2 | $93B |
|
||
| Aerospace / Defense | 2 | $47B |
|
||
| Utilities | 2 | $33B |
|
||
Price history
+48.6% since first listed4 events — show timeline
- 2026-04-20 Pending — MLSNOW
- 2026-04-15 Price Changed $165,000 MLSNOW
- 2026-04-06 Listed $169,900 MLSNOW
- 2018-07-12 Sold (Public Records) $111,000 Public Records
Property tax history
+4.8%/yrLatest (2025): $3,422 · -2.1% YoY. Source: county tax records.
Cash-flow waterfall
monthlySold comps — $/sqft
last 12 mo · ≤1 miLoading sold comps…