 Multi-family
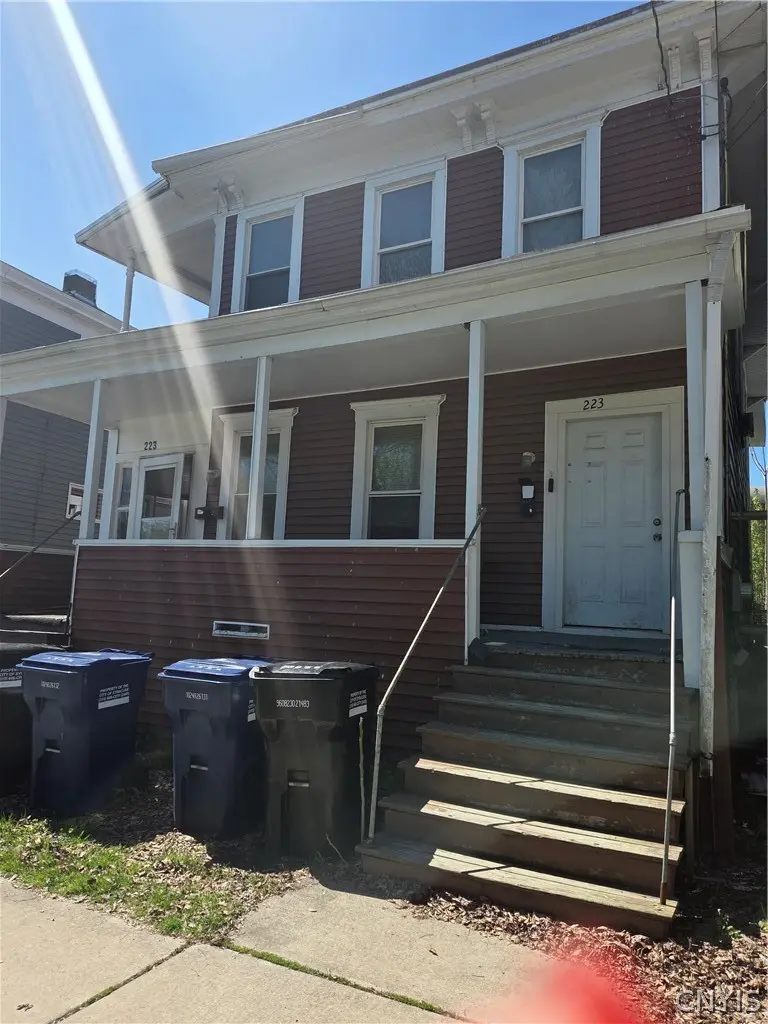
223 Lakeview Ave · Syracuse, NY
Flood risk 1/10 · Minimal
- FEMA flood zone
- X (unshaded)
- Chance of flooding over 30 yrs
- 0.0%
- Est. flood insurance / yr
- $473 – $860
Fire risk 1/10 · Minimal
- Est. fire insurance / yr
- $691 – $1,283
Heat risk 3/10 · Minor
- Hot days now (above 95°F)
- 7 days/yr
- Hot days in 30 yrs
- 16 days/yr
Wind risk 1/10 · Minimal
- Chance of severe wind over 30 yrs
- —
Air-quality risk 2/10 · Minimal
- Unhealthy air days now
- 0 days/yr
- Unhealthy air days in 30 yrs
- 1 days/yr
Risk factors via First Street. Map © Google.
Why this score? — see what drove the A grade
The composite is a weighted blend of 9 inputs, each scored 0–100. Each bar is that input's sub-score; the figure is the points it added to the 100-point composite (weight × sub-score).
- Cash flow +30.0/30.0
- ARV discount +15.0/15.0
- DSCR +10.0/10.0
- Appreciation +10.0/10.0
- 1% rule +8.0/10.0
- Rent growth +4.6/5.0
- Livability +3.9/5.0
- Condition / age +2.5/5.0
- Schools +1.8/10.0
$149,900
🖨 Deal sheet 📄 Offer letter ✓ Due diligence
Multi-family units
County records classify this as Multi-Family (2-4 Unit). Listing-text estimate: 1 unit. estimate disagrees with records
Listing remarks
Great Investment! This fully rented multi-family has updated windows, furnace, water heater and siding. It also offers a fully fenced in, large, back yard and a nice front porch! Close to bus line, local stores and restaurants and all other amenities!
Key facts
- Updated siding
- Updated windows
- Front porch
Tags
Property features AI
Finance
- Financial info: Two-unit building with separate gas and electric meters for each unit; Both units currently rented month-to-month at $875 each; Owner pays hot water and trash collection; Operating expenses include maintenance and water/sewer
Exterior
- Parking: Gravel and paved parking with two or more spaces
- Utilities: Public water connected; Sewer connected
- Home design: Two-story multi-family building; Resale property
- Construction: Vinyl siding
- Exterior features: Covered porch; Porch; Rectangular residential lot; Near public transit; City street frontage
Interior
- Kitchen: Each unit includes an oven/range and refrigerator; Eat-in kitchen and dining area connected to living room in each unit
- Bedrooms: Two 3-bedroom units (each unit has 3 bedrooms)
- Flooring: Carpet; Laminate; Vinyl; Varied flooring
- Bathrooms: Each unit has 1 full bathroom (2 full bathrooms total)
- Heating & cooling: Gas forced-air heating
- Interior features: Full basement
- Laundry & utility: Gas water heater
Neighborhood map
What this means for you Summary
Snapshot
- This is a 4-bed/2.0-bath multifamily listed at $150k.
Deal economics
- At list price, monthly cash flow is $590 ($7k/yr) — positive.
- The deal already cash-flows at list — no discount required.
- Meets the 1% rule at list price ($2k rent vs $150k).
- Recommended offer: $145k (3.0% below list) — sets the bar for market timing.
- Cap rate 11.0% vs local median 8.2% in Syracuse — top-decile yield for the area; either an underpriced asset or a hidden risk that comps aren't pricing in. Stress-test before assuming the spread holds.
Location & tenants
- Location reads 77/100 on livability (#187 in NY, #2,869 nationally) — a middle-class / working-renter tenant base. Strengths: amenities A+, commute A+, cost of living A+; Watch: schools D+, crime F, employment D-.
- Syracuse City School District (urban): math 18% / reading 26% proficiency, ranked #590 of 590 in NY (top 100%) — low school quality limits family demand, transient renter base, plan for 1-2y turnover; 74% free/reduced lunch — lower-income household profile, screen leases tightly.
- Market conditions: Rents rising fast (+8.2%/yr); 119 active listings in the ZIP; 9 comparable units currently listed for rent nearby; rentals lingering (median 44d on market — plan ~5-8 weeks vacancy on turnover, expect pricing pressure); 56% of comp listings sitting > 30 days — soft ceiling on asking rent; 616 units permitted in Onondaga County in 2024 (256 in 5+ unit buildings).
- At $1,944/mo this rent would consume 51% of the median local household income ($45k/yr) (locally 2073% of renters already pay >50% of income on rent) — very limited rent-growth headroom before tenants either downsize or default.
Forward outlook
- In year one you build about $16k of equity ($1k loan paydown + $15k appreciation (10.0% local appreciation)).
- Onondaga County population projected to shrink 9% by 2050 — rents likely to lag national; underwrite the cash flow, not the appreciation.
- At projected returns (10.0% appreciation + 8.0% rent growth), your $42k cash investment doubles in ~2 years — after that, you're playing with house money.
- By year 3, paydown + projected appreciation supports a ~$41k cash-out refi (75% LTV) — recoverable capital for the next deal without selling this one.
Negotiation context
- It's been on market 32 days — a 3% lower offer ($145k) is reasonable based on typical stale-listing flexibility.
- 4 sale attempts with the ask held roughly flat each time — persistent listings suggest the price (not the market) is what's stuck; bring a comps-based counter.
Risks & watch-outs
- Watch-outs: built in 1910 — expect roof / HVAC / electrical / plumbing capex.
Questions for the listing agent
- It's been on market 32 days. Have you received any prior offers? Is the seller open to a 3% concession, seller financing, or rate buy-down credit?
- Built in 1910 — when were the roof, HVAC, electrical panel, plumbing, and water heater last replaced?
- Is there a deadline driving the sale (1031 exchange, divorce, estate, relocation)? That informs how much negotiation room exists.
- Schools are D-rated, which usually means shorter tenancies and higher turnover. Who's the typical renter profile here, and what's been the actual vacancy rate?
- Crime grade is F in this area — have there been break-ins, vandalism, or insurance claims at this property in the last 3 years? What carrier currently insures it and at what premium?
- What's the average days-on-market for RENTAL listings here right now (not sales)? A rising rental-DOM trend means longer vacancies and softer asking-rent achievability than the comps imply.
- What's the recent tenant-quality profile in this submarket — average credit score on applications, eviction rate, late-payment / NSF rate, and stable-employment percentage? A property-management company in the area should have these aggregated.
- How much new apartment / multifamily construction is in the pipeline within 1–3 miles? Heavy new supply (>2% of stock underway) typically softens rents 12–24 months out; light construction supports rent growth.
Investment metrics
- 1% rule
- 1.30% ✓
- Cap rate
- 11.02%
- Cash-on-cash
- 16.88%
- DSCR
- 1.75
- GRM
- 6.4
CMA / ARV
- ARV (median comp)
- $192,385
- List price
- $149,900
- Delta
- -22.08%
- Verdict
- UNDERPRICED
- Comps
- 20 within 1.0 mi
Show comp detail 11 sales within ~0.75 mi
| Address | Dist | Beds/Ba | Sqft | Sold | Price | $/sf | Match |
|---|---|---|---|---|---|---|---|
| 616 Richmond Ave | 0.09mi | 4/2.0 | 2,024 (+3%) | 14mo | $84,000 | $42 | 80 |
| 183 Lakeview Ave | 0.12mi | 4/2.0 | 2,044 (+4%) | 15mo | $56,027 | $27 | 75 |
| 207 Apple St | 0.16mi | 4/2.0 | 2,056 (+4%) | 20mo | $98,000 | $48 | 69 |
| 131 Lakeview Ave | 0.20mi | 5/2.0 (+1) | 2,068 (+5%) | 11mo | $100,000 | $48 | 68 |
| 199 Lakeview Ave | 0.07mi | 5/2.0 (+1) | 2,034 (+3%) | 23mo | $55,000 | $27 | 67 |
| 309 Ulster Ave | 0.30mi | 4/2.0 | 2,194 (+12%) | 1mo | $276,000 | $126 | 66 |
| 322 Liberty St | 0.30mi | 4/2.0 | 1,871 (-5%) | 18mo | $165,000 | $88 | 63 |
| 130 Lakeview Ave | 0.19mi | 4/2.0 | 2,244 (+14%) | 21mo | $45,000 | $20 | 50 |
| 111-13 Cody Ave | 0.62mi | 4/2.0 | 2,184 (+11%) | 10mo | $262,000 | $120 | 44 |
| 122 Bryant Ave | 0.25mi | 5/2.0 (+1) | 2,240 (+14%) | 23mo | $275,000 | $123 | 41 |
| 635 Hamilton St | 0.65mi | 4/2.0 | 1,776 (-10%) | 22mo | $245,000 | $138 | 36 |
Match score weights: distance 35% · size 25% · config 20% · recency 20%. Top-matched comps best support the ARV.
Projected returns pro-forma
10.0% appreciation · 8.0% rent growth · sell at horizon
- IRR
- 39.2%
- Equity multiple
- 4.09×
- Total profit
- $129,493
- Equity at exit
- $135,042
- IRR
- 35.6%
- Equity multiple
- 9.99×
- Total profit
- $377,158
- Equity at exit
- $291,223
Cash invested: $41,972 (down + closing). Projections, not guarantees.
Landlord ↔ Tenant lean methodology
- Overall (STATE)
- 15 Strongly Tenant-Friendly
- State New York
- 15 Strongly Tenant-Friendly · D+10
- County
- — inherits STATE
- City
- — inherits STATE
ZIP-level market 13204
- Home prices YoY
- 31.6%
- Rents YoY
- 8.2%
- Active inventory
- 119
- Price-to-rent
- 6.4×
Monthly cashflow live
- Estimated rent
- $1,944 high interval (Pro) →
- Mortgage (P&I)
- −$786
- Tax from tax record
- −$97 /mo · $1,160/yr
- Insurance
- −$62
- HOA
- −$0
- Vacancy / Maint / Mgmt
- −$408
- Net cashflow
- $590
Break-even live
UW: 25.0% down · 7.5% · 30yr · 1.5% tax · 5.0% vac · 8.0% maint · 8.0% mgmt
Financing live
Cash to close
- Down payment
- $37,475
- Closing costs
- $4,497
- Reserves months
- —
- Total cash needed
- —
Loan-product check · same deal, 3 products live
Conventional
25% down · 7.5% · 30yr
- Down + closing
- —
- Monthly P&I
- —
- Monthly cashflow
- —
- DSCR
- —
- Eligible?
- —
Personal DTI + credit; lowest rate.
DSCR
20% down · 8.5% · 30yr
- Down + closing
- —
- Monthly P&I
- —
- Monthly cashflow
- —
- DSCR
- —
- Eligible?
- —
No personal income docs; deal must DSCR.
Hard money
10% down · 12.0% · 12mo
- Down + closing
- —
- Monthly P&I
- —
- Monthly cashflow
- —
- DSCR
- —
- Eligible?
- —
Short-term bridge; refi at stabilization.
Rent comps 9 comps
| Address | Beds | Baths | Sqft | Rent | $/sqft | DOM | Units | Dist |
|---|---|---|---|---|---|---|---|---|
| 121 Whittier Ave Syracuse, NY | 4.0 | 1.0 | 1400 | $600 | $0.43 | 43d | 1 | 0.33mi |
| 349 Bryant Ave Syracuse, NY | 3.0 | 1.5 | 1500 | $2,300 | $1.53 | 13d | 1 | 0.49mi |
| 214 Rowland St Syracuse, NY | 4.0 | 1.0 | 2092 | $1,800 | $0.86 | 13d | 1 | 1.08mi |
| 104 Kincaid Ave Syracuse, NY | 4.0 | 1.0 | 1910 | $1,600 | $0.84 | 13d | 1 | 1.13mi |
| 318 Kellogg St Unit 2 Syracuse, NY | 3.0 | 1.0 | 1523 | $1,675 | $1.10 | 43d | 1 | 1.14mi |
| 318 Kellogg St Unit 1 Syracuse, NY | 3.0 | 1.0 | 1523 | $1,650 | $1.08 | 43d | 1 | 1.14mi |
| 326 Holland St Unit 1 Syracuse, NY | 3.0 | 1.0 | 2100 | $1,825 | $0.87 | 43d | 1 | 1.20mi |
| 1110 Bellevue Ave Syracuse, NY | 3.0 | 1.0 | 1449 | $1,500 | $1.04 | 43d | 1 | 1.27mi |
| 315 Grant Ave #17 Syracuse, NY | 3.0 | 2.0 | 1477 | $1,275 | $0.86 | 13d | 1 | 1.34mi |
Listing history 11 events
-
2026-05-30status $149,900 Pending 32 DOM
-
2026-04-27$149,900 Active 251-char remark
-
2025-11-11historical
-
2025-11-06status Pending
-
2025-10-09price $110,000
-
2025-10-07status Active
-
2025-09-26status Pending
-
2025-09-16status Active
-
2025-09-16price $174,900
-
2025-09-11historical
-
2025-07-12$179,900 Active
ⓘ Source: listings_history table (triggers on properties + properties_extension) + one-shot
backfill from property_details.listing_events for pre-trigger history.
Tax reassessment forecast NY · Partial reset (capped growth)
- Current annual tax
- $1,160 · $97/mo
- Projected year-2 tax
- $1,846 · $154/mo
- Expected delta
- +$687/yr (+$57/mo · 59.2%)
ⓘ Screening estimate from a state-policy table — verify with the county assessor before closing.
Climate risk First Street
- Flood 1/10 Low FEMA zone X (unshaded) · 0% chance over 30 yrs
- Wildfire 1/10 Low
- Heat 3/10 Moderate 7 d/yr ≥95°F today · 16 d/yr by 30 yrs out
- Wind 1/10 Low
- Air quality 2/10 Low 0 unhealthy d/yr today · 1 by 30 yrs out
Nearby sold comps map
Loading sold comps map…
Walkable amenities ~0.75 mi
Loading nearby amenities…
Taxation est. · year 1
- Rental income
- $23,326
- − Mortgage interest
- −$8,397
- − Property taxes
- −$1,160
- − Insurance
- −$750
- − Repairs & maintenance
- −$1,866
- − Management
- −$1,866
- − Depreciation
- −$4,361
- Taxable income
- $4,928
- Est. tax owed @ 24.0%
- −$1,183
- After-tax cash flow
- $5,903/yr
For passive investors: Depreciation is non-cash, so a rental often shows a tax loss while cash-flowing — sheltering income. Rental losses are passive: they offset passive income freely, and up to $25,000/yr can offset ordinary (W-2) income if you actively participate and your MAGI is under $100k (phasing out to $0 by $150k); unused losses carry forward. On sale, claimed depreciation is recaptured at up to 25%, and gains may owe capital-gains tax (a 1031 exchange can defer both). Figures are a year-1 estimate at your 24.0% rate — not tax advice; consult a CPA.
Schools (NCES district)
- District
- Syracuse City School District
- NCES district ID
- 3628590
- Math proficiency
- 18% ▼ -5.00%
- Reading proficiency
- 26% ▬ 0.00%
- Median HH income
- $32,097
- Composite
- 17.83/100
- National rank
- #9007
- State rank
- #590 of 590 in NY
Livability — Syracuse
- Score
- 77/100
- State rank
- #187
- US rank
- #2869
Category grades
Schools grade is shown separately in the Schools card above.
Census & demographics
- Census place
- Syracuse, NY
- County
- Onondaga County · 247,257 people
- City population
- 152,627
- Metro
- Syracuse, NY
- Population (ZIP)
- 19,440
- Household income
- $45,351
- Rent vs Own
- Severe rent burden
- 2073.0
Population outlook (Onondaga County) Hauer SSP2
- Today (2025)
- 467,894 people
- By 2030
- 463,381 · -1.0%
- By 2040
- 447,697 · -4.3%
- By 2050
- 426,399 · -8.9%
- By 2075
- 373,661 · -20.1%
- By 2100
- 307,967 · -34.2%
Race, ethnicity, and origin ACS 2023
- Neighborhood character
- Diverse neighborhood (Simpson 0.68)
- Race & ethnicity
- White 47% Black 26% Hispanic / Latino 17% Two or more races 13% Native American 1%
- Hispanic origin (detail)
- Puerto Rican 12% Cuban 2% Dominican 1%
- Common ancestry
- Romanian 5% Lithuanian 2% Subsaharan African 2%
- Foreign-born
- 7% · Canada, Jamaica
- Languages at home
- 83% English-only · Spanish 11% Russian/Polish/Slavic 3% Arabic 1%
Political lean MEDSL · Onondaga
- 2024 margin
- D (+17.3) · D 58.6% · R 41.4%
- 2008→2024 swing
- -3.0pp toward R · 2008: 20.3pp · 2024: 17.3pp
- All cycles
- 2024: D+17.3 2020: D+20.6 2016: D+12.8 2012: D+21.1 2008: D+20.3
Not yet ingested
- Civics
- —
Market trends
- HPI YoY
- ▲ 100.14%
- Current HPI
- 416.7272
- Rent YoY
- ▲ 8.24%
- Metro
- Syracuse, NY
- State GDP YoY
- ▲ 2.60%
- F500 in state
- 92
Industry mix (Fortune 500 HQ in NY)
| Industry | F500 HQs | Revenue |
|---|---|---|
| Financial Services | 10 | $950B |
|
||
| Consumer Goods | 9 | $162B |
|
||
| Insurance | 4 | $225B |
|
||
| Telecommunications | 2 | $144B |
|
||
| Pharmaceuticals | 2 | $112B |
|
||
| Media / Entertainment | 2 | $69B |
|
||
Price history
-16.7% since first listed11 events — show timeline
- 2026-05-29 Pending — CNYIS
- 2026-04-27 Listed $149,900 CNYIS
- 2025-11-11 Listing Removed — CNYIS
- 2025-11-06 Pending — CNYIS
- 2025-10-09 Price Changed $110,000 CNYIS
- 2025-10-07 Relisted — CNYIS
- 2025-09-26 Pending — CNYIS
- 2025-09-16 Relisted — CNYIS
- 2025-09-16 Price Changed $174,900 CNYIS
- 2025-09-11 Listing Removed — CNYIS
- 2025-07-12 Listed $179,900 CNYIS
Property tax history
+0.8%/yrLatest (2025): $1,160 · +1.3% YoY. Source: county tax records.
Cash-flow waterfall
monthlySold comps — $/sqft
last 12 mo · ≤1 miLoading sold comps…