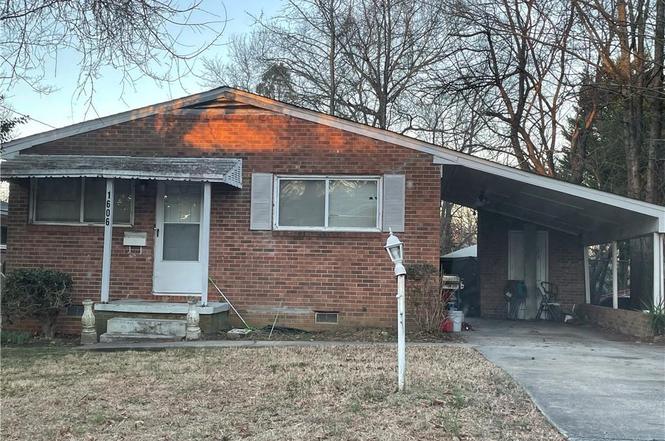
1606 Lincoln St · Greensboro, NC
Flood risk 1/10 · Minimal
- FEMA flood zone
- X (unshaded)
- Chance of flooding over 30 yrs
- 0.0%
- Est. flood insurance / yr
- $507 – $1,088
Fire risk 1/10 · Minimal
- Est. fire insurance / yr
- $906 – $1,684
Heat risk 6/10 · Moderate
- Hot days now (above 103°F)
- 7 days/yr
- Hot days in 30 yrs
- 17 days/yr
Wind risk 4/10 · Minor
- Chance of severe wind over 30 yrs
- 16.0%
Air-quality risk 2/10 · Minimal
- Unhealthy air days now
- 1 days/yr
- Unhealthy air days in 30 yrs
- 2 days/yr
Risk factors via First Street. Map © Google.
Why this score? — see what drove the C- grade
The composite is a weighted blend of 9 inputs, each scored 0–100. Each bar is that input's sub-score; the figure is the points it added to the 100-point composite (weight × sub-score).
- Cash flow +15.2/30.0
- ARV discount +15.0/15.0
- DSCR +4.7/10.0
- Livability +4.0/5.0
- Schools +3.6/10.0
- 1% rule +3.3/10.0
- Rent growth +2.9/5.0
- Condition / age +2.5/5.0
- Appreciation +0.0/10.0
$157,500
🖨 Deal sheet (PDF) 📄 Offer letter ✓ Due diligence
Listing remarks
Charming and thoughtfully updated, 1606 Lincoln St in Greensboro offers classic curb appeal with modern comforts. This inviting home features a welcoming front porch, bright living spaces with abundant natural light, and original details—like hardwood floors and high ceilings—complemented by tasteful contemporary finishes. The kitchen has been refreshed for today’s lifestyle with quality countertops, ample cabinet storage, and room for casual dining. Well-proportioned bedrooms and a renovated bath provide comfortable daily living, while a flexible bonus room is ideal for a home office, playroom, or guest space. Outside, the private, landscaped backyard and patio create a p
Key facts
- Front porch
- Renovated bath
- High ceilings
Tags
Property features AI
Finance
- Other: Listed by Allen Real Estate Group, LLC
- HOA & community: No homeowners association; Subdivision: Lincoln Heights
Exterior
- Parking: Attached carport (1 covered space)
- Utilities: Public water; Public sewer; Electric water heater; Electric power
- Home design: Residential stick/site-built house; One story; Built in 1958; Existing structure
- Construction: Brick construction
- Exterior features: Fenced yard; Public maintained road frontage; Lot approximately 6,970 sq ft
Interior
- Kitchen: Electric water heater
- Flooring: Wood
- Bathrooms: 1 full bathroom
- Heating & cooling: Forced air electric heating; Central air; Window unit(s) for cooling
- Interior features: Wood flooring; Crawl space foundation
Neighborhood map
What this means for you Summary
Snapshot
- This is a 2-bed/1.0-bath single-family listed at $158k.
Deal economics
- At list price, monthly cash flow is $55 ($665/yr) — positive.
- The deal already cash-flows at list — no discount required.
- To meet the 1% rule (rent ≥ 1% of price), the offer needs to be $131k (16.9% below list).
- Recommended offer: $131k (16.9% below list) — sets the bar for 1% rule.
- Cap rate 6.7% vs local median 3.7% in Greensboro — top-decile yield for the area; either an underpriced asset or a hidden risk that comps aren't pricing in. Stress-test before assuming the spread holds.
Location & tenants
- Location reads 81/100 on livability (#12 in NC, #1,335 nationally) — a professional / high-income tenant draw. Strengths: amenities A+, commute A+, cost of living A+; Watch: employment D, crime F.
- Guilford County Schools (urban): math 39% / reading 45% proficiency, ranked #99 of 178 in NC (top 56%) — families likely to look elsewhere, expect single-tenant / working-renter base with shorter leases.
- Zoned schools: Bluford Elementary (math 27% / reading 27%, grade F, #1,033 of 1,410 statewide, top 76%, 263 students, 97% FRL); Otis L Hairston Sr Middle (math 13% / reading 22%, grade F, #445 of 475 statewide, top 94%, 631 students, 100% FRL); James B Dudley High (math 34% / reading 40%, grade F, #414 of 535 statewide, top 79%, 1,491 students, 100% FRL) — zoned schools average 99% FRL vs 52% district-wide (46 pts higher); higher-poverty schools than district average — tighter screening recommended.
- Zoned-school proficiency averages 27% at this address vs 42% district-wide (-15 pts) — the specific schools serving this property underperform the Guilford County Schools average; the district grade overstates school quality for this exact location.
- Market conditions: Rents rising (+1.8%/yr); 130 active listings in the ZIP; 17 comparable units currently listed for rent nearby; rentals at typical pace (median 26d on market — plan ~3-4 weeks tenant-placement turnaround); 3,843 units permitted in Guilford County in 2024 (2,397 in 5+ unit buildings).
- This rent runs 33% of the median local income ($48k/yr) — at the standard rent-burdened threshold; future hikes will face affordability resistance.
Forward outlook
- Local home prices are declining (-3.0%/yr); year-one equity from $1k of loan paydown is wiped out by about $5k of value loss. Plan a longer hold.
- Guilford County population projected at +26% by 2050 — long-run rental-demand tailwind backs the buy-and-hold thesis.
Negotiation context
- It's been on market 158 days — a 12% lower offer ($139k) is reasonable based on typical stale-listing flexibility.
- Current owner paid $118k; 33% above their basis — modest negotiation headroom, anchor on the comps not their cost.
Risks & watch-outs
- Watch-outs: built in 1958 — expect roof / HVAC / electrical / plumbing capex.
- Climate carrying-cost: extreme-heat days projected 7→17/yr by 2055 (HVAC capex compounding) — expect insurance premiums to compound above CPI over the hold.
Questions for the listing agent
- It's been on market 158 days. Have you received any prior offers? Is the seller open to a 17% concession, seller financing, or rate buy-down credit?
- Built in 1958 — when were the roof, HVAC, electrical panel, plumbing, and water heater last replaced?
- Why hasn't it sold? Are there any deal-killer items the seller is aware of (foundation, flood, title, zoning, code violations)?
- Is there a deadline driving the sale (1031 exchange, divorce, estate, relocation)? That informs how much negotiation room exists.
- Crime grade is F in this area — have there been break-ins, vandalism, or insurance claims at this property in the last 3 years? What carrier currently insures it and at what premium?
- What's the average days-on-market for RENTAL listings here right now (not sales)? A rising rental-DOM trend means longer vacancies and softer asking-rent achievability than the comps imply.
- What's the recent tenant-quality profile in this submarket — average credit score on applications, eviction rate, late-payment / NSF rate, and stable-employment percentage? A property-management company in the area should have these aggregated.
- How much new for-sale + rental construction is in the pipeline within 1–3 miles? Heavy new supply typically softens prices + rents 12–24 months out; constrained supply supports both.
Investment metrics
- 1% rule
- 0.83% ✗
- Cap rate
- 6.71%
- Cash-on-cash
- 1.51%
- DSCR
- 1.07
- GRM
- 10.0
CMA / ARV
- ARV (on-the-fly)
- $200,900
- Comps found
- 12
Show comp detail 12 sales within ~0.75 mi
| Address | Dist | Beds/Ba | Sqft | Sold | Price | $/sf | Match |
|---|---|---|---|---|---|---|---|
| 1616 Dunbar St | 0.14mi | 3/1.0 (+1) | 1,089 (+6%) | 3mo | $188,000 | $173 | 76 |
| 1408 Willow Rd | 0.29mi | 3/2.0 (+1) | 932 (-9%) | 2mo | $200,000 | $215 | 61 |
| 1118 Duke St | 0.50mi | 3/2.0 (+1) | 1,064 (+4%) | 6mo | $85,000 | $80 | 56 |
| 2018 Barksdale Dr | 0.35mi | 3/1.0 (+1) | 940 (-8%) | 11mo | $186,000 | $198 | 56 |
| 1807 Carlton Ave | 0.15mi | 3/2.0 (+1) | 1,159 (+13%) | 9mo | $230,000 | $198 | 55 |
| 1404 Ardmore Dr | 0.64mi | 3/2.0 (+1) | 1,094 (+7%) | 1mo | $225,000 | $206 | 49 |
| 1402 Ardmore Dr | 0.64mi | 3/2.0 (+1) | 1,087 (+6%) | 2mo | $225,000 | $207 | 49 |
| 1611 Willow Rd | 0.23mi | 3/5.5 (+1) | 950 (-7%) | 10mo | $138,000 | $145 | 49 |
| 1013 Duke St | 0.62mi | 3/1.0 (+1) | 962 (-6%) | 10mo | $170,000 | $177 | 47 |
| 1109 Benjamin Benson St | 0.64mi | 3/2.0 (+1) | 1,134 (+11%) | 2mo | $212,500 | $187 | 42 |
| 1711 Eastwood Ave | 0.57mi | 3/1.0 (+1) | 918 (-10%) | 11mo | $180,000 | $196 | 42 |
| 7 Pear Tree Ct | 0.68mi | 3/2.5 (+1) | 1,153 (+12%) | 2mo | $209,900 | $182 | 35 |
Match score weights: distance 35% · size 25% · config 20% · recency 20%. Top-matched comps best support the ARV.
Projected returns pro-forma
-3.0% appreciation · 1.78% rent growth · sell at horizon
- IRR
- -15.2%
- Equity multiple
- 0.46×
- Total profit
- $-23,629
- Equity at exit
- $23,484
- IRR
- -8.7%
- Equity multiple
- 0.49×
- Total profit
- $-22,583
- Equity at exit
- $13,618
Cash invested: $44,100 (down + closing). Projections, not guarantees.
Landlord ↔ Tenant lean methodology
- Overall (STATE)
- 85 Strongly Landlord-Friendly
- State North Carolina
- 85 Strongly Landlord-Friendly · R+3
- County
- — inherits STATE
- City
- — inherits STATE
ZIP-level market 27401
- Home prices YoY
- -28.9%
- Rents YoY
- 1.8%
- Active inventory
- 130
- Price-to-rent
- 10.0×
Monthly cashflow live
- Estimated rent
- $1,309 high interval (Pro) →
- Mortgage (P&I)
- −$826
- Tax from tax record
- −$87 /mo · $1,043/yr
- Insurance
- −$66
- HOA
- −$0
- Vacancy / Maint / Mgmt
- −$275
- Net cashflow
- $55
Break-even live
Sensitivity live
| Price | -10% $145 | -5% $100 | +0% $55 | +5% $11 | +10% $-34 |
|---|---|---|---|---|---|
| Rent | -10% $-48 | -5% $4 | +0% $55 | +5% $107 | +10% $159 |
| Rate | -1.0pp $135 | -0.5pp $95 | base $55 | +0.5pp $15 | +1.0pp $-27 |
UW: 25.0% down · 7.5% · 30yr · 1.5% tax · 5.0% vac · 8.0% maint · 8.0% mgmt
Financing live
Cash to close
- Down payment
- $39,375
- Closing costs
- $4,725
- Reserves months
- —
- Total cash needed
- —
Loan-product check · same deal, 3 products live
Conventional
25% down · 7.5% · 30yr
- Down + closing
- —
- Monthly P&I
- —
- Monthly cashflow
- —
- DSCR
- —
- Eligible?
- —
Personal DTI + credit; lowest rate.
DSCR
20% down · 8.5% · 30yr
- Down + closing
- —
- Monthly P&I
- —
- Monthly cashflow
- —
- DSCR
- —
- Eligible?
- —
No personal income docs; deal must DSCR.
Hard money
10% down · 12.0% · 12mo
- Down + closing
- —
- Monthly P&I
- —
- Monthly cashflow
- —
- DSCR
- —
- Eligible?
- —
Short-term bridge; refi at stabilization.
Rent comps 17 comps
| Address | Beds | Baths | Sqft | Rent | $/sqft | DOM | Units | Dist |
|---|---|---|---|---|---|---|---|---|
| 1112 Stephens St Greensboro, NC | 2.0 | 1.0 | 744 | $1,250 | $1.68 | 21d | 1 | 0.31mi |
| 2117 Tuscaloosa St Greensboro, NC | 3.0 | 1.0 | 1000 | $1,600 | $1.60 | 25d | 1 | 0.43mi |
| 2007 S Benbow Rd Greensboro, NC | 3.0 | 1.0 | 960 | $1,100 | $1.15 | 25d | 1 | 0.51mi |
| 1610 Eastwood Ave Greensboro, NC | 3.0 | 2.0 | 950 | $1,750 | $1.84 | 25d | 1 | 0.51mi |
| 904 Stephens St Greensboro, NC | 3.0 | 1.0 | 1052 | $1,490 | $1.42 | 16d | 1 | 0.59mi |
| 1404 Ardmore Dr Greensboro, NC | 3.0 | 2.0 | 1094 | $1,625 | $1.49 | 16d | 1 | 0.65mi |
| 909 Tuscaloosa St Greensboro, NC | 2.0 | 1.0 | 840 | $1,195 | $1.42 | 25d | 1 | 0.72mi |
| 1001 E Bragg St Apt B Greensboro, NC | 2.0 | 1.0 | 700 | $925 | $1.32 | 16d | 1 | 0.98mi |
| 710 Reid St Greensboro, NC | 3.0 | 1.0 | 925 | $1,395 | $1.51 | 16d | 1 | 1.04mi |
| 503 S O Henry Blvd Greensboro, NC | 2.0 | 1.0 | 860 | $850 | $0.99 | 25d | 1 | 1.10mi |
| 2001 Spencer St Greensboro, NC | 2.0 | 1.0 | 720 | $1,295 | $1.80 | 25d | 1 | 1.11mi |
| 403 S O Henry Blvd Unit Alexander Homes Greensboro, NC | 2.0 | 1.0 | 860 | $875 | $1.02 | 25d | 1 | 1.13mi |
| 600 Banner Ave Unit 614-B Greensboro, NC | 2.0 | 1.5 | 850 | $850 | $1.00 | 25d | 1 | 1.22mi |
| 405 E Whittington St Greensboro, NC | 2.0 | 1.0 | 700 | $995 | $1.42 | 25d | 1 | 1.24mi |
| 522 Banner Ave Greensboro, NC | 3.0 | 2.0 | 822 | $1,600 | $1.95 | 25d | 1 | 1.25mi |
| 2300 Willow Rd Greensboro, NC | 3.0 | 1.0 | 999 | $1,400 | $1.40 | 25d | 1 | 1.29mi |
| 506 Martin St Greensboro, NC | 3.0 | 2.0 | 1296 | $1,500 | $1.16 | 25d | 1 | 1.39mi |
Listing history 19 events
-
2026-06-22days on market $157,500 Active 158 DOM
-
2026-06-18days on market $157,500 Active 155 DOM
-
2026-06-17days on market $157,500 Active 154 DOM
-
2026-06-16days on market $157,500 Active 153 DOM
-
2026-06-15days on market $157,500 Active 152 DOM
-
2026-06-14pricedays on market $157,500 Active 150 DOM
-
2026-06-10days on market $159,900 Active 147 DOM
-
2026-06-09days on market $159,900 Active 146 DOM
-
2026-06-08days on market $159,900 Active 145 DOM
-
2026-06-07days on market $159,900 Active 144 DOM
-
2026-06-03days on market $159,900 Active 140 DOM
-
2026-06-02days on market $159,900 Active 139 DOM
-
2026-06-01days on market $159,900 Active 138 DOM
-
2026-05-31days on market $159,900 Active 137 DOM
-
2026-05-31days on market $159,900 Active 136 DOM
-
2026-05-05price $159,900
-
2026-02-20price $164,900
-
2026-01-14$169,900 Active
-
2024-12-23soldstatus $118,000
ⓘ Source: listings_history table (triggers on properties + properties_extension) + one-shot
backfill from property_details.listing_events for pre-trigger history.
Tax reassessment forecast NC · Resets to sale price
- Current annual tax
- $1,043 · $87/mo
- Projected year-2 tax
- $1,292 · $108/mo
- Expected delta
- +$248/yr (+$21/mo · 23.8%)
ⓘ Screening estimate from a state-policy table — verify with the county assessor before closing.
Climate risk First Street
- Flood 1/10 Low FEMA zone X (unshaded) · 0% chance over 30 yrs
- Wildfire 1/10 Low
- Heat 6/10 Major 7 d/yr ≥103°F today · 17 d/yr by 30 yrs out
- Wind 4/10 Moderate 16% chance of damaging wind over 30 yrs
- Air quality 2/10 Low 1 unhealthy d/yr today · 2 by 30 yrs out
Nearby sold comps map
Loading sold comps map…
Walkable amenities ~0.75 mi
Loading nearby amenities…
Taxation est. · year 1
- Rental income
- $15,705
- − Mortgage interest
- −$8,822
- − Property taxes
- −$1,043
- − Insurance
- −$788
- − Repairs & maintenance
- −$1,256
- − Management
- −$1,256
- − Depreciation
- −$4,582
- Taxable loss
- −$2,043
- Est. tax savings @ 24.0%
- +$490
- After-tax cash flow
- $1,155/yr
For passive investors: Depreciation is non-cash, so a rental often shows a tax loss while cash-flowing — sheltering income. Rental losses are passive: they offset passive income freely, and up to $25,000/yr can offset ordinary (W-2) income if you actively participate and your MAGI is under $100k (phasing out to $0 by $150k); unused losses carry forward. On sale, claimed depreciation is recaptured at up to 25%, and gains may owe capital-gains tax (a 1031 exchange can defer both). Figures are a year-1 estimate at your 24.0% rate — not tax advice; consult a CPA.
Schools (NCES district)
- District
- Guilford County Schools
- NCES district ID
- 3701920
- Math proficiency
- 39% ▲ 1.00%
- Reading proficiency
- 45% ▲ 1.00%
- Median HH income
- $46,315
- Composite
- 35.78/100
- National rank
- #4842
- State rank
- #99 of 178 in NC
Livability — Greensboro
- Score
- 81/100
- State rank
- #12
- US rank
- #1335
Category grades
Schools grade is shown separately in the Schools card above.
Census & demographics
- Census place
- Greensboro, NC
- County
- Guilford County · 487,190 people
- City population
- 329,421
- Metro
- Greensboro-High Point, NC
- Population (ZIP)
- 21,920
- Household income
- $47,972
- Rent vs Own
- Severe rent burden
- 1138.0
Population outlook (Guilford County) Hauer SSP2
- Today (2025)
- 584,596 people
- By 2030
- 616,851 · +5.5%
- By 2040
- 678,451 · +16.1%
- By 2050
- 734,788 · +25.7%
- By 2075
- 862,985 · +47.6%
- By 2100
- 948,704 · +62.3%
Race, ethnicity, and origin ACS 2023
- Neighborhood character
- Majority Black (62%)
- Race & ethnicity
- Black 62% White 26% Hispanic / Latino 8% Two or more races 4% Asian 1%
- Hispanic origin (detail)
- Mexican 4%
- Common ancestry
- Italian 1% Serbian 1% Slovak 1%
- Foreign-born
- 9% · Canada
- Languages at home
- 88% English-only · Spanish 6% Arabic 2% French/Haitian/Cajun 1%
Political lean MEDSL · Guilford
- 2024 margin
- Strong D (+21.8) · D 60.2% · R 38.4% · Other 1.4%
- 2008→2024 swing
- +3.5pp toward D · 2008: 18.4pp · 2024: 21.8pp
- All cycles
- 2024: D+21.8 2020: D+23.1 2016: D+20.0 2012: D+16.5 2008: D+18.4
Not yet ingested
- Civics
- —
Market trends
- HPI YoY
- ▼ -97.87%
- Current HPI
- 240.5377
- Rent YoY
- ▲ 1.78%
- Metro
- Greensboro-High Point, NC
- State GDP YoY
- ▲ 3.28%
- F500 in state
- 26
Industry mix (Fortune 500 HQ in NC)
| Industry | F500 HQs | Revenue |
|---|---|---|
| Financial Services | 2 | $213B |
|
||
| Retail | 2 | $95B |
|
||
| Industrial Conglomerate | 1 | $38B |
|
||
| Metals / Steel | 1 | $35B |
|
||
| Utilities | 1 | $30B |
|
||
| Industrial Machinery | 1 | $19B |
|
||
Price history
+35.5% since first listed4 events — show timeline
- 2026-05-05 Price Changed $159,900 Triad MLS
- 2026-02-20 Price Changed $164,900 Triad MLS
- 2026-01-14 Listed $169,900 Triad MLS
- 2024-12-23 Sold (Public Records) $118,000 Public Records
Property tax history
+1.6%/yrLatest (2025): $1,043 · -1.0% YoY. Source: county tax records.
Cash-flow waterfall
monthlySold comps — $/sqft
last 12 mo · ≤1 miLoading sold comps…