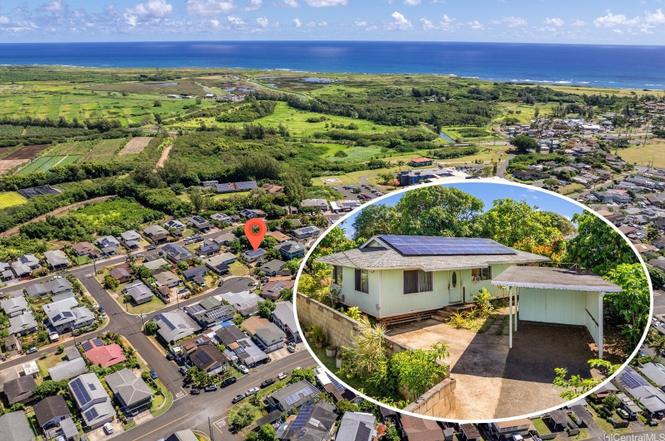
56-099 Kahana St · Kahuku, HI
Flood risk 1/10 · Minimal
- FEMA flood zone
- X (unshaded)
- Chance of flooding over 30 yrs
- 0.0%
- Est. flood insurance / yr
- $507 – $1,088
Fire risk No data
- Est. fire insurance / yr
- —
Heat risk No data
- Hot days now (above threshold)
- —
- Hot days in 30 yrs
- —
Wind risk No data
- Chance of severe wind over 30 yrs
- —
Air-quality risk 1/10 · Minimal
- Unhealthy air days now
- —
- Unhealthy air days in 30 yrs
- —
Risk factors via First Street. Map © Google.
Why this score? — see what drove the D grade
The composite is a weighted blend of 9 inputs, each scored 0–100. Each bar is that input's sub-score; the figure is the points it added to the 100-point composite (weight × sub-score).
- ARV discount +10.0/15.0
- Appreciation +8.7/10.0
- Cash flow +8.2/30.0
- Schools +3.7/10.0
- Livability +3.3/5.0
- 1% rule +2.6/10.0
- Rent growth +2.5/5.0
- Condition / age +2.5/5.0
- DSCR +2.2/10.0
$799,000
🖨 Deal sheet 📄 Offer letter ✓ Due diligence
Listing remarks
Welcome to 56-099 Kahana Street, a charming 3-bedroom, 1.5-bathroom home nestled in the highly desired lower section of Kahuku. Tucked away at the end of a quiet cul-de-sac, this property offers incredible privacy with absolutely no through traffic. Thanks to its prime cul-de-sac positioning, you will enjoy a generous 6,000 sq ft lot—providing a yard that is 33% larger than the typical 4,500 sq ft lots found throughout the area. The yard offers mature, fruit-bearing trees, including three mango and two breadfruit (ulu) trees. Enjoy easy, quick access to Kamehameha Highway, along with the rare benefit of being connected to the city sewer system—a major upgrade from the cesspools
Key facts
- Generous lot
- 6,179 sq ft lot
- 2 garage spots
Tags
Property features AI
Finance
- HOA & community: Association fees include sewer
Exterior
- Parking: Two-car garage; Three total parking spaces
- Utilities: Above-ground utilities; Cable available; Electricity available; High-speed internet available; Public water; Sewer available
- Home design: Single-story; Asphalt shingle roof; Double wall and wood frame construction
- Construction: Built with double wall and wood frame; Asphalt shingle roof
- Exterior features: Cul-de-sac lot; Irregular lot shape; Level topography; Paved road access; Fee simple ownership
Interior
- Flooring: Vinyl
- Bathrooms: 1 full bathroom; 1 half bathroom
- Interior features: Unfurnished; Vinyl flooring; Average condition
Neighborhood map
What this means for you Summary
Snapshot
- This is a 3-bed/1.5-bath single-family listed at $799k.
Deal economics
- At list price, monthly cash flow is $-753 ($-9k/yr) — negative.
- To cash-flow at today's rent, offer at most $690k (13.6% below list).
- To meet the 1% rule (rent ≥ 1% of price), the offer needs to be $604k (24.4% below list).
- Recommended offer: $604k (24.4% below list) — sets the bar for 1% rule.
Location & tenants
- Location reads 66/100 on livability (#40 in HI) — a middle-class / working-renter tenant base. Strengths: crime A+, employment A+, health & safety A+; Watch: schools C-, amenities F, cost of living F.
- Hawaii Department Of Education (suburban): math 32% / reading 50% proficiency, ranked #1 of 1 in HI (top 100%) — families likely to look elsewhere, expect single-tenant / working-renter base with shorter leases.
- Market conditions: 33 active listings in the ZIP; 1,638 units permitted in Honolulu County in 2024 (793 in 5+ unit buildings).
Forward outlook
- In year one you build about $64k of equity ($6k loan paydown + $58k appreciation (7.3% local appreciation)).
- Honolulu County population projected at +17% by 2050 — long-run rental-demand tailwind backs the buy-and-hold thesis.
- By year 2, paydown + projected appreciation supports a ~$102k cash-out refi (75% LTV) — recoverable capital for the next deal without selling this one.
Negotiation context
- Only 1 days on market — expect competitive offers; lowballing is unlikely to land.
- Current owner paid $83k; list at $799k implies a 867% gain — meaningful room to come down on a strong offer.
Questions for the listing agent
- What do current leases actually rent for vs. the listed asking? Can we see a recent rent roll and the last 12 months of T-12 income?
- Is there a deadline driving the sale (1031 exchange, divorce, estate, relocation)? That informs how much negotiation room exists.
- The area grade is low — what's the realistic commute time and amenity access for the typical tenant pool here? Any planned neighborhood developments (good or bad) we should know about?
- What's the average days-on-market for RENTAL listings here right now (not sales)? A rising rental-DOM trend means longer vacancies and softer asking-rent achievability than the comps imply.
- What's the recent tenant-quality profile in this submarket — average credit score on applications, eviction rate, late-payment / NSF rate, and stable-employment percentage? A property-management company in the area should have these aggregated.
- How much new for-sale + rental construction is in the pipeline within 1–3 miles? Heavy new supply typically softens prices + rents 12–24 months out; constrained supply supports both.
Investment metrics
- 1% rule
- 0.76% ✗
- Cap rate
- 5.16%
- Cash-on-cash
- -4.04%
- DSCR
- 0.82
- GRM
- 11.0
CMA / ARV
- ARV (on-the-fly)
- $845,712
- Comps found
- 1
Show comp detail 1 sale within ~0.75 mi
| Address | Dist | Beds/Ba | Sqft | Sold | Price | $/sf | Match |
|---|---|---|---|---|---|---|---|
| 56-357 Pahelehala Loop | 0.15mi | 3/1.0 | 1,020 (+1%) | 16mo | $856,000 | $839 | 76 |
Match score weights: distance 35% · size 25% · config 20% · recency 20%. Top-matched comps best support the ARV.
Projected returns pro-forma
7.31% appreciation · 3.0% rent growth · sell at horizon
- IRR
- 15.3%
- Equity multiple
- 2.10×
- Total profit
- $246,502
- Equity at exit
- $570,009
- IRR
- 15.1%
- Equity multiple
- 4.36×
- Total profit
- $751,297
- Equity at exit
- $1,097,876
Cash invested: $223,720 (down + closing). Projections, not guarantees.
Landlord ↔ Tenant lean methodology
- Overall (STATE)
- 37 Tenant-Leaning
- State Hawaii
- 37 Tenant-Leaning · D+13
- County
- — inherits STATE
- City
- — inherits STATE
ZIP-level market 96731
- Home prices YoY
- 1.5%
- Active inventory
- 33
- Price-to-rent
- 11.0×
Monthly cashflow live
- Estimated rent
- $6,037 medium interval (Pro) →
- Mortgage (P&I)
- −$4,190
- Tax est. 1.5%
- −$999 /mo · $11,985/yr
- Insurance
- −$333
- HOA
- −$0
- Vacancy / Maint / Mgmt
- −$1,268
- Net cashflow
- $-753
Break-even live
UW: 25.0% down · 7.5% · 30yr · 1.5% tax · 5.0% vac · 8.0% maint · 8.0% mgmt
Financing live
Cash to close
- Down payment
- $199,750
- Closing costs
- $23,970
- Reserves months
- —
- Total cash needed
- —
Loan-product check · same deal, 3 products live
Conventional
25% down · 7.5% · 30yr
- Down + closing
- —
- Monthly P&I
- —
- Monthly cashflow
- —
- DSCR
- —
- Eligible?
- —
Personal DTI + credit; lowest rate.
DSCR
20% down · 8.5% · 30yr
- Down + closing
- —
- Monthly P&I
- —
- Monthly cashflow
- —
- DSCR
- —
- Eligible?
- —
No personal income docs; deal must DSCR.
Hard money
10% down · 12.0% · 12mo
- Down + closing
- —
- Monthly P&I
- —
- Monthly cashflow
- —
- DSCR
- —
- Eligible?
- —
Short-term bridge; refi at stabilization.
Listing history 2 events
-
2026-06-17remarks 687-char remark
-
2026-06-17$799,000 Active 1 DOM
ⓘ Source: listings_history table (triggers on properties + properties_extension) + one-shot
backfill from property_details.listing_events for pre-trigger history.
Climate risk First Street
- Flood 1/10 Low FEMA zone X (unshaded) · 0% chance over 30 yrs
- Air quality 1/10 Low
Nearby sold comps map
Loading sold comps map…
Walkable amenities ~0.75 mi
Loading nearby amenities…
Taxation est. · year 1
- Rental income
- $72,441
- − Mortgage interest
- −$44,756
- − Property taxes
- −$11,985
- − Insurance
- −$3,995
- − Repairs & maintenance
- −$5,795
- − Management
- −$5,795
- − Depreciation
- −$23,244
- Taxable loss
- −$23,130
- Est. tax savings @ 24.0%
- +$5,551
- After-tax cash flow
- $-3,481/yr
For passive investors: Depreciation is non-cash, so a rental often shows a tax loss while cash-flowing — sheltering income. Rental losses are passive: they offset passive income freely, and up to $25,000/yr can offset ordinary (W-2) income if you actively participate and your MAGI is under $100k (phasing out to $0 by $150k); unused losses carry forward. On sale, claimed depreciation is recaptured at up to 25%, and gains may owe capital-gains tax (a 1031 exchange can defer both). Figures are a year-1 estimate at your 24.0% rate — not tax advice; consult a CPA.
Schools (NCES district)
- District
- Hawaii Department Of Education
- NCES district ID
- 1500030
- Math proficiency
- 32% ▼ -10.00%
- Reading proficiency
- 50% ▼ -3.00%
- Median HH income
- $69,005
- Composite
- 37.07/100
- National rank
- #4504
- State rank
- #1 of 1 in HI
Livability — Kahuku
- Score
- 66/100
- State rank
- #40
- US rank
- #11410
Category grades
Schools grade is shown separately in the Schools card above.
Census & demographics
- Census place
- Kahuku, HI
- Population (ZIP)
- 2,827
Population outlook (Honolulu County) Hauer SSP2
- Today (2025)
- 1,072,641 people
- By 2030
- 1,110,460 · +3.5%
- By 2040
- 1,181,593 · +10.2%
- By 2050
- 1,257,584 · +17.2%
- By 2075
- 1,501,120 · +39.9%
- By 2100
- 1,764,430 · +64.5%
Race, ethnicity, and origin ACS 2023
- Neighborhood character
- Highly diverse neighborhood (Simpson 0.94)
- Race & ethnicity
- Two or more races 39% Pacific Islander 25% White 20% Asian 14% Hispanic / Latino 7%
- Hispanic origin (detail)
- Puerto Rican 1%
- Common ancestry
- Italian 3% Lithuanian 2% Slovak 1%
- Foreign-born
- 12% · South Korea, Canada, Jamaica
- Languages at home
- 74% English-only · Other Asian/Pacific 11% Spanish 3% Tagalog/Filipino 2%
Political lean MEDSL · Honolulu
- 2024 margin
- Strong D (+21.6) · D 59.9% · R 38.3% · Other 1.8%
- 2008→2024 swing
- -19.4pp toward R · 2008: 41.1pp · 2024: 21.6pp
- All cycles
- 2024: D+21.6 2020: D+26.9 2016: D+29.9 2012: D+39.1 2008: D+41.1
Not yet ingested
- Civics
- —
Market trends
- HPI YoY
- ▲ 7.31%
- Current HPI
- 507.8537
- Rent YoY
- —
- Metro
- —
- State GDP YoY
- —
- F500 in state
- 0
Price history
+867.3% since first listed2 events — show timeline
- 2026-06-16 Listed $799,000 HiCentral MLS
- 1989-03-14 Sold (Public Records) $82,600 Public Records
Property tax history
+5.5%/yrLatest (2022): $1,569 · -2.5% YoY. Source: county tax records.
Cash-flow waterfall
monthlySold comps — $/sqft
last 12 mo · ≤1 miLoading sold comps…