333 E 119th St Unit 4B · New York, NY
Flood risk 7/10 · Major
- FEMA flood zone
- X (shaded)
- Chance of flooding over 30 yrs
- 0.77%
- Est. flood insurance / yr
- $507 – $1,088
Fire risk 1/10 · Minimal
- Est. fire insurance / yr
- $691 – $1,283
Heat risk 7/10 · Major
- Hot days now (above 99°F)
- 7 days/yr
- Hot days in 30 yrs
- 15 days/yr
Wind risk 6/10 · Moderate
- Chance of severe wind over 30 yrs
- 27.0%
Air-quality risk 4/10 · Minor
- Unhealthy air days now
- 5 days/yr
- Unhealthy air days in 30 yrs
- 6 days/yr
Risk factors via First Street. Map © Google.
Why this score? — see what drove the C- grade
The composite is a weighted blend of 9 inputs, each scored 0–100. Each bar is that input's sub-score; the figure is the points it added to the 100-point composite (weight × sub-score).
- Cash flow +14.0/30.0
- ARV discount +7.5/15.0
- Appreciation +6.6/10.0
- Schools +5.0/10.0
- DSCR +4.2/10.0
- 1% rule +3.9/10.0
- Rent growth +3.9/5.0
- Livability +3.8/5.0
- Condition / age +2.5/5.0
$599,999
🖨 Deal sheet (PDF) 📄 Offer letter ✓ Due diligence
Listing remarks
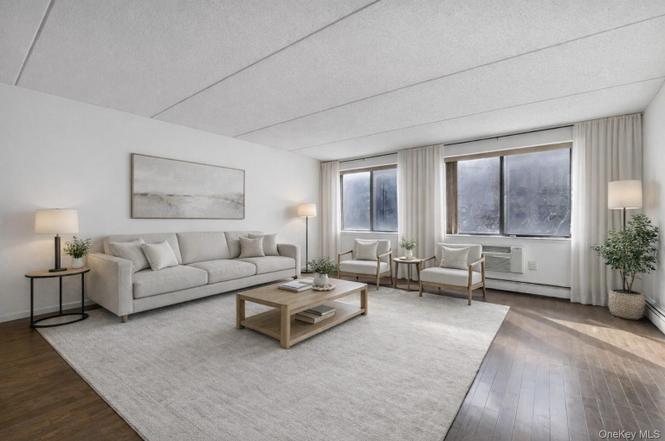
Financing-friendly and move-in ready, this residence allows up to 90% financing, requiring just 10% down, making ownership more accessible than ever. Set on a picturesque, tree-lined street, this two-bedroom, two-bath home offers generous proportions and exceptional natural light throughout. The expansive living and dining area is ideal for hosting or relaxing, seamlessly connected to an open-concept kitchen designed for both style and function. A full wall of oversized windows with southern exposure fills the home with sunlight all day long. The kitchen features a granite breakfast bar, stainless steel appliances including a dishwasher and microwave, and warm wood cabinetry that adds chara
Key facts
- Open concept kitchen
- Tree lined street
- Move in ready
Tags
Neighborhood map
What this means for you Summary
Snapshot
- This is a 2-bed/2.0-bath condo listed at $600k.
Deal economics
- At list price, monthly cash flow is $9 ($109/yr) — positive.
- The deal already cash-flows at list — no discount required.
- To meet the 1% rule (rent ≥ 1% of price), the offer needs to be $534k (10.9% below list).
- Recommended offer: $534k (10.9% below list) — sets the bar for 1% rule.
- Cap rate 6.4% vs local median 2.6% in New York — top-decile yield for the area; either an underpriced asset or a hidden risk that comps aren't pricing in. Stress-test before assuming the spread holds.
Location & tenants
- Location reads 75/100 on livability (#268 in NY, #4,188 nationally) — a middle-class / working-renter tenant base. Strengths: amenities A+, commute A+, health & safety A; Watch: crime F, cost of living F.
- Market conditions: Rents rising fast (+5.6%/yr); 71 active listings in the ZIP; 25 comparable units currently listed for rent nearby; rentals leasing fast (median 8d on market — plan ~1-2 weeks tenant-placement turnaround); 4,467 units permitted in New York County in 2024 (4,463 in 5+ unit buildings).
- At $5,344/mo this rent would consume 142% of the median local household income ($45k/yr) (locally 3992% of renters already pay >50% of income on rent) — very limited rent-growth headroom before tenants either downsize or default.
Forward outlook
- In year one you build about $24k of equity ($4k loan paydown + $19k appreciation (3.2% local appreciation)).
- New York County population projected at +21% by 2050 — long-run rental-demand tailwind backs the buy-and-hold thesis.
- At projected returns (3.2% appreciation + 5.6% rent growth), your $168k cash investment doubles in ~6 years — after that, you're playing with house money.
- By year 2, paydown + projected appreciation supports a ~$38k cash-out refi (75% LTV) — recoverable capital for the next deal without selling this one.
Negotiation context
- It's been on market 41 days — a 3% lower offer ($582k) is reasonable based on typical stale-listing flexibility.
Risks & watch-outs
- Watch-outs: flood insurance adds $66/mo.
- Climate carrying-cost: major flood risk; major wind risk, 27% chance of damaging wind over 30y; extreme-heat days projected 7→15/yr by 2055 (HVAC capex compounding) — expect insurance premiums to compound above CPI over the hold.
Questions for the listing agent
- It's been on market 41 days. Have you received any prior offers? Is the seller open to a 11% concession, seller financing, or rate buy-down credit?
- What's the actual annual flood-insurance premium (NFIP or private), and is the property in a SFHA with mandatory coverage?
- Any open or pending special assessments — roof, HVAC, plumbing, elevator, façade? What's the per-unit balance and payoff schedule, and is the seller paying it off at close or rolling it to the buyer?
- Is there a deadline driving the sale (1031 exchange, divorce, estate, relocation)? That informs how much negotiation room exists.
- Schools are B-rated — typically a magnet for longer-tenancy family renters. What's the average tenant stay here, and is there a school-zone premium baked into asking?
- Crime grade is F in this area — have there been break-ins, vandalism, or insurance claims at this property in the last 3 years? What carrier currently insures it and at what premium?
- What's the average days-on-market for RENTAL listings here right now (not sales)? A rising rental-DOM trend means longer vacancies and softer asking-rent achievability than the comps imply.
- What's the recent tenant-quality profile in this submarket — average credit score on applications, eviction rate, late-payment / NSF rate, and stable-employment percentage? A property-management company in the area should have these aggregated.
- How much new apartment / multifamily construction is in the pipeline within 1–3 miles? Heavy new supply (>2% of stock underway) typically softens rents 12–24 months out; light construction supports rent growth.
Investment metrics
- 1% rule
- 0.89% ✗
- Cap rate
- 6.44%
- Cash-on-cash
- 0.54%
- DSCR
- 1.02
- GRM
- 9.4
CMA / ARV
No comps found within radius.
Projected returns pro-forma
3.23% appreciation · 5.62% rent growth · sell at horizon
- IRR
- 9.6%
- Equity multiple
- 1.56×
- Total profit
- $94,814
- Equity at exit
- $277,637
- IRR
- 13.1%
- Equity multiple
- 3.09×
- Total profit
- $351,638
- Equity at exit
- $434,079
Cash invested: $168,000 (down + closing). Projections, not guarantees.
Landlord ↔ Tenant lean methodology
- Overall (CITY)
- 0 Strongly Tenant-Friendly
- State New York
- 15 Strongly Tenant-Friendly · D+10
- County
- — inherits STATE
- City New York
- 0 Strongly Tenant-Friendly · D+34
ZIP-level market 10035
- Home prices YoY
- 1.0%
- Rents YoY
- 5.6%
- Active inventory
- 71
- Price-to-rent
- 9.4×
Monthly cashflow live
- Estimated rent
- $5,344 high interval (Pro) →
- Mortgage (P&I)
- −$3,146
- Tax est. 1.5%
- −$750 /mo · $9,000/yr
- Insurance
- −$250
- Flood insurance flood zone
- −$66 /mo · $798/yr
- HOA
- −$0
- Vacancy / Maint / Mgmt
- −$1,122
- Net cashflow
- $9
Break-even live
Sensitivity live
| Price | -10% $424 | -5% $216 | +0% $9 | +5% $-198 | +10% $-406 |
|---|---|---|---|---|---|
| Rent | -10% $-413 | -5% $-202 | +0% $9 | +5% $220 | +10% $431 |
| Rate | -1.0pp $311 | -0.5pp $162 | base $9 | +0.5pp $-146 | +1.0pp $-305 |
UW: 25.0% down · 7.5% · 30yr · 1.5% tax · 5.0% vac · 8.0% maint · 8.0% mgmt
Financing live
Cash to close
- Down payment
- $150,000
- Closing costs
- $18,000
- Reserves months
- —
- Total cash needed
- —
Loan-product check · same deal, 3 products live
Conventional
25% down · 7.5% · 30yr
- Down + closing
- —
- Monthly P&I
- —
- Monthly cashflow
- —
- DSCR
- —
- Eligible?
- —
Personal DTI + credit; lowest rate.
DSCR
20% down · 8.5% · 30yr
- Down + closing
- —
- Monthly P&I
- —
- Monthly cashflow
- —
- DSCR
- —
- Eligible?
- —
No personal income docs; deal must DSCR.
Hard money
10% down · 12.0% · 12mo
- Down + closing
- —
- Monthly P&I
- —
- Monthly cashflow
- —
- DSCR
- —
- Eligible?
- —
Short-term bridge; refi at stabilization.
Rent comps 25 comps
| Address | Beds | Baths | Sqft | Rent | $/sqft | DOM | Units | Dist |
|---|---|---|---|---|---|---|---|---|
| 319 E 109th St Unit 1021947P New York, NY | 3.0 | 1.0 | 818 | $7,260 | $8.88 | 5d | 1 | 0.53mi |
| 5 Lincoln Ave Bronx, NY | 1.0–3.0 | 1.0–2.5 | 1011 | $5,134 | $5.08 | 2d | 183 | 0.62mi |
| 77 E 110th St Unit 1322508P New York, NY | 2.0 | 1.5 | 990 | $6,360 | $6.42 | 25d | 1 | 0.64mi |
| 2413 3rd Ave Bronx, NY | 1.0–3.0 | 1.0–2.0 | 857 | $3,948 | $4.60 | 12d | 23 | 0.69mi |
| 1635 Lexington Ave Unit 6D New York, NY | 2.0 | 2.0 | 1112 | $6,000 | $5.40 | 25d | 1 | 0.86mi |
| 122 E 102nd St Unit 1021896P New York, NY | 2.0 | 1.0 | 742 | $5,429 | $7.32 | 16d | 1 | 0.96mi |
| 230 W 126th St Unit 20C New York, NY | 2.0 | 1.0 | 860 | $4,555 | $5.30 | 25d | 1 | 1.07mi |
| 132 W 134th St New York, NY | 2.0 | 1.0 | 750 | $4,500 | $6.00 | 25d | 1 | 1.13mi |
| 312 W 121st St Unit 5-A New York, NY | 3.0 | 1.0 | 800 | $4,655 | $5.82 | 12d | 1 | 1.18mi |
| 1501 Lexington Ave #932 New York, NY | 1.0 | 1.0 | 583 | $5,580 | $9.56 | 4d | 2 | 1.19mi |
| 215 E 96th St Unit 688 New York, NY | 1.0 | 1.0 | 717 | $7,960 | $11.10 | 3d | 1 | 1.19mi |
| 508 Manhattan Ave Unit 2C New York, NY | 3.0 | 1.0 | 800 | $4,699 | $5.87 | 12d | 1 | 1.19mi |
| 312 W 121st St Unit 4C New York, NY | 3.0 | 2.0 | 900 | $4,854 | $5.39 | 8d | 1 | 1.19mi |
| 506 Manhattan Ave Unit 1A New York, NY | 3.0 | 1.0 | 800 | $4,699 | $5.87 | 12d | 1 | 1.20mi |
| 175 E 96th St Unit 1251683P New York, NY | 2.0 | 1.0 | 600 | $6,380 | $10.63 | 3d | 2 | 1.21mi |
| 215 E 95th St #1293 New York, NY | 1.0–2.0 | 1.0–1.5 | 740 | $6,100 | $8.24 | 2d | 2 | 1.23mi |
| 345 E 94th St #1470 New York, NY | 2.0 | 1.0–2.0 | 710 | $7,570 | $10.65 | 4d | 3 | 1.29mi |
| 53-55 E 95th St Unit 4A New York, NY | 3.0 | 2.0 | 803 | $7,495 | $9.33 | 8d | 1 | 1.32mi |
| 300 W 135th St Unit 9G New York, NY | 3.0 | 2.0 | 1032 | $5,500 | $5.33 | 5d | 1 | 1.36mi |
| 30 Morningside Dr #2096 New York, NY | 1.0–2.0 | 1.0–2.0 | 780 | $9,000 | $11.53 | 4d | 2 | 1.39mi |
| 1 Morningside Dr New York, NY | 3.0 | 1.0–2.0 | 1655 | $8,145 | $4.92 | 1d | 1 | 1.42mi |
| 420 Central Park W Unit 6K New York, NY | 2.0 | 2.0 | 1060 | $8,000 | $7.55 | 22d | 1 | 1.43mi |
| 354 E 91st St #648 New York, NY | 1.0–2.0 | 1.0 | 692 | $6,840 | $9.88 | 2d | 2 | 1.46mi |
| 1377 Lexington Ave Unit 5CC New York, NY | 2.0 | 1.0 | 796 | $5,100 | $6.41 | 20d | 1 | 1.49mi |
| 118 E 91st St Unit 1022052P New York, NY | 3.0 | 1.0 | 592 | $6,180 | $10.44 | 8d | 1 | 1.50mi |
HOA detail condo
- Monthly dues
- $0 · $0/yr
- Assessments
- None detected in remarks — confirm with the listing agent.
Listing history 2 events
-
2026-03-16status Pending
-
2026-02-03$599,999 Active
ⓘ Source: listings_history table (triggers on properties + properties_extension) + one-shot
backfill from property_details.listing_events for pre-trigger history.
Climate risk First Street
- Flood 7/10 Severe FEMA zone X (shaded) · 77% chance over 30 yrs
- Wildfire 1/10 Low
- Heat 7/10 Severe 7 d/yr ≥99°F today · 15 d/yr by 30 yrs out
- Wind 6/10 Major 27% chance of damaging wind over 30 yrs
- Air quality 4/10 Moderate 5 unhealthy d/yr today · 6 by 30 yrs out
Nearby sold comps map
Loading sold comps map…
Walkable amenities ~0.75 mi
Loading nearby amenities…
Taxation est. · year 1
- Rental income
- $64,131
- − Mortgage interest
- −$33,609
- − Property taxes
- −$9,000
- − Insurance
- −$3,797
- − Repairs & maintenance
- −$5,130
- − Management
- −$5,130
- − Depreciation
- −$17,455
- Taxable loss
- −$9,991
- Est. tax savings @ 24.0%
- +$2,398
- After-tax cash flow
- $2,506/yr
For passive investors: Depreciation is non-cash, so a rental often shows a tax loss while cash-flowing — sheltering income. Rental losses are passive: they offset passive income freely, and up to $25,000/yr can offset ordinary (W-2) income if you actively participate and your MAGI is under $100k (phasing out to $0 by $150k); unused losses carry forward. On sale, claimed depreciation is recaptured at up to 25%, and gains may owe capital-gains tax (a 1031 exchange can defer both). Figures are a year-1 estimate at your 24.0% rate — not tax advice; consult a CPA.
Schools (NCES district)
No district data.
Livability — New York
- Score
- 75/100
- State rank
- #268
- US rank
- #4188
Category grades
Schools grade is shown separately in the Schools card above.
Census & demographics
- Census place
- New York, NY
- County
- New York County · 1,599,927 people
- City population
- 7,731,280
- Metro
- New York-Newark-Jersey City, NY-NJ-PA
- Population (ZIP)
- 38,862
- Household income
- $45,121
- Rent vs Own
- Severe rent burden
- 3992.0
Population outlook (New York County) Hauer SSP2
- Today (2025)
- 1,825,725 people
- By 2030
- 1,904,611 · +4.3%
- By 2040
- 2,052,719 · +12.4%
- By 2050
- 2,206,601 · +20.9%
- By 2075
- 2,509,427 · +37.4%
- By 2100
- 2,702,933 · +48.0%
Race, ethnicity, and origin ACS 2023
- Neighborhood character
- Diverse neighborhood (Simpson 0.68)
- Race & ethnicity
- Hispanic / Latino 42% Black 35% White 14% Two or more races 13% Asian 6% Native American 2%
- Hispanic origin (detail)
- Mexican 5% Puerto Rican 16% Dominican 10%
- Common ancestry
- Lithuanian 2% Romanian 1% Scotch-Irish 1%
- Foreign-born
- 23% · Canada, China, Jamaica
- Languages at home
- 54% English-only · Spanish 34% Other Indo-European 3% Russian/Polish/Slavic 2%
Political lean MEDSL · New York
- 2024 margin
- Solid D (+64.8) · D 82.4% · R 17.6%
- 2008→2024 swing
- -7.4pp toward R · 2008: 72.2pp · 2024: 64.8pp
- All cycles
- 2024: D+64.8 2020: D+74.5 2016: D+77.2 2012: D+69.6 2008: D+72.2
Not yet ingested
- Civics
- —
Market trends
- HPI YoY
- ▲ 3.23%
- Current HPI
- 317.1637
- Rent YoY
- ▲ 5.62%
- Metro
- New York-Newark-Jersey City, NY-NJ-PA
- State GDP YoY
- ▲ 2.60%
- F500 in state
- 92
Industry mix (Fortune 500 HQ in NY)
| Industry | F500 HQs | Revenue |
|---|---|---|
| Financial Services | 10 | $950B |
|
||
| Consumer Goods | 9 | $162B |
|
||
| Insurance | 4 | $225B |
|
||
| Telecommunications | 2 | $144B |
|
||
| Pharmaceuticals | 2 | $112B |
|
||
| Media / Entertainment | 2 | $69B |
|
||
Price history
2 events — show timeline
- 2026-03-16 Pending — OneKey® MLS as Distributed by MLS Grid
- 2026-02-03 Listed $599,999 OneKey® MLS as Distributed by MLS Grid
Cash-flow waterfall
monthlySold comps — $/sqft
last 12 mo · ≤1 miLoading sold comps…