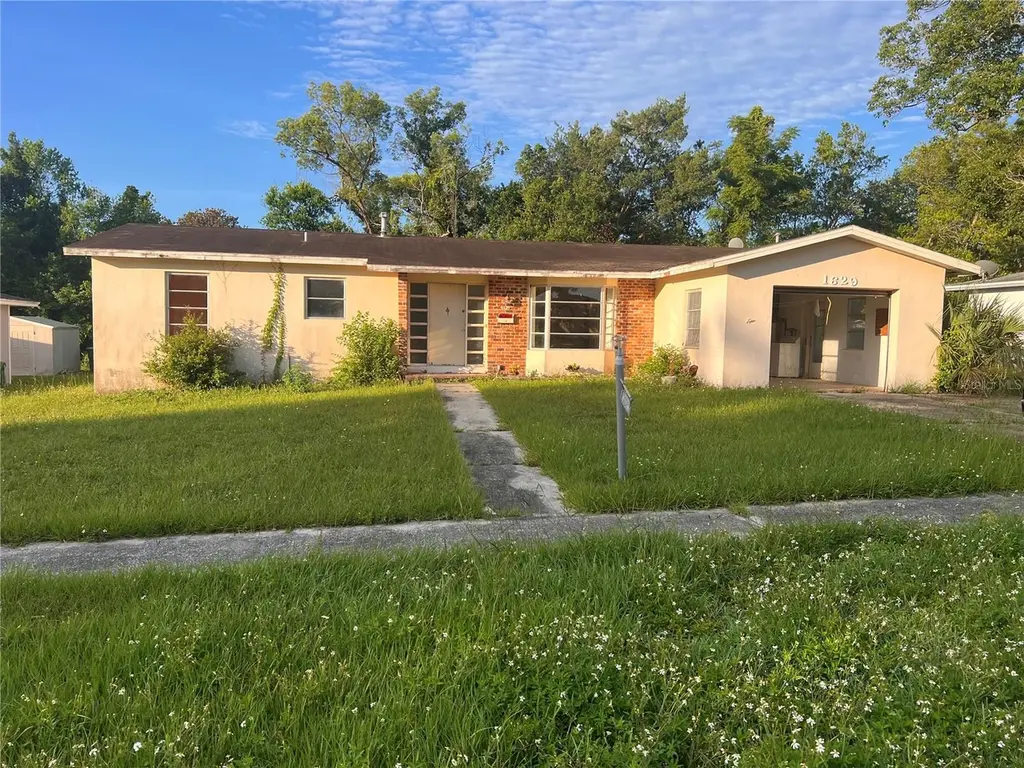
1629 Lindsey Ter · Deltona, FL
Flood risk 1/10 · Minimal
- FEMA flood zone
- X (unshaded)
- Chance of flooding over 30 yrs
- 0.0%
- Est. flood insurance / yr
- $507 – $1,088
Fire risk 3/10 · Minor
- Est. fire insurance / yr
- $947 – $1,759
Heat risk 9/10 · Severe
- Hot days now (above 107°F)
- 7 days/yr
- Hot days in 30 yrs
- 20 days/yr
Wind risk 9/10 · Severe
- Chance of severe wind over 30 yrs
- 99.0%
Air-quality risk 2/10 · Minimal
- Unhealthy air days now
- 1 days/yr
- Unhealthy air days in 30 yrs
- 1 days/yr
Risk factors via First Street. Map © Google.
Why this score? — see what drove the B- grade
The composite is a weighted blend of 9 inputs, each scored 0–100. Each bar is that input's sub-score; the figure is the points it added to the 100-point composite (weight × sub-score).
- Cash flow +27.4/30.0
- DSCR +9.6/10.0
- 1% rule +8.5/10.0
- ARV discount +7.5/15.0
- Schools +3.9/10.0
- Livability +3.6/5.0
- Rent growth +2.7/5.0
- Condition / age +2.5/5.0
- Appreciation +0.0/10.0
$165,000
🖨 Deal sheet (PDF) 📄 Offer letter ✓ Due diligence
Listing remarks
Under contract-accepting backup offers. Cash or Hard Money only. Full rehab
Key facts
- 7,500 sq ft lot
- Garage
- Built 1968
Neighborhood map
What this means for you Summary
Snapshot
- This is a 4-bed/2.0-bath single-family listed at $165k.
Deal economics
- At list price, monthly cash flow is $484 ($6k/yr) — positive.
- The deal already cash-flows at list — no discount required.
- Meets the 1% rule at list price ($2k rent vs $165k).
Location & tenants
- Location reads 71/100 on livability (#381 in FL) — a middle-class / working-renter tenant base. Strengths: cost of living A+, housing A+, health & safety A+; Watch: amenities F, commute F.
- Volusia (suburban): math 44% / reading 49% proficiency, ranked #47 of 73 in FL (top 64%) — families likely to look elsewhere, expect single-tenant / working-renter base with shorter leases.
- Zoned schools: Spirit Elementary School (math 41% / reading 48%, grade F, #1,288 of 2,144 statewide, top 62%, 681 students, 64% FRL); Deltona Middle School (math 37% / reading 43%, grade F, #368 of 571 statewide, top 65%, 1,146 students, 60% FRL); Deltona High School (math 27% / reading 46%, grade F, #351 of 667 statewide, top 54%, 1,851 students, 52% FRL).
- Market conditions: Rents flat; 421 active listings in the ZIP; 13 comparable units currently listed for rent nearby; rentals at typical pace (median 25d on market — plan ~3-4 weeks tenant-placement turnaround); 3,402 units permitted in Volusia County in 2024 (681 in 5+ unit buildings).
- This rent runs 37% of the median local income ($73k/yr) — at the standard rent-burdened threshold; future hikes will face affordability resistance.
Forward outlook
- Local home prices are declining (-3.0%/yr); year-one equity from $1k of loan paydown is wiped out by about $5k of value loss. Plan a longer hold.
- Volusia County population projected at +19% by 2050 — long-run rental-demand tailwind backs the buy-and-hold thesis.
Negotiation context
- Only 7 days on market — expect competitive offers; lowballing is unlikely to land.
- Current owner paid $20k; list at $165k implies a 705% gain — meaningful room to come down on a strong offer.
Risks & watch-outs
- Watch-outs: property tax is 2.5% of price.
- Climate carrying-cost: severe wind risk, 99% chance of damaging wind over 30y; extreme-heat days projected 7→20/yr by 2055 (HVAC capex compounding) — expect insurance premiums to compound above CPI over the hold.
Questions for the listing agent
- Built in 1968 — when were the roof, HVAC, electrical panel, plumbing, and water heater last replaced?
- Property tax is high relative to price — has the assessment been appealed recently, and will the sale trigger a re-assessment?
- Is there a deadline driving the sale (1031 exchange, divorce, estate, relocation)? That informs how much negotiation room exists.
- Schools are D-rated, which usually means shorter tenancies and higher turnover. Who's the typical renter profile here, and what's been the actual vacancy rate?
- What's the average days-on-market for RENTAL listings here right now (not sales)? A rising rental-DOM trend means longer vacancies and softer asking-rent achievability than the comps imply.
- What's the recent tenant-quality profile in this submarket — average credit score on applications, eviction rate, late-payment / NSF rate, and stable-employment percentage? A property-management company in the area should have these aggregated.
- How much new for-sale + rental construction is in the pipeline within 1–3 miles? Heavy new supply typically softens prices + rents 12–24 months out; constrained supply supports both.
Investment metrics
- 1% rule
- 1.35% ✓
- Cap rate
- 9.81%
- Cash-on-cash
- 12.57%
- DSCR
- 1.56
- GRM
- 6.2
CMA / ARV
No comps found within radius.
Projected returns pro-forma
-3.0% appreciation · 0.61% rent growth · sell at horizon
- IRR
- -0.6%
- Equity multiple
- 0.98×
- Total profit
- $-1,039
- Equity at exit
- $24,602
- IRR
- 6.2%
- Equity multiple
- 1.41×
- Total profit
- $18,771
- Equity at exit
- $14,266
Cash invested: $46,200 (down + closing). Projections, not guarantees.
Landlord ↔ Tenant lean methodology
- Overall (STATE)
- 87 Strongly Landlord-Friendly
- State Florida
- 87 Strongly Landlord-Friendly · R+3
- County
- — inherits STATE
- City
- — inherits STATE
ZIP-level market 32725
- Rents YoY
- 0.6%
- Active inventory
- 421
- Price-to-rent
- 6.2×
Monthly cashflow live
- Estimated rent
- $2,230 high interval (Pro) →
- Mortgage (P&I)
- −$865
- Tax from tax record
- −$344 /mo · $4,127/yr
- Insurance
- −$69
- HOA
- −$0
- Vacancy / Maint / Mgmt
- −$468
- Net cashflow
- $484
Break-even live
Sensitivity live
| Price | -10% $577 | -5% $531 | +0% $484 | +5% $437 | +10% $390 |
|---|---|---|---|---|---|
| Rent | -10% $308 | -5% $396 | +0% $484 | +5% $572 | +10% $660 |
| Rate | -1.0pp $567 | -0.5pp $526 | base $484 | +0.5pp $441 | +1.0pp $398 |
UW: 25.0% down · 7.5% · 30yr · 1.5% tax · 5.0% vac · 8.0% maint · 8.0% mgmt
Financing live
Cash to close
- Down payment
- $41,250
- Closing costs
- $4,950
- Reserves months
- —
- Total cash needed
- —
Loan-product check · same deal, 3 products live
Conventional
25% down · 7.5% · 30yr
- Down + closing
- —
- Monthly P&I
- —
- Monthly cashflow
- —
- DSCR
- —
- Eligible?
- —
Personal DTI + credit; lowest rate.
DSCR
20% down · 8.5% · 30yr
- Down + closing
- —
- Monthly P&I
- —
- Monthly cashflow
- —
- DSCR
- —
- Eligible?
- —
No personal income docs; deal must DSCR.
Hard money
10% down · 12.0% · 12mo
- Down + closing
- —
- Monthly P&I
- —
- Monthly cashflow
- —
- DSCR
- —
- Eligible?
- —
Short-term bridge; refi at stabilization.
Rent comps 13 comps
| Address | Beds | Baths | Sqft | Rent | $/sqft | DOM | Units | Dist |
|---|---|---|---|---|---|---|---|---|
| 1194 Fort Smith Blvd Deltona, FL | 4.0 | 2.0 | 1970 | $2,300 | $1.17 | 25d | 1 | 0.66mi |
| 1551 Ortega Ave Deltona, FL | 3.0 | 2.0 | 1815 | $2,300 | $1.27 | 25d | 1 | 0.91mi |
| 1430 Arbor Hill Dr Deltona, FL | 4.0 | 2.0 | 1903 | $2,250 | $1.18 | 25d | 1 | 0.96mi |
| 1317 Sterling Pointe Dr Deltona, FL | 4.0 | 2.0 | 1903 | $2,300 | $1.21 | 16d | 1 | 0.98mi |
| 1383 Providence Blvd Deltona, FL | 3.0 | 2.0 | 1120 | $1,800 | $1.61 | 25d | 1 | 1.00mi |
| 1778 Belspring Ave Deltona, FL | 4.0 | 2.0 | 1750 | $2,100 | $1.20 | 25d | 1 | 1.01mi |
| 872 Abbott Ave Deltona, FL | 4.0 | 1.0 | 1500 | $1,850 | $1.23 | 25d | 1 | 1.04mi |
| 1123 Wycliffe St Deltona, FL | 3.0 | 2.0 | 1172 | $2,095 | $1.79 | 20d | 1 | 1.06mi |
| 1021 Giovanni St Deltona, FL | 4.0 | 2.0 | 1378 | $1,890 | $1.37 | 25d | 1 | 1.18mi |
| 1007 Matterhorn St Deltona, FL | 3.0 | 2.0 | 1462 | $2,050 | $1.40 | 25d | 1 | 1.18mi |
| 1208 Bailey Ave Deltona, FL | 3.0 | 2.0 | 1962 | $1,550 | $0.79 | 25d | 1 | 1.23mi |
| 1051 Shepherd Ave Deltona, FL | 3.0 | 2.0 | 1316 | $1,761 | $1.34 | 12d | 1 | 1.29mi |
| 1842 Giles St Deltona, FL | 3.0 | 2.0 | 1209 | $1,820 | $1.51 | 25d | 1 | 1.44mi |
Listing history 3 events
-
2025-06-19status Pending
-
2025-06-12$165,000 Active
-
1968-08-01soldstatus $20,500
ⓘ Source: listings_history table (triggers on properties + properties_extension) + one-shot
backfill from property_details.listing_events for pre-trigger history.
Tax reassessment forecast FL · Resets to sale price
- Current annual tax
- $4,127 · $344/mo
- Projected year-2 tax
- $4,127 · $344/mo
- Expected delta
- $0/yr ($0/mo · 0.0%)
ⓘ Screening estimate from a state-policy table — verify with the county assessor before closing.
Climate risk First Street
- Flood 1/10 Low FEMA zone X (unshaded) · 0% chance over 30 yrs
- Wildfire 3/10 Moderate
- Heat 9/10 Extreme 7 d/yr ≥107°F today · 20 d/yr by 30 yrs out
- Wind 9/10 Extreme 99% chance of damaging wind over 30 yrs
- Air quality 2/10 Low 1 unhealthy d/yr today · 1 by 30 yrs out
Nearby sold comps map
Loading sold comps map…
Walkable amenities ~0.75 mi
Loading nearby amenities…
Taxation est. · year 1
- Rental income
- $26,762
- − Mortgage interest
- −$9,243
- − Property taxes
- −$4,127
- − Insurance
- −$825
- − Repairs & maintenance
- −$2,141
- − Management
- −$2,141
- − Depreciation
- −$4,800
- Taxable income
- $3,485
- Est. tax owed @ 24.0%
- −$836
- After-tax cash flow
- $4,970/yr
For passive investors: Depreciation is non-cash, so a rental often shows a tax loss while cash-flowing — sheltering income. Rental losses are passive: they offset passive income freely, and up to $25,000/yr can offset ordinary (W-2) income if you actively participate and your MAGI is under $100k (phasing out to $0 by $150k); unused losses carry forward. On sale, claimed depreciation is recaptured at up to 25%, and gains may owe capital-gains tax (a 1031 exchange can defer both). Figures are a year-1 estimate at your 24.0% rate — not tax advice; consult a CPA.
Schools (NCES district)
- District
- Volusia
- NCES district ID
- 1201920
- Math proficiency
- 44% ▼ -9.00%
- Reading proficiency
- 49% ▼ -3.00%
- Median HH income
- $42,946
- Composite
- 39.2/100
- National rank
- #4019
- State rank
- #47 of 73 in FL
Livability — Deltona
- Score
- 71/100
- State rank
- #381
- US rank
- #6749
Category grades
Schools grade is shown separately in the Schools card above.
Census & demographics
- Census place
- Deltona, FL
- County
- Volusia County · 556,871 people
- City population
- 101,355
- Metro
- Deltona-Daytona Beach-Ormond Beach, FL
- Population (ZIP)
- 51,987
- Household income
- $73,152
- Rent vs Own
- Severe rent burden
- 1051.0
Population outlook (Volusia County) Hauer SSP2
- Today (2025)
- 572,749 people
- By 2030
- 598,695 · +4.5%
- By 2040
- 644,880 · +12.6%
- By 2050
- 681,451 · +19.0%
- By 2075
- 759,957 · +32.7%
- By 2100
- 778,902 · +36.0%
Race, ethnicity, and origin ACS 2023
- Neighborhood character
- Diverse neighborhood (Simpson 0.63)
- Race & ethnicity
- White 45% Hispanic / Latino 39% Two or more races 12% Black 10% Asian 3%
- Hispanic origin (detail)
- Mexican 3% Puerto Rican 23% Cuban 4% Dominican 3%
- Common ancestry
- Romanian 1% Lithuanian 1% Serbian 1%
- Foreign-born
- 13% · Canada, Jamaica, Vietnam
- Languages at home
- 66% English-only · Spanish 30% Vietnamese 1% Other Indo-European 1%
Political lean MEDSL · Volusia
- 2024 margin
- Strong R (+21.8) · D 38.7% · R 60.5%
- 2008→2024 swing
- -27.4pp toward R · 2008: 5.7pp · 2024: -21.8pp
- All cycles
- 2024: R+21.8 2020: R+14.1 2016: R+13.1 2012: R+1.2 2008: D+5.7
Not yet ingested
- Civics
- —
Market trends
- HPI YoY
- ▼ -195.58%
- Current HPI
- 349.7999
- Rent YoY
- ▲ 0.61%
- Metro
- Deltona-Daytona Beach-Ormond Beach, FL
- State GDP YoY
- ▲ 3.28%
- F500 in state
- 36
Industry mix (Fortune 500 HQ in FL)
| Industry | F500 HQs | Revenue |
|---|---|---|
| Industrial Technology | 2 | $29B |
|
||
| Insurance | 2 | $17B |
|
||
| Retail | 1 | $60B |
|
||
| Technology Distribution | 1 | $58B |
|
||
| Homebuilding | 1 | $35B |
|
||
| Technology Manufacturing | 1 | $35B |
|
||
Price history
+704.9% since first listed3 events — show timeline
- 2025-06-19 Pending — Stellar MLS as Distributed by MLS Grid
- 2025-06-12 Listed $165,000 Stellar MLS as Distributed by MLS Grid
- 1968-08-01 Sold (Public Records) $20,500 Public Records
Property tax history
+19.1%/yrLatest (2025): $4,127 · +4.9% YoY. Source: county tax records.
Cash-flow waterfall
monthlySold comps — $/sqft
last 12 mo · ≤1 miLoading sold comps…