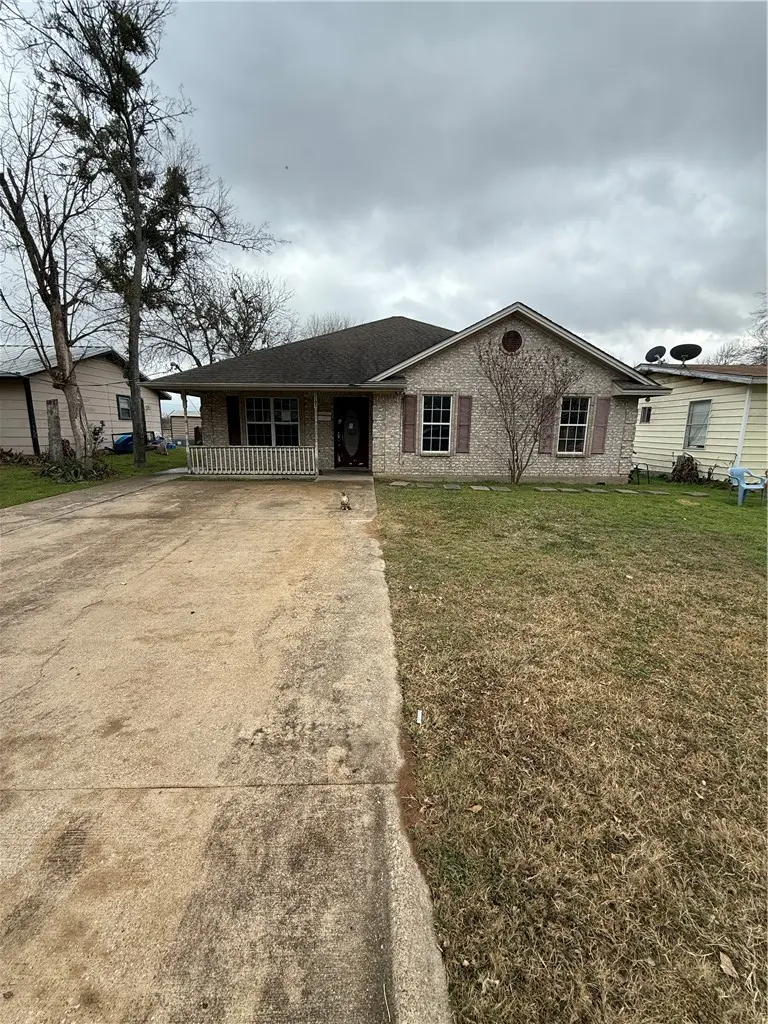
1105 W Davis St · Hearne, TX
Flood risk 3/10 · Minor
- FEMA flood zone
- X (unshaded)
- Chance of flooding over 30 yrs
- 0.2%
- Est. flood insurance / yr
- $507 – $1,088
Fire risk 4/10 · Minor
- Est. fire insurance / yr
- $1,222 – $2,270
Heat risk 8/10 · Major
- Hot days now (above 110°F)
- 7 days/yr
- Hot days in 30 yrs
- 24 days/yr
Wind risk 8/10 · Major
- Chance of severe wind over 30 yrs
- 80.0%
Air-quality risk 1/10 · Minimal
- Unhealthy air days now
- 0 days/yr
- Unhealthy air days in 30 yrs
- 0 days/yr
Risk factors via First Street. Map © Google.
Why this score? — see what drove the B+ grade
The composite is a weighted blend of 9 inputs, each scored 0–100. Each bar is that input's sub-score; the figure is the points it added to the 100-point composite (weight × sub-score).
- Cash flow +25.7/30.0
- ARV discount +15.0/15.0
- Appreciation +10.0/10.0
- 1% rule +9.9/10.0
- DSCR +8.5/10.0
- Livability +3.3/5.0
- Rent growth +2.5/5.0
- Condition / age +2.5/5.0
- Schools +1.2/10.0
$100,800
🖨 Deal sheet 📄 Offer letter ✓ Due diligence
Listing remarks
3 bedroom 1.5 bath home in Hearne TX price to sell at Auction. Located on a . 14 ac lot, this home has 1592 sqft built in 2003. With a little TLC, this is a great place to call hom
Key facts
- 6,229 sq ft lot
- Built 2003
Property features AI
Exterior
- Parking: No dedicated parking
- Utilities: Public water; Public sewer; Electricity available
- Home design: Single-family residence; One level / single-story
- Construction: Brick and HardiPlank-type siding; Other exterior materials; Slab foundation
- Exterior features: Composition roof; Lot approximately 0.143 acres
Interior
- Flooring: Concrete flooring; Tile flooring
- Bathrooms: 1 full bathroom; 1 half bathroom
- Heating & cooling: Central heating (electric); Central air conditioning (electric); Ceiling fans
- Interior features: Ceiling fans
- Laundry & utility: Washer hookup; Electric water heater
Neighborhood map
What this means for you Summary
Snapshot
- This is a 3-bed/1.5-bath single-family listed at $101k.
Deal economics
- At list price, monthly cash flow is $240 ($3k/yr) — positive.
- The deal already cash-flows at list — no discount required.
- Meets the 1% rule at list price ($2k rent vs $101k).
- Cap rate 9.2% vs local median 4.9% in Hearne — top-decile yield for the area; either an underpriced asset or a hidden risk that comps aren't pricing in. Stress-test before assuming the spread holds.
Location & tenants
- Location reads 66/100 on livability (#611 in TX) — a middle-class / working-renter tenant base. Strengths: commute A+, cost of living A+, housing A+; Watch: schools F, amenities F, employment F.
- Hearne ISD (town): math 10% / reading 18% proficiency, ranked #816 of 826 in TX (top 99%) — low school quality limits family demand, transient renter base, plan for 1-2y turnover; 88% free/reduced lunch — lower-income household profile, screen leases tightly.
- Market conditions: 92 active listings in the ZIP; 1 comparable units currently listed for rent nearby; 23 units permitted in Robertson County in 2023 (0 in 5+ unit buildings).
Forward outlook
- In year one you build about $11k of equity ($697 loan paydown + $10k appreciation (10.0% local appreciation)).
- At projected returns (10.0% appreciation + 3.0% rent growth), your $28k cash investment doubles in ~2 years — after that, you're playing with house money.
- By year 4, paydown + projected appreciation supports a ~$38k cash-out refi (75% LTV) — recoverable capital for the next deal without selling this one.
Negotiation context
- Only 1 days on market — expect competitive offers; lowballing is unlikely to land.
- 2 sale attempts with the ask held roughly flat each time — persistent listings suggest the price (not the market) is what's stuck; bring a comps-based counter.
Risks & watch-outs
- Watch-outs: property tax is 4.5% of price.
- Climate carrying-cost: severe wind risk, 80% chance of damaging wind over 30y; extreme-heat days projected 7→24/yr by 2055 (HVAC capex compounding) — expect insurance premiums to compound above CPI over the hold.
Questions for the listing agent
- Property tax is high relative to price — has the assessment been appealed recently, and will the sale trigger a re-assessment?
- Is there a deadline driving the sale (1031 exchange, divorce, estate, relocation)? That informs how much negotiation room exists.
- Schools are F-rated, which usually means shorter tenancies and higher turnover. Who's the typical renter profile here, and what's been the actual vacancy rate?
- What's the average days-on-market for RENTAL listings here right now (not sales)? A rising rental-DOM trend means longer vacancies and softer asking-rent achievability than the comps imply.
- What's the recent tenant-quality profile in this submarket — average credit score on applications, eviction rate, late-payment / NSF rate, and stable-employment percentage? A property-management company in the area should have these aggregated.
- How much new for-sale + rental construction is in the pipeline within 1–3 miles? Heavy new supply typically softens prices + rents 12–24 months out; constrained supply supports both.
Investment metrics
- 1% rule
- 1.49% ✓
- Cap rate
- 9.15%
- Cash-on-cash
- 10.20%
- DSCR
- 1.45
- GRM
- 5.6
CMA / ARV
- ARV (on-the-fly)
- $194,224
- Comps found
- 5
Show comp detail 5 sales within ~0.75 mi
| Address | Dist | Beds/Ba | Sqft | Sold | Price | $/sf | Match |
|---|---|---|---|---|---|---|---|
| 1209 W 2nd St | 0.15mi | 3/2.5 | 1,449 (-9%) | 0mo | $80,000 | $55 | 74 |
| 1109 Wheelock St | 0.46mi | 3/2.0 | 1,713 (+8%) | 12mo | $238,000 | $139 | 54 |
| 507 W Hall St | 0.48mi | 3/2.0 | 1,760 (+11%) | 15mo | $175,000 | $99 | 45 |
| 401 N San Marcos St | 0.57mi | 3/2.0 | 1,354 (-15%) | 7mo | $165,000 | $122 | 41 |
| 504 W Tenth St | 0.75mi | 3/2.0 | 1,384 (-13%) | 2mo | $205,000 | $148 | 40 |
Match score weights: distance 35% · size 25% · config 20% · recency 20%. Top-matched comps best support the ARV.
Projected returns pro-forma
10.0% appreciation · 3.0% rent growth · sell at horizon
- IRR
- 31.8%
- Equity multiple
- 3.49×
- Total profit
- $70,361
- Equity at exit
- $90,809
- IRR
- 27.5%
- Equity multiple
- 7.93×
- Total profit
- $195,527
- Equity at exit
- $195,832
Cash invested: $28,224 (down + closing). Projections, not guarantees.
Landlord ↔ Tenant lean methodology
- Overall (STATE)
- 87 Strongly Landlord-Friendly
- State Texas
- 87 Strongly Landlord-Friendly · R+5
- County
- — inherits STATE
- City
- — inherits STATE
ZIP-level market 77859
- Home prices YoY
- 11.2%
- Active inventory
- 92
- Price-to-rent
- 5.6×
Monthly cashflow live
- Estimated rent
- $1,500 medium interval (Pro) →
- Mortgage (P&I)
- −$529
- Tax from tax record
- −$374 /mo · $4,493/yr
- Insurance
- −$42
- HOA
- −$0
- Vacancy / Maint / Mgmt
- −$315
- Net cashflow
- $240
Break-even live
UW: 25.0% down · 7.5% · 30yr · 1.5% tax · 5.0% vac · 8.0% maint · 8.0% mgmt
Financing live
Cash to close
- Down payment
- $25,200
- Closing costs
- $3,024
- Reserves months
- —
- Total cash needed
- —
Loan-product check · same deal, 3 products live
Conventional
25% down · 7.5% · 30yr
- Down + closing
- —
- Monthly P&I
- —
- Monthly cashflow
- —
- DSCR
- —
- Eligible?
- —
Personal DTI + credit; lowest rate.
DSCR
20% down · 8.5% · 30yr
- Down + closing
- —
- Monthly P&I
- —
- Monthly cashflow
- —
- DSCR
- —
- Eligible?
- —
No personal income docs; deal must DSCR.
Hard money
10% down · 12.0% · 12mo
- Down + closing
- —
- Monthly P&I
- —
- Monthly cashflow
- —
- DSCR
- —
- Eligible?
- —
Short-term bridge; refi at stabilization.
Rent comps 1 comps
| Address | Beds | Baths | Sqft | Rent | $/sqft | DOM | Units | Dist |
|---|---|---|---|---|---|---|---|---|
| 401 E 3rd St Hearne, TX | 4.0 | 3.0 | 1338 | $1,500 | $1.12 | 20d | 1 | 0.95mi |
Listing history 4 events
-
2026-05-07status Pending
-
2026-05-07$100,800 Active
-
2026-03-16price $106,400
-
2026-01-29$112,000 Active
ⓘ Source: listings_history table (triggers on properties + properties_extension) + one-shot
backfill from property_details.listing_events for pre-trigger history.
Tax reassessment forecast TX · Resets to sale price
- Current annual tax
- $4,493 · $374/mo
- Projected year-2 tax
- $4,493 · $374/mo
- Expected delta
- $0/yr ($0/mo · 0.0%)
ⓘ Screening estimate from a state-policy table — verify with the county assessor before closing.
Climate risk First Street
- Flood 3/10 Moderate FEMA zone X (unshaded) · 20% chance over 30 yrs
- Wildfire 4/10 Moderate
- Heat 8/10 Severe 7 d/yr ≥110°F today · 24 d/yr by 30 yrs out
- Wind 8/10 Severe 80% chance of damaging wind over 30 yrs
- Air quality 1/10 Low 0 unhealthy d/yr today · 0 by 30 yrs out
Nearby sold comps map
Loading sold comps map…
Walkable amenities ~0.75 mi
Loading nearby amenities…
Taxation est. · year 1
- Rental income
- $18,000
- − Mortgage interest
- −$5,646
- − Property taxes
- −$4,493
- − Insurance
- −$504
- − Repairs & maintenance
- −$1,440
- − Management
- −$1,440
- − Depreciation
- −$2,932
- Taxable income
- $1,545
- Est. tax owed @ 24.0%
- −$371
- After-tax cash flow
- $2,509/yr
For passive investors: Depreciation is non-cash, so a rental often shows a tax loss while cash-flowing — sheltering income. Rental losses are passive: they offset passive income freely, and up to $25,000/yr can offset ordinary (W-2) income if you actively participate and your MAGI is under $100k (phasing out to $0 by $150k); unused losses carry forward. On sale, claimed depreciation is recaptured at up to 25%, and gains may owe capital-gains tax (a 1031 exchange can defer both). Figures are a year-1 estimate at your 24.0% rate — not tax advice; consult a CPA.
Schools (NCES district)
- District
- Hearne ISD
- NCES district ID
- 4822830
- Math proficiency
- 10% ▼ -16.00%
- Reading proficiency
- 18% ▼ -4.00%
- Median HH income
- $41,858
- Composite
- 12.13/100
- National rank
- #9655
- State rank
- #816 of 826 in TX
Livability — Hearne
- Score
- 66/100
- State rank
- #611
- US rank
- #11586
Category grades
Schools grade is shown separately in the Schools card above.
Census & demographics
- Census place
- Hearne, TX
- Population (ZIP)
- 7,516
Population outlook (Robertson County) Hauer SSP2
- Today (2025)
- 16,926 people
- By 2030
- 17,039 · +0.7%
- By 2040
- 17,217 · +1.7%
- By 2050
- 17,301 · +2.2%
- By 2075
- 17,849 · +5.5%
- By 2100
- 17,642 · +4.2%
Race, ethnicity, and origin ACS 2023
- Neighborhood character
- Diverse neighborhood (Simpson 0.67)
- Race & ethnicity
- White 40% Hispanic / Latino 30% Black 29% Two or more races 15%
- Hispanic origin (detail)
- Mexican 27%
- Common ancestry
- Romanian 3% Serbian 1% Italian 1%
- Foreign-born
- 8% · Canada
- Languages at home
- 78% English-only · Spanish 18% Arabic 3%
Political lean MEDSL · Robertson
- 2024 margin
- Solid R (+52.1) · D 23.6% · R 75.8%
- 2008→2024 swing
- -32.7pp toward R · 2008: -19.4pp · 2024: -52.1pp
- All cycles
- 2024: R+52.1 2020: R+40.4 2016: R+35.1 2012: R+22.3 2008: R+19.4
Not yet ingested
- Civics
- —
Market trends
- HPI YoY
- ▲ 17.97%
- Current HPI
- 177.7117
- Rent YoY
- —
- Metro
- —
- State GDP YoY
- ▲ 3.95%
- F500 in state
- 110
Industry mix (Fortune 500 HQ in TX)
| Industry | F500 HQs | Revenue |
|---|---|---|
| Energy | 16 | $1,198B |
|
||
| Technology | 5 | $198B |
|
||
| Engineering / Construction | 4 | $72B |
|
||
| Energy Services | 3 | $60B |
|
||
| Utilities | 3 | $41B |
|
||
| Healthcare | 2 | $330B |
|
||
Price history
-10.0% since first listed4 events — show timeline
- 2026-05-07 Pending — BCSRMLS
- 2026-05-07 Listed $100,800 BCSRMLS
- 2026-03-16 Price Changed $106,400 BCSRMLS
- 2026-01-29 Listed $112,000 BCSRMLS
Property tax history
+8.3%/yrLatest (2025): $4,493 · +0.6% YoY. Source: county tax records.
Cash-flow waterfall
monthlySold comps — $/sqft
last 12 mo · ≤1 miLoading sold comps…