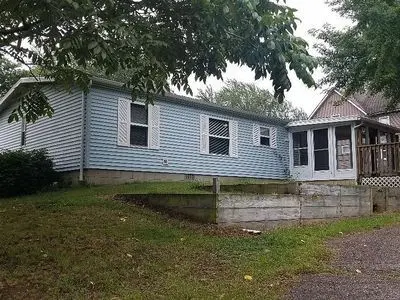
170 Thomas St · Coloma, MI
Flood risk 1/10 · Minimal
- FEMA flood zone
- X (unshaded)
- Chance of flooding over 30 yrs
- 0.0%
- Est. flood insurance / yr
- $473 – $860
Fire risk 1/10 · Minimal
- Est. fire insurance / yr
- $784 – $1,456
Heat risk 2/10 · Minimal
- Hot days now (above 100°F)
- 7 days/yr
- Hot days in 30 yrs
- 15 days/yr
Wind risk 2/10 · Minimal
- Chance of severe wind over 30 yrs
- —
Air-quality risk 4/10 · Minor
- Unhealthy air days now
- 4 days/yr
- Unhealthy air days in 30 yrs
- 7 days/yr
Risk factors via First Street. Map © Google.
Why this score? — see what drove the C+ grade
The composite is a weighted blend of 9 inputs, each scored 0–100. Each bar is that input's sub-score; the figure is the points it added to the 100-point composite (weight × sub-score).
- Cash flow +22.7/30.0
- ARV discount +15.0/15.0
- DSCR +7.3/10.0
- 1% rule +7.0/10.0
- Livability +3.7/5.0
- Rent growth +2.5/5.0
- Condition / age +2.5/5.0
- Schools +2.4/10.0
- Appreciation +0.0/10.0
$125,000
🖨 Deal sheet 📄 Offer letter ✓ Due diligence
Listing remarks
3 Bed 2 Bath manufactured home with 2 car detached garage. NO BANK LOANS as the title was never retired to the property so a bank will not loan directly against the property.
Key facts
- Built 1989
- Listed 22 days
Neighborhood map
What this means for you Summary
Snapshot
- This is a 3-bed/1.5-bath single-family listed at $125k.
Deal economics
- At list price, monthly cash flow is $216 ($3k/yr) — positive.
- The deal already cash-flows at list — no discount required.
- Meets the 1% rule at list price ($2k rent vs $125k).
- Recommended offer: $123k (1.5% below list) — sets the bar for market timing.
- Cap rate 8.4% vs local median 3.6% in Coloma — top-decile yield for the area; either an underpriced asset or a hidden risk that comps aren't pricing in. Stress-test before assuming the spread holds.
Location & tenants
- Location reads 73/100 on livability (#218 in MI) — a middle-class / working-renter tenant base. Strengths: cost of living A+, housing A+, health & safety A+; Watch: schools D+, amenities F, commute F.
- Coloma Community Schools (town): math 17% / reading 39% proficiency, ranked #384 of 540 in MI (top 71%) — low school quality limits family demand, transient renter base, plan for 1-2y turnover.
- Market conditions: 45 active listings in the ZIP; 1 comparable units currently listed for rent nearby; 397 units permitted in Berrien County in 2024 (40 in 5+ unit buildings).
Forward outlook
- Local home prices are declining (-3.0%/yr); year-one equity from $864 of loan paydown is wiped out by about $4k of value loss. Plan a longer hold.
- Berrien County population projected at -16% by 2050 — secular population decline; favor cash flow + early exit over multi-decade hold.
Negotiation context
- It's been on market 22 days — a 2% lower offer ($123k) is reasonable based on typical stale-listing flexibility.
- 10 sale attempts since 32y ago with the ask held roughly flat each time — persistent listings suggest the price (not the market) is what's stuck; bring a comps-based counter.
- Current owner paid $30k; list at $125k implies a 317% gain — meaningful room to come down on a strong offer.
Risks & watch-outs
- Watch-outs: property tax is 2.5% of price.
Questions for the listing agent
- Property tax is high relative to price — has the assessment been appealed recently, and will the sale trigger a re-assessment?
- Is there a deadline driving the sale (1031 exchange, divorce, estate, relocation)? That informs how much negotiation room exists.
- Schools are D-rated, which usually means shorter tenancies and higher turnover. Who's the typical renter profile here, and what's been the actual vacancy rate?
- What's the average days-on-market for RENTAL listings here right now (not sales)? A rising rental-DOM trend means longer vacancies and softer asking-rent achievability than the comps imply.
- What's the recent tenant-quality profile in this submarket — average credit score on applications, eviction rate, late-payment / NSF rate, and stable-employment percentage? A property-management company in the area should have these aggregated.
- How much new for-sale + rental construction is in the pipeline within 1–3 miles? Heavy new supply typically softens prices + rents 12–24 months out; constrained supply supports both.
Investment metrics
- 1% rule
- 1.20% ✓
- Cap rate
- 8.37%
- Cash-on-cash
- 7.40%
- DSCR
- 1.33
- GRM
- 6.9
CMA / ARV
- ARV (on-the-fly)
- $182,574
- Comps found
- 8
Show comp detail 8 sales within ~0.75 mi
| Address | Dist | Beds/Ba | Sqft | Sold | Price | $/sf | Match |
|---|---|---|---|---|---|---|---|
| 205 Sassafrass St | 0.12mi | 2/1.0 (-1) | 1,142 (+1%) | 1mo | $135,000 | $118 | 85 |
| 134 S Paw Paw St | 0.20mi | 3/1.0 | 1,138 (+0%) | 7mo | $20,000 | $18 | 82 |
| 6550 Red Arrow Hwy | 0.23mi | 3/1.0 | 1,135 (+0%) | 12mo | $172,300 | $152 | 77 |
| 274 E Logan St | 0.05mi | 3/1.0 | 1,260 (+11%) | 8mo | $175,000 | $139 | 71 |
| 321 E Center St | 0.15mi | 2/1.0 (-1) | 996 (-12%) | 2mo | $160,000 | $161 | 64 |
| 6754 Paw Paw Ave | 0.53mi | 3/2.0 | 1,254 (+11%) | 0mo | $235,250 | $188 | 55 |
| 375 Garry St | 0.72mi | 3/1.0 | 1,008 (-11%) | 5mo | $188,000 | $187 | 42 |
| 6735 Bayview Dr | 0.62mi | 2/1.0 (-1) | 1,036 (-9%) | 12mo | $230,000 | $222 | 39 |
Match score weights: distance 35% · size 25% · config 20% · recency 20%. Top-matched comps best support the ARV.
Projected returns pro-forma
-3.0% appreciation · 3.0% rent growth · sell at horizon
- IRR
- -4.9%
- Equity multiple
- 0.82×
- Total profit
- $-6,417
- Equity at exit
- $18,638
- IRR
- 4.8%
- Equity multiple
- 1.36×
- Total profit
- $12,473
- Equity at exit
- $10,808
Cash invested: $35,000 (down + closing). Projections, not guarantees.
Landlord ↔ Tenant lean methodology
- Overall (STATE)
- 62 Landlord-Friendly
- State Michigan
- 62 Landlord-Friendly · EVEN
- County
- — inherits STATE
- City
- — inherits STATE
ZIP-level market 49038
- Active inventory
- 45
- Price-to-rent
- 6.9×
Monthly cashflow live
- Estimated rent
- $1,500 medium interval (Pro) →
- Mortgage (P&I)
- −$656
- Tax from tax record
- −$262 /mo · $3,138/yr
- Insurance
- −$52
- HOA
- −$0
- Vacancy / Maint / Mgmt
- −$315
- Net cashflow
- $216
Break-even live
UW: 25.0% down · 7.5% · 30yr · 1.5% tax · 5.0% vac · 8.0% maint · 8.0% mgmt
Financing live
Cash to close
- Down payment
- $31,250
- Closing costs
- $3,750
- Reserves months
- —
- Total cash needed
- —
Loan-product check · same deal, 3 products live
Conventional
25% down · 7.5% · 30yr
- Down + closing
- —
- Monthly P&I
- —
- Monthly cashflow
- —
- DSCR
- —
- Eligible?
- —
Personal DTI + credit; lowest rate.
DSCR
20% down · 8.5% · 30yr
- Down + closing
- —
- Monthly P&I
- —
- Monthly cashflow
- —
- DSCR
- —
- Eligible?
- —
No personal income docs; deal must DSCR.
Hard money
10% down · 12.0% · 12mo
- Down + closing
- —
- Monthly P&I
- —
- Monthly cashflow
- —
- DSCR
- —
- Eligible?
- —
Short-term bridge; refi at stabilization.
Rent comps 1 comps
| Address | Beds | Baths | Sqft | Rent | $/sqft | DOM | Units | Dist |
|---|---|---|---|---|---|---|---|---|
| 460 N Paw Paw St Coloma, MI | 2.0 | 1.0 | 700 | $1,500 | $2.14 | 44d | 1 | 0.29mi |
Listing history 33 events
-
2026-06-18days on market $125,000 Active 22 DOM
-
2026-06-17days on market $125,000 Active 21 DOM
-
2026-06-16days on market $125,000 Active 20 DOM
-
2026-06-15days on market $125,000 Active 19 DOM
-
2026-06-13days on market $125,000 Active 17 DOM
-
2026-06-12days on market $125,000 Active 16 DOM
-
2026-06-09days on market $125,000 Active 13 DOM
-
2026-06-08days on market $125,000 Active 12 DOM
-
2026-06-07days on market $125,000 Active 11 DOM
-
2026-06-07days on market $125,000 Active 10 DOM
-
2026-06-04days on market $125,000 Active 7 DOM
-
2026-06-02days on market $125,000 Active 6 DOM
-
2026-06-01days on market $125,000 Active 5 DOM
-
2026-05-31days on market $125,000 Active 4 DOM
-
2026-05-31days on market $125,000 Active 3 DOM
-
2026-05-27$125,000 Active
-
2025-02-06historical $1,500
-
2024-12-27$1,500
-
2023-06-22historical
-
2014-09-25historical
-
2014-09-15historical
-
2010-04-08soldstatus $30,000
-
2010-04-08soldstatus $30,000
-
2010-01-11$26,900
-
2010-01-11$26,900
-
2010-01-09historical
-
2009-07-09$84,900
-
2009-07-09$84,900
-
1997-04-12historical
-
1996-10-12$74,900
-
1996-10-12$74,900
-
1994-05-04$62,000
-
1994-05-04$62,000
ⓘ Source: listings_history table (triggers on properties + properties_extension) + one-shot
backfill from property_details.listing_events for pre-trigger history.
Tax reassessment forecast MI · Partial reset (capped growth)
- Current annual tax
- $3,138 · $262/mo
- Projected year-2 tax
- $3,138 · $262/mo
- Expected delta
- $0/yr ($0/mo · 0.0%)
ⓘ Screening estimate from a state-policy table — verify with the county assessor before closing.
Climate risk First Street
- Flood 1/10 Low FEMA zone X (unshaded) · 0% chance over 30 yrs
- Wildfire 1/10 Low
- Heat 2/10 Low 7 d/yr ≥100°F today · 15 d/yr by 30 yrs out
- Wind 2/10 Low
- Air quality 4/10 Moderate 4 unhealthy d/yr today · 7 by 30 yrs out
Nearby sold comps map
Loading sold comps map…
Walkable amenities ~0.75 mi
Loading nearby amenities…
Taxation est. · year 1
- Rental income
- $18,000
- − Mortgage interest
- −$7,002
- − Property taxes
- −$3,138
- − Insurance
- −$625
- − Repairs & maintenance
- −$1,440
- − Management
- −$1,440
- − Depreciation
- −$3,636
- Taxable income
- $719
- Est. tax owed @ 24.0%
- −$172
- After-tax cash flow
- $2,418/yr
For passive investors: Depreciation is non-cash, so a rental often shows a tax loss while cash-flowing — sheltering income. Rental losses are passive: they offset passive income freely, and up to $25,000/yr can offset ordinary (W-2) income if you actively participate and your MAGI is under $100k (phasing out to $0 by $150k); unused losses carry forward. On sale, claimed depreciation is recaptured at up to 25%, and gains may owe capital-gains tax (a 1031 exchange can defer both). Figures are a year-1 estimate at your 24.0% rate — not tax advice; consult a CPA.
Schools (NCES district)
- District
- Coloma Community Schools
- NCES district ID
- 2610380
- Math proficiency
- 17% ▼ -5.00%
- Reading proficiency
- 39% ▲ 2.00%
- Median HH income
- $48,135
- Composite
- 24.28/100
- National rank
- #7715
- State rank
- #384 of 540 in MI
Livability — Coloma
- Score
- 73/100
- State rank
- #218
- US rank
- #5399
Category grades
Schools grade is shown separately in the Schools card above.
Census & demographics
- Census place
- Coloma, MI
- Population (ZIP)
- 8,577
Population outlook (Berrien County) Hauer SSP2
- Today (2025)
- 149,273 people
- By 2030
- 145,211 · -2.7%
- By 2040
- 135,435 · -9.3%
- By 2050
- 125,543 · -15.9%
- By 2075
- 103,986 · -30.3%
- By 2100
- 82,256 · -44.9%
Race, ethnicity, and origin ACS 2023
- Neighborhood character
- Predominantly White (82%)
- Race & ethnicity
- White 82% Two or more races 9% Black 6% Hispanic / Latino 4%
- Common ancestry
- Italian 4% Romanian 4% Iranian 3%
- Foreign-born
- 3% · Canada
- Languages at home
- 96% English-only · Spanish 2% Other Indo-European 1% German/W. Germanic 1%
Political lean MEDSL · Berrien
- 2024 margin
- Lean R (+7.9) · D 45.4% · R 53.2% · Other 1.4%
- 2008→2024 swing
- -13.3pp toward R · 2008: 5.5pp · 2024: -7.9pp
- All cycles
- 2024: R+7.9 2020: R+7.4 2016: R+12.7 2012: R+6.6 2008: D+5.5
Not yet ingested
- Civics
- —
Market trends
- HPI YoY
- ▼ -149.33%
- Current HPI
- 237.5873
- Rent YoY
- —
- Metro
- —
- State GDP YoY
- ▲ 1.37%
- F500 in state
- 28
Industry mix (Fortune 500 HQ in MI)
| Industry | F500 HQs | Revenue |
|---|---|---|
| Automotive Parts | 3 | $48B |
|
||
| Automotive | 2 | $372B |
|
||
| Chemicals | 1 | $45B |
|
||
| Automotive Retail | 1 | $29B |
|
||
| Healthcare / Medical Devices | 1 | $23B |
|
||
| Automotive Technology | 1 | $20B |
|
||
Price history
+101.6% since first listed18 events — show timeline
- 2026-05-27 Listed $125,000 FSBO.com
- 2025-02-06 Rental Removed $1,500 RENTEC
- 2024-12-27 Listed for Rent $1,500 RENTEC
- 2023-06-22 Rental Removed — RENTEC
- 2014-09-25 Listing Removed — SW Michigan MLS
- 2014-09-15 Listing Removed — SW Michigan MLS
- 2010-04-08 Sold (MLS) $30,000 REALCOMP
- 2010-04-08 Sold (MLS) $30,000 SW Michigan MLS
- 2010-01-11 Listed $26,900 REALCOMP
- 2010-01-11 Listed $26,900 SW Michigan MLS
- 2010-01-09 Listing Removed — REALCOMP
- 2009-07-09 Listed $84,900 REALCOMP
- 2009-07-09 Listed $84,900 SW Michigan MLS
- 1997-04-12 Listing Removed — REALCOMP
- 1996-10-12 Listed $74,900 REALCOMP
- 1996-10-12 Listed $74,900 SW Michigan MLS
- 1994-05-04 Listed $62,000 SW Michigan MLS
- 1994-05-04 Listed $62,000 REALCOMP
Property tax history
+11.9%/yrLatest (2024): $3,138 · +4.6% YoY. Source: county tax records.
Cash-flow waterfall
monthlySold comps — $/sqft
last 12 mo · ≤1 miLoading sold comps…