2003 Gallia Ave · Gallipolis, OH
Flood risk 8/10 · Major
- FEMA flood zone
- AE
- Chance of flooding over 30 yrs
- 0.92%
- Est. flood insurance / yr
- $2,026 – $9,024
Fire risk 4/10 · Minor
- Est. fire insurance / yr
- $713 – $1,323
Heat risk 5/10 · Moderate
- Hot days now (above 102°F)
- 7 days/yr
- Hot days in 30 yrs
- 19 days/yr
Wind risk 2/10 · Minimal
- Chance of severe wind over 30 yrs
- 1.0%
Air-quality risk 1/10 · Minimal
- Unhealthy air days now
- 0 days/yr
- Unhealthy air days in 30 yrs
- 0 days/yr
Risk factors via First Street. Map © Google.
Why this score? — see what drove the B- grade
The composite is a weighted blend of 9 inputs, each scored 0–100. Each bar is that input's sub-score; the figure is the points it added to the 100-point composite (weight × sub-score).
- Cash flow +30.0/30.0
- 1% rule +10.0/10.0
- DSCR +10.0/10.0
- ARV discount +7.5/15.0
- Schools +3.9/10.0
- Livability +3.1/5.0
- Rent growth +2.5/5.0
- Condition / age +2.5/5.0
- Appreciation +0.0/10.0
$45,000
🖨 Deal sheet 📄 Offer letter ✓ Due diligence
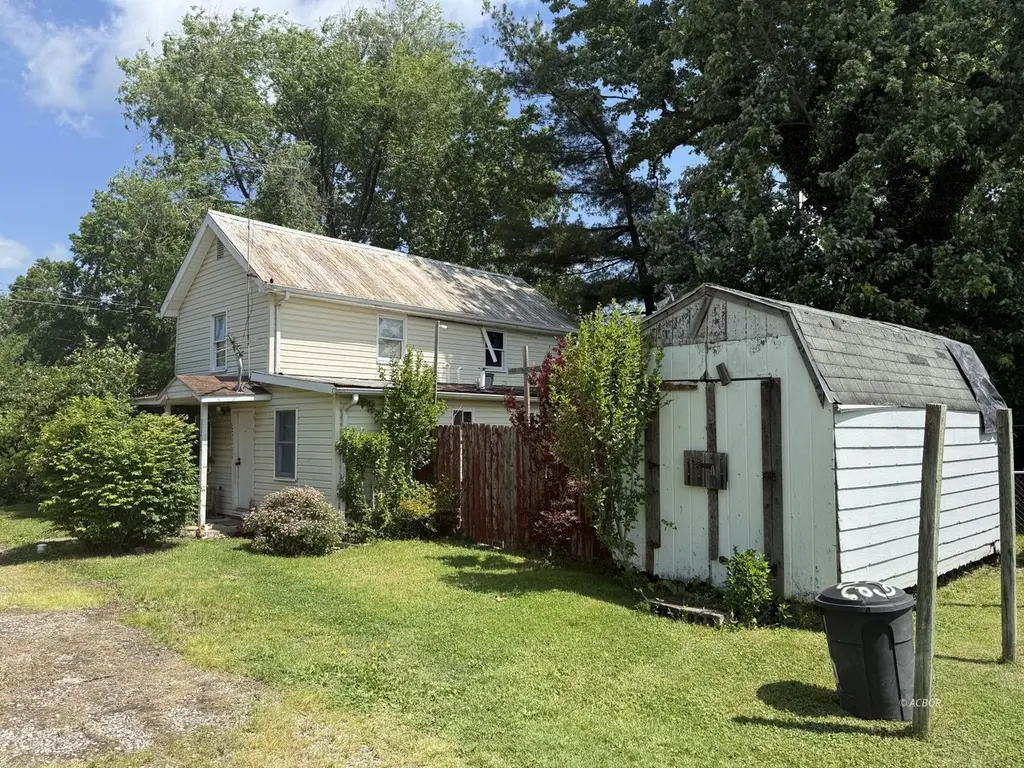
Listing remarks
This home can be a nice investment property or home with some tender, love, and care. It is conveniently located close to amenities within walking distance. It hosts 2-3 bedrooms and one full bath, living and kitchen. The back yard is fenced in and has a shelter house for hosting outside functions. (A small room downstairs was used as a bedroom, can be used otherwise). Second bedroom upstairs is not in photos yet. Whether you are looking for another rental or a place to fix up to be home, this home could be your next adventure.
Key facts
- Walking distance
- Investment property
- Fenced in back yard
Tags
Property features AI
Exterior
- Utilities: Natural gas available
- Home design: Single-family residence; 2 stories; Residential zoning (R-1)
- Construction: Vinyl siding; Metal roof
- Exterior features: Fenced yard; Outbuilding
Interior
- Kitchen: Gas oven; Gas range; Refrigerator
- Flooring: Carpet; Laminate; Linoleum
- Bathrooms: 1 full bathroom
- Heating & cooling: Natural gas heating; Window air conditioning units
- Interior features: Gas water heater; 6 total rooms; No basement
Neighborhood map
What this means for you Summary
Snapshot
- This is a 3-bed/1.0-bath single-family listed at $45k.
Deal economics
- At list price, monthly cash flow is $190 ($2k/yr) — positive.
- The deal already cash-flows at list — no discount required.
- Meets the 1% rule at list price ($1k rent vs $45k).
- Cap rate 23.7% vs local median 4.5% in Gallipolis — top-decile yield for the area; either an underpriced asset or a hidden risk that comps aren't pricing in. Stress-test before assuming the spread holds.
Location & tenants
- Location reads 62/100 on livability (#910 in OH) — a middle-class / working-renter tenant base. Strengths: cost of living A+, housing B; Watch: employment C-, crime F, amenities F.
- Gallipolis City (rural): math 39% / reading 56% proficiency, ranked #488 of 656 in OH (top 74%) — families likely to look elsewhere, expect single-tenant / working-renter base with shorter leases.
- Market conditions: 68 active listings in the ZIP; 10 units permitted in Gallia County in 2024 (0 in 5+ unit buildings).
Forward outlook
- Local home prices are declining (-3.0%/yr); year-one equity from $311 of loan paydown is wiped out by about $1k of value loss. Plan a longer hold.
- Gallia County population projected at -24% by 2050 — secular population decline; favor cash flow + early exit over multi-decade hold.
- At projected returns (-3.0% appreciation + 3.0% rent growth), your $13k cash investment doubles in ~7 years — after that, you're playing with house money.
Negotiation context
- Only 8 days on market — expect competitive offers; lowballing is unlikely to land.
Risks & watch-outs
- Watch-outs: flood insurance adds $460/mo; built in 1900 — expect roof / HVAC / electrical / plumbing capex.
- Climate carrying-cost: in FEMA flood zone AE (mandatory federal flood insurance); extreme-heat days projected 7→19/yr by 2055 (HVAC capex compounding) — expect insurance premiums to compound above CPI over the hold.
Questions for the listing agent
- Built in 1900 — when were the roof, HVAC, electrical panel, plumbing, and water heater last replaced?
- What's the actual annual flood-insurance premium (NFIP or private), and is the property in a SFHA with mandatory coverage?
- Is there a deadline driving the sale (1031 exchange, divorce, estate, relocation)? That informs how much negotiation room exists.
- Crime grade is F in this area — have there been break-ins, vandalism, or insurance claims at this property in the last 3 years? What carrier currently insures it and at what premium?
- What's the average days-on-market for RENTAL listings here right now (not sales)? A rising rental-DOM trend means longer vacancies and softer asking-rent achievability than the comps imply.
- What's the recent tenant-quality profile in this submarket — average credit score on applications, eviction rate, late-payment / NSF rate, and stable-employment percentage? A property-management company in the area should have these aggregated.
- How much new for-sale + rental construction is in the pipeline within 1–3 miles? Heavy new supply typically softens prices + rents 12–24 months out; constrained supply supports both.
Investment metrics
- 1% rule
- 2.61% ✓
- Cap rate
- 23.65%
- Cash-on-cash
- 61.99%
- DSCR
- 3.76
- GRM
- 3.2
CMA / ARV
- ARV (median comp)
- $153,242
- List price
- $45,000
- Delta
- -70.63%
- Verdict
- UNDERPRICED
- Comps
- 2 within 1.0 mi
Projected returns pro-forma
-3.0% appreciation · 3.0% rent growth · sell at horizon
- IRR
- 10.2%
- Equity multiple
- 1.41×
- Total profit
- $5,120
- Equity at exit
- $6,710
- IRR
- 19.7%
- Equity multiple
- 2.68×
- Total profit
- $21,218
- Equity at exit
- $3,891
Cash invested: $12,600 (down + closing). Projections, not guarantees.
Landlord ↔ Tenant lean methodology
- Overall (STATE)
- 73 Landlord-Friendly
- State Ohio
- 73 Landlord-Friendly · R+6
- County
- — inherits STATE
- City
- — inherits STATE
ZIP-level market 45631
- Home prices YoY
- -8.6%
- Active inventory
- 68
- Price-to-rent
- 3.2×
Monthly cashflow live
- Estimated rent
- $1,175 medium interval (Pro) →
- Mortgage (P&I)
- −$236
- Tax from tax record
- −$22 /mo · $269/yr
- Insurance
- −$19
- Flood insurance flood zone
- −$460 /mo · $5,525/yr
- HOA
- −$0
- Vacancy / Maint / Mgmt
- −$247
- Net cashflow
- $190
Break-even live
UW: 25.0% down · 7.5% · 30yr · 1.5% tax · 5.0% vac · 8.0% maint · 8.0% mgmt
Financing live
Cash to close
- Down payment
- $11,250
- Closing costs
- $1,350
- Reserves months
- —
- Total cash needed
- —
Loan-product check · same deal, 3 products live
Conventional
25% down · 7.5% · 30yr
- Down + closing
- —
- Monthly P&I
- —
- Monthly cashflow
- —
- DSCR
- —
- Eligible?
- —
Personal DTI + credit; lowest rate.
DSCR
20% down · 8.5% · 30yr
- Down + closing
- —
- Monthly P&I
- —
- Monthly cashflow
- —
- DSCR
- —
- Eligible?
- —
No personal income docs; deal must DSCR.
Hard money
10% down · 12.0% · 12mo
- Down + closing
- —
- Monthly P&I
- —
- Monthly cashflow
- —
- DSCR
- —
- Eligible?
- —
Short-term bridge; refi at stabilization.
Listing history 1 events
-
2026-05-14$45,000 Active 533-char remark
ⓘ Source: listings_history table (triggers on properties + properties_extension) + one-shot
backfill from property_details.listing_events for pre-trigger history.
Tax reassessment forecast OH · Partial reset (capped growth)
- Current annual tax
- $269 · $22/mo
- Projected year-2 tax
- $486 · $40/mo
- Expected delta
- +$216/yr (+$18/mo · 80.4%)
ⓘ Screening estimate from a state-policy table — verify with the county assessor before closing.
Climate risk First Street
- Flood 8/10 Severe FEMA zone AE · 92% chance over 30 yrs
- Wildfire 4/10 Moderate
- Heat 5/10 Major 7 d/yr ≥102°F today · 19 d/yr by 30 yrs out
- Wind 2/10 Low 100% chance of damaging wind over 30 yrs
- Air quality 1/10 Low 0 unhealthy d/yr today · 0 by 30 yrs out
Nearby sold comps map
Loading sold comps map…
Walkable amenities ~0.75 mi
Loading nearby amenities…
Taxation est. · year 1
- Rental income
- $14,097
- − Mortgage interest
- −$2,521
- − Property taxes
- −$269
- − Insurance
- −$5,750
- − Repairs & maintenance
- −$1,128
- − Management
- −$1,128
- − Depreciation
- −$1,309
- Taxable income
- $1,993
- Est. tax owed @ 24.0%
- −$478
- After-tax cash flow
- $1,808/yr
For passive investors: Depreciation is non-cash, so a rental often shows a tax loss while cash-flowing — sheltering income. Rental losses are passive: they offset passive income freely, and up to $25,000/yr can offset ordinary (W-2) income if you actively participate and your MAGI is under $100k (phasing out to $0 by $150k); unused losses carry forward. On sale, claimed depreciation is recaptured at up to 25%, and gains may owe capital-gains tax (a 1031 exchange can defer both). Figures are a year-1 estimate at your 24.0% rate — not tax advice; consult a CPA.
Schools (NCES district)
- District
- Gallipolis City
- NCES district ID
- 3904403
- Math proficiency
- 39% ▼ -22.00%
- Reading proficiency
- 56% ▼ -6.00%
- Median HH income
- $37,983
- Composite
- 39.49/100
- National rank
- #3952
- State rank
- #488 of 656 in OH
Livability — Gallipolis
- Score
- 62/100
- State rank
- #910
- US rank
- #17199
Category grades
Schools grade is shown separately in the Schools card above.
Census & demographics
- Census place
- Gallipolis, OH
- County
- Gallia · 29,277 people
- Population (ZIP)
- 12,669
- Household income
- $54,772
- Rent vs Own
- Severe rent burden
- 9.1
Population outlook (Gallia County) Hauer SSP2
- Today (2025)
- 27,936 people
- By 2030
- 26,605 · -4.8%
- By 2040
- 23,876 · -14.5%
- By 2050
- 21,336 · -23.6%
- By 2075
- 16,414 · -41.2%
- By 2100
- 13,192 · -52.8%
Race, ethnicity, and origin ACS 2023
- Neighborhood character
- Predominantly White (92%)
- Race & ethnicity
- White 92% Two or more races 3% Black 3% Hispanic / Latino 1%
- Common ancestry
- Slovak 3% Lithuanian 3% Italian 1%
- Foreign-born
- 1%
- Languages at home
- 97% English-only · Spanish 1% German/W. Germanic 1%
Political lean MEDSL · Gallia
- 2024 margin
- Solid R (+59.4) · D 19.9% · R 79.3%
- 2008→2024 swing
- -33.3pp toward R · 2008: -26.1pp · 2024: -59.4pp
- All cycles
- 2024: R+59.4 2020: R+55.5 2016: R+55.6 2012: R+26.2 2008: R+26.1
Not yet ingested
- Civics
- —
Market trends
- HPI YoY
- ▼ -19.11%
- Current HPI
- 203.6153
- Rent YoY
- —
- Metro
- —
- State GDP YoY
- ▲ 1.98%
- F500 in state
- 48
Industry mix (Fortune 500 HQ in OH)
| Industry | F500 HQs | Revenue |
|---|---|---|
| Insurance | 3 | $145B |
|
||
| Industrial Machinery | 3 | $49B |
|
||
| Financial Services | 3 | $24B |
|
||
| Consumer Goods | 2 | $93B |
|
||
| Aerospace / Defense | 2 | $47B |
|
||
| Utilities | 2 | $33B |
|
||
Price history
2 events — show timeline
- 2026-05-22 Pending — ACBOR
- 2026-05-14 Listed $45,000 ACBOR
Property tax history
-7.0%/yrLatest (2025): $269 · -4.4% YoY. Source: county tax records.
Cash-flow waterfall
monthlySold comps — $/sqft
last 12 mo · ≤1 miLoading sold comps…