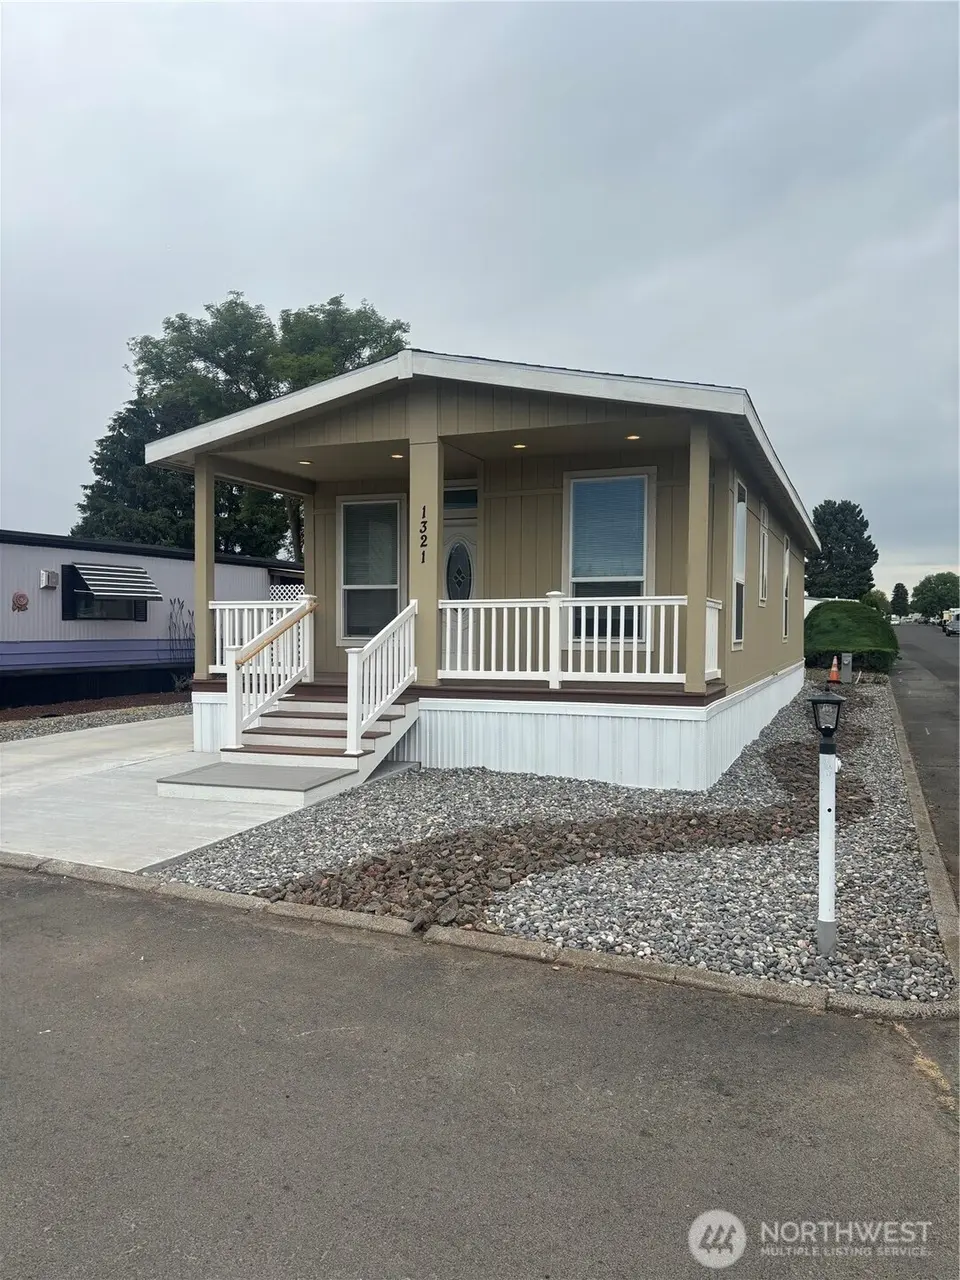
1321 Fort · Walla Walla, WA
Flood risk No data
- FEMA flood zone
- —
- Chance of flooding over 30 yrs
- —
- Est. flood insurance / yr
- —
Fire risk No data
- Est. fire insurance / yr
- —
Heat risk No data
- Hot days now (above threshold)
- —
- Hot days in 30 yrs
- —
Wind risk No data
- Chance of severe wind over 30 yrs
- —
Air-quality risk No data
- Unhealthy air days now
- —
- Unhealthy air days in 30 yrs
- —
Risk factors via First Street. Map © Google.
Why this score? — see what drove the C- grade
The composite is a weighted blend of 9 inputs, each scored 0–100. Each bar is that input's sub-score; the figure is the points it added to the 100-point composite (weight × sub-score).
- Cash flow +20.9/30.0
- ARV discount +7.5/15.0
- DSCR +6.7/10.0
- 1% rule +4.4/10.0
- Schools +4.1/10.0
- Livability +4.0/5.0
- Condition / age +4.0/5.0
- Rent growth +3.1/5.0
- Appreciation +0.0/10.0
$164,000
🖨 Deal sheet 📄 Offer letter ✓ Due diligence
Listing remarks
ALL AGES WELCOME! 1 YEAR FREE RENT WITH ACCEPTABLE OFFER! New 2 bedroom, 2 bath manufactured home, located in Rancho Villa. Open concept living w/ a spacious living & dining room. Kitchen has ample counter & cupboard space. Island w/ bar seating & more storage. Tiled backsplash. New appliances in the kitchen are included. Neutral colors throughout. Primary bedroom w/ large closet. Primary bathroom w/ step-in shower. 2nd bedroom plus full guest bathroom. Separate utility room. You will enjoy the community park, walking trails nearby & clubhouse for residents. Close to shopping & restaurants. Buyer must be approved by park management. Heat pump and Carport to be
Key facts
- Ample counter space
- Open concept living
- Large closet
Tags
Property features AI
Finance
- Other: Property type: Residential - Manufactured Home
- Financial info: Listing terms: Cash, Conventional
- HOA & community: Land lease: $650
Exterior
- Parking: Carport
- Utilities: Electric energy source; Public water; Public sewer
- Home design: Manufactured double-wide home; Single level; Manufactured after 6/15/1976; Very good condition; Mobile home remains; Tie-down foundation
- Construction: Wood construction; Composition roof
- Exterior features: Wood exterior products; Corner lot; Clubhouse (manufactured home park amenity)
Interior
- Kitchen: Dishwasher, Refrigerator, Stove/Range
- Bedrooms: 2 bedrooms
- Flooring: Vinyl plank; Carpet
- Bathrooms: 1 full bathroom; 1 three-quarter bathroom; 1 bathtub; 2 showers
- Heating & cooling: Forced air heating; Forced air cooling
- Interior features: Dishwasher, Refrigerator, Stove/Range; Vinyl plank and carpet flooring
Neighborhood map
What this means for you Summary
Snapshot
- This is a 3-bed/2.0-bath manufactured listed at $164k. Condition is rated good.
Deal economics
- At list price, monthly cash flow is $230 ($3k/yr) — positive.
- The deal already cash-flows at list — no discount required.
- To meet the 1% rule (rent ≥ 1% of price), the offer needs to be $154k (5.9% below list).
- Recommended offer: $154k (5.9% below list) — sets the bar for 1% rule.
- Cap rate 8.0% vs local median 2.3% in Walla Walla — top-decile yield for the area; either an underpriced asset or a hidden risk that comps aren't pricing in. Stress-test before assuming the spread holds.
Location & tenants
- Location reads 79/100 on livability (#105 in WA, #2,015 nationally) — a middle-class / working-renter tenant base. Strengths: amenities A+, commute A+, housing A+; Watch: schools C-.
- Walla Walla Public Schools (urban): math 41% / reading 50% proficiency, ranked #179 of 291 in WA (top 62%) — families likely to look elsewhere, expect single-tenant / working-renter base with shorter leases.
- Market conditions: Rents rising (+2.4%/yr); 422 active listings in the ZIP; 11 comparable units currently listed for rent nearby; rentals lingering (median 44d on market — plan ~5-8 weeks vacancy on turnover, expect pricing pressure); 100% of comp listings sitting > 30 days — soft ceiling on asking rent; 206 units permitted in Walla Walla County in 2024 (50 in 5+ unit buildings).
Forward outlook
- Local home prices are declining (-3.0%/yr); year-one equity from $1k of loan paydown is wiped out by about $5k of value loss. Plan a longer hold.
- Walla Walla County population projected at +8% by 2050 — modest demand growth; plan on rents tracking national, not racing it.
Negotiation context
- Only 14 days on market — expect competitive offers; lowballing is unlikely to land.
Questions for the listing agent
- Is there a deadline driving the sale (1031 exchange, divorce, estate, relocation)? That informs how much negotiation room exists.
- What's the average days-on-market for RENTAL listings here right now (not sales)? A rising rental-DOM trend means longer vacancies and softer asking-rent achievability than the comps imply.
- What's the recent tenant-quality profile in this submarket — average credit score on applications, eviction rate, late-payment / NSF rate, and stable-employment percentage? A property-management company in the area should have these aggregated.
- How much new for-sale + rental construction is in the pipeline within 1–3 miles? Heavy new supply typically softens prices + rents 12–24 months out; constrained supply supports both.
Investment metrics
- 1% rule
- 0.94% ✗
- Cap rate
- 7.97%
- Cash-on-cash
- 6.00%
- DSCR
- 1.27
- GRM
- 8.9
CMA / ARV
- ARV (on-the-fly)
- $49,140
- Comps found
- 11
Show comp detail 11 sales within ~0.75 mi
| Address | Dist | Beds/Ba | Sqft | Sold | Price | $/sf | Match |
|---|---|---|---|---|---|---|---|
| 1315 Dixie Ln | 0.03mi | 2/2.0 (-1) | 924 (+2%) | 0mo | $44,000 | $48 | 90 |
| 1308 Fort Ln | 0.03mi | 2/2.0 (-1) | 924 (+2%) | 10mo | $18,500 | $20 | 83 |
| 1240 Jones Dr | 0.28mi | 3/2.0 | 938 (+3%) | 2mo | $60,000 | $64 | 80 |
| 1317 Fort Ln | 0.01mi | 2/1.0 (-1) | 924 (+2%) | 21mo | $49,000 | $53 | 71 |
| 1309 Tollgate Ln | 0.07mi | 2/1.0 (-1) | 882 (-3%) | 23mo | $17,000 | $19 | 64 |
| 1308 Samuel Dr | 0.25mi | 2/1.0 (-1) | 826 (-9%) | 5mo | $45,000 | $54 | 60 |
| 1218 Arkansas | 0.31mi | 2/2.0 (-1) | 1,000 (+10%) | 13mo | $159,000 | $159 | 53 |
| 1205 Arkansas Dr | 0.33mi | 2/1.0 (-1) | 840 (-8%) | 12mo | $65,000 | $77 | 53 |
| 1253 Arkansas Dr | 0.34mi | 2/1.0 (-1) | 800 (-12%) | 6mo | $44,900 | $56 | 50 |
| 1264 Jones Dr | 0.30mi | 2/2.0 (-1) | 1,040 (+14%) | 10mo | $125,000 | $120 | 49 |
| 1306 Dixie Ln | 0.03mi | 2/1.0 (-1) | 784 (-14%) | 23mo | $15,000 | $19 | 48 |
Match score weights: distance 35% · size 25% · config 20% · recency 20%. Top-matched comps best support the ARV.
Projected returns pro-forma
-3.0% appreciation · 2.4% rent growth · sell at horizon
- IRR
- -7.7%
- Equity multiple
- 0.72×
- Total profit
- $-12,947
- Equity at exit
- $24,453
- IRR
- 1.1%
- Equity multiple
- 1.08×
- Total profit
- $3,532
- Equity at exit
- $14,180
Cash invested: $45,920 (down + closing). Projections, not guarantees.
Landlord ↔ Tenant lean methodology
- Overall (STATE)
- 28 Tenant-Leaning
- State Washington
- 28 Tenant-Leaning · D+8
- County
- — inherits STATE
- City
- — inherits STATE
ZIP-level market 99362
- Rents YoY
- 2.4%
- Active inventory
- 422
- Price-to-rent
- 8.9×
Monthly cashflow live
- Estimated rent
- $1,543 high interval (Pro) →
- Mortgage (P&I)
- −$860
- Tax from tax record
- −$61 /mo · $737/yr
- Insurance
- −$68
- HOA
- −$0
- Vacancy / Maint / Mgmt
- −$324
- Net cashflow
- $230
Break-even live
UW: 25.0% down · 7.5% · 30yr · 1.5% tax · 5.0% vac · 8.0% maint · 8.0% mgmt
Financing live
Cash to close
- Down payment
- $41,000
- Closing costs
- $4,920
- Reserves months
- —
- Total cash needed
- —
Loan-product check · same deal, 3 products live
Conventional
25% down · 7.5% · 30yr
- Down + closing
- —
- Monthly P&I
- —
- Monthly cashflow
- —
- DSCR
- —
- Eligible?
- —
Personal DTI + credit; lowest rate.
DSCR
20% down · 8.5% · 30yr
- Down + closing
- —
- Monthly P&I
- —
- Monthly cashflow
- —
- DSCR
- —
- Eligible?
- —
No personal income docs; deal must DSCR.
Hard money
10% down · 12.0% · 12mo
- Down + closing
- —
- Monthly P&I
- —
- Monthly cashflow
- —
- DSCR
- —
- Eligible?
- —
Short-term bridge; refi at stabilization.
Rent comps 11 comps
| Address | Beds | Baths | Sqft | Rent | $/sqft | DOM | Units | Dist |
|---|---|---|---|---|---|---|---|---|
| 208 Marjorie Pl Unit marj208 Walla Walla, WA | 3.0 | 2.0 | 1080 | $1,295 | $1.20 | 43d | 1 | 0.86mi |
| 1914 Sunset Dr Unit 1914SUN-B Walla Walla, WA | 2.0 | 1.5 | 952 | $1,625 | $1.71 | 43d | 1 | 0.91mi |
| 101 Kenwood St #205 Walla Walla, WA | 2.0 | 1.0 | 845 | $1,325 | $1.57 | 43d | 1 | 0.95mi |
| 942 NE Spitzenburg St Apt B104 College Place, WA | 2.0 | 1.5 | 975 | $1,530 | $1.57 | 43d | 1 | 1.01mi |
| 831 S 2nd Ave #2 Walla Walla, WA | 2.0 | 1.0 | 620 | $1,495 | $2.41 | 43d | 1 | 1.16mi |
| 332 S 3rd Ave Walla Walla, WA | 2.0 | 1.0 | 1084 | $1,630 | $1.50 | 43d | 1 | 1.19mi |
| 255 Elder Pl #3 College Place, WA | 2.0 | 1.0 | 889 | $1,415 | $1.59 | 43d | 1 | 1.34mi |
| 2121 S 2nd Ave Apt 304 Walla Walla, WA | 2.0 | 1.5 | 975 | $1,530 | $1.57 | 43d | 1 | 1.39mi |
| 420 Catherine St #3 Walla Walla, WA | 2.0 | 1.0 | 890 | $1,295 | $1.46 | 43d | 1 | 1.41mi |
| 705 SE Scenic View Dr Unit 2 TOP FLOOR College Place, WA | 2.0 | 1.0 | 800 | $1,450 | $1.81 | 43d | 1 | 1.46mi |
| 211 SE 3rd St Unit Irisview 327-101 College Place, WA | 2.0 | 1.0 | 800 | $1,295 | $1.62 | 43d | 1 | 1.46mi |
Listing history 11 events
-
2026-06-19days on market $164,000 Active 14 DOM
-
2026-06-18days on market $164,000 Active 13 DOM
-
2026-06-17days on market $164,000 Active 12 DOM
-
2026-06-16days on market $164,000 Active 11 DOM
-
2026-06-15days on market $164,000 Active 10 DOM
-
2026-06-14days on market $164,000 Active 8 DOM
-
2026-06-12days on market $164,000 Active 7 DOM
-
2026-06-09days on market $164,000 Active 4 DOM
-
2026-06-08days on market $164,000 Active 3 DOM
-
2026-06-07remarks 679-char remark
-
2026-06-07$164,000 Active 2 DOM
ⓘ Source: listings_history table (triggers on properties + properties_extension) + one-shot
backfill from property_details.listing_events for pre-trigger history.
Tax reassessment forecast WA · Resets to sale price
- Current annual tax
- $737 · $61/mo
- Projected year-2 tax
- $1,607 · $134/mo
- Expected delta
- +$871/yr (+$73/mo · 118.2%)
ⓘ Screening estimate from a state-policy table — verify with the county assessor before closing.
Nearby sold comps map
Loading sold comps map…
Walkable amenities ~0.75 mi
Loading nearby amenities…
Taxation est. · year 1
- Rental income
- $18,521
- − Mortgage interest
- −$9,187
- − Property taxes
- −$737
- − Insurance
- −$820
- − Repairs & maintenance
- −$1,482
- − Management
- −$1,482
- − Depreciation
- −$4,771
- Taxable income
- $43
- Est. tax owed @ 24.0%
- −$10
- After-tax cash flow
- $2,744/yr
For passive investors: Depreciation is non-cash, so a rental often shows a tax loss while cash-flowing — sheltering income. Rental losses are passive: they offset passive income freely, and up to $25,000/yr can offset ordinary (W-2) income if you actively participate and your MAGI is under $100k (phasing out to $0 by $150k); unused losses carry forward. On sale, claimed depreciation is recaptured at up to 25%, and gains may owe capital-gains tax (a 1031 exchange can defer both). Figures are a year-1 estimate at your 24.0% rate — not tax advice; consult a CPA.
Condition & rehab AI · 12 photos
This manufactured home is in good condition with recent updates, making it move-in ready and suitable for both resale and rental.
Value-add opportunities
- Both Painting exterior and interior walls — Enhances curb appeal and interior aesthetics.
- Both Landscaping improvements — Enhances curb appeal and adds value.
- Both New flooring in bathrooms — Improves functionality and aesthetics in bathrooms.
- Both New lighting fixtures — Enhances interior aesthetics and functionality.
Renovation cost estimate screening
Value-add ROI direction
- Both Painting exterior and interior walls — Enhances curb appeal and interior aesthetics. ↑
- Both Landscaping improvements — Enhances curb appeal and adds value. ↑
- Both New flooring in bathrooms — Improves functionality and aesthetics in bathrooms. ↑
- Both New lighting fixtures — Enhances interior aesthetics and functionality. ↑
ⓘ Cost ranges are severity-bucket heuristics (US national rule-of-thumb). Get contractor quotes + a written scope before underwriting a rehab budget.
Schools (NCES district)
- District
- Walla Walla Public Schools
- NCES district ID
- 5309450
- Math proficiency
- 41% ▲ 3.00%
- Reading proficiency
- 50% ▼ -1.00%
- Median HH income
- $46,207
- Composite
- 40.88/100
- National rank
- #7531
- State rank
- #179 of 291 in WA
Livability — Walla Walla
- Score
- 79/100
- State rank
- #105
- US rank
- #2015
Category grades
Schools grade is shown separately in the Schools card above.
Census & demographics
- Census place
- Walla Walla, WA
- County
- Walla Walla County · 52,990 people
- City population
- 42,853
- Metro
- Walla Walla, WA
- Population (ZIP)
- 42,853
- Household income
- $72,474
- Rent vs Own
- Severe rent burden
- 1238.0
Population outlook (Walla Walla County) Hauer SSP2
- Today (2025)
- 63,088 people
- By 2030
- 64,417 · +2.1%
- By 2040
- 66,563 · +5.5%
- By 2050
- 68,337 · +8.3%
- By 2075
- 73,235 · +16.1%
- By 2100
- 74,878 · +18.7%
Race, ethnicity, and origin ACS 2023
- Neighborhood character
- Predominantly White (69%)
- Race & ethnicity
- White 69% Hispanic / Latino 22% Two or more races 9% Black 2% Asian 2% Native American 2%
- Hispanic origin (detail)
- Mexican 17%
- Common ancestry
- Slovak 3% Portuguese 3% Lithuanian 3%
- Foreign-born
- 9% · Canada, China
- Languages at home
- 83% English-only · Spanish 15% Chinese 1%
Political lean MEDSL · Walla Walla
- 2024 margin
- Lean R (+8.1) · D 44.6% · R 52.7% · Other 2.7%
- 2008→2024 swing
- +8.5pp toward D · 2008: -16.6pp · 2024: -8.1pp
- All cycles
- 2024: R+8.1 2020: R+8.7 2016: R+16.4 2012: R+22.3 2008: R+16.6
Not yet ingested
- Civics
- —
Market trends
- HPI YoY
- ▼ -488.03%
- Current HPI
- 321.6891
- Rent YoY
- ▲ 2.40%
- Metro
- Walla Walla, WA
- State GDP YoY
- ▲ 4.65%
- F500 in state
- 22
Industry mix (Fortune 500 HQ in WA)
| Industry | F500 HQs | Revenue |
|---|---|---|
| Retail | 2 | $269B |
|
||
| Technology / Retail | 1 | $638B |
|
||
| Technology | 1 | $245B |
|
||
| Telecommunications | 1 | $38B |
|
||
| Food / Beverage | 1 | $36B |
|
||
| Automotive / Trucks | 1 | $34B |
|
||
Price history
1 event — show timeline
- 2026-06-05 Listed $164,000 NWMLS as Distributed by MLS Grid
Property tax history
-1.3%/yrLatest (2026): $737 · -1.3% YoY. Source: county tax records.
Cash-flow waterfall
monthlySold comps — $/sqft
last 12 mo · ≤1 miLoading sold comps…