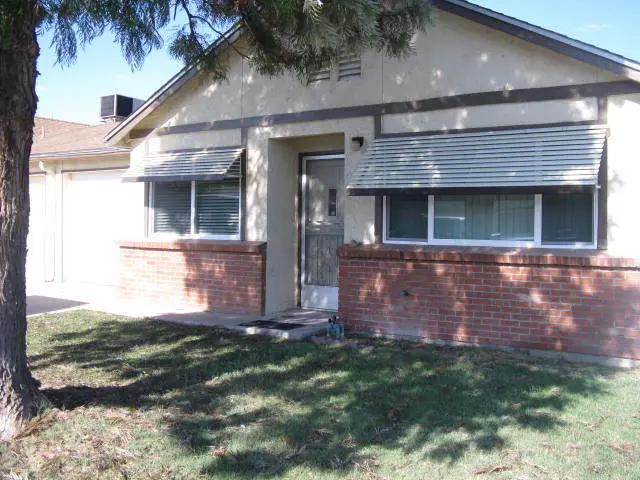
10127 N 95th Dr Unit A · Peoria, AZ
Flood risk 1/10 · Minimal
- FEMA flood zone
- X (shaded)
- Chance of flooding over 30 yrs
- 0.0%
- Est. flood insurance / yr
- $507 – $1,088
Fire risk 1/10 · Minimal
- Est. fire insurance / yr
- $610 – $1,132
Heat risk 9/10 · Severe
- Hot days now (above 113°F)
- 7 days/yr
- Hot days in 30 yrs
- 19 days/yr
Wind risk 1/10 · Minimal
- Chance of severe wind over 30 yrs
- —
Air-quality risk 2/10 · Minimal
- Unhealthy air days now
- 1 days/yr
- Unhealthy air days in 30 yrs
- 1 days/yr
Risk factors via First Street. Map © Google.
Why this score? — see what drove the C grade
The composite is a weighted blend of 9 inputs, each scored 0–100. Each bar is that input's sub-score; the figure is the points it added to the 100-point composite (weight × sub-score).
- Cash flow +18.9/30.0
- ARV discount +15.0/15.0
- DSCR +5.9/10.0
- 1% rule +4.3/10.0
- Livability +3.8/5.0
- Schools +3.5/10.0
- Rent growth +2.7/5.0
- Condition / age +2.5/5.0
- Appreciation +0.0/10.0
$189,900
🖨 Deal sheet (PDF) 📄 Offer letter ✓ Due diligence
Listing remarks MLS
Nice and quiet. Adult community low maintenance. close to everything you need.
Key facts
- $84 HOA
- Garage
- Community pool
Neighborhood map
What this means for you Summary
Snapshot
- This is a 2-bed/2.0-bath condo listed at $190k.
Deal economics
- At list price, monthly cash flow is $193 ($2k/yr) — positive.
- The deal already cash-flows at list — no discount required.
- To meet the 1% rule (rent ≥ 1% of price), the offer needs to be $177k (6.9% below list).
- Recommended offer: $177k (6.9% below list) — sets the bar for 1% rule.
- Cap rate 7.5% vs local median 3.3% in Peoria — top-decile yield for the area; either an underpriced asset or a hidden risk that comps aren't pricing in. Stress-test before assuming the spread holds.
Location & tenants
- Location reads 76/100 on livability (#14 in AZ, #3,603 nationally) — a middle-class / working-renter tenant base. Strengths: housing A+, commute A, employment A; Watch: cost of living C-, amenities D, health & safety F.
- Peoria Unified School District (4237) (suburban): math 36% / reading 42% proficiency, ranked #64 of 249 in AZ (top 26%) — families likely to look elsewhere, expect single-tenant / working-renter base with shorter leases.
- Zoned schools: Sun Valley Elementary School (math 23% / reading 29%, grade F, #623 of 1,109 statewide, top 57%, 806 students, 65% FRL); Raymond S. Kellis (math 27% / reading 34%, grade F, #114 of 381 statewide, top 30%, 1,817 students, 48% FRL) — zoned schools average 56% FRL vs 35% district-wide (21 pts higher); higher-poverty schools than district average — tighter screening recommended.
- Market conditions: Rents flat; 331 active listings in the ZIP; 38 comparable units currently listed for rent nearby; rentals at typical pace (median 26d on market — plan ~3-4 weeks tenant-placement turnaround); 36,011 units permitted in Maricopa County in 2024 (12,801 in 5+ unit buildings).
- This rent runs 31% of the median local income ($67k/yr) — at the standard rent-burdened threshold; future hikes will face affordability resistance.
Forward outlook
- Local home prices are declining (-3.0%/yr); year-one equity from $1k of loan paydown is wiped out by about $6k of value loss. Plan a longer hold.
- Maricopa County population projected at +38% by 2050 — long-run rental-demand tailwind backs the buy-and-hold thesis.
Negotiation context
- It's been on market 65 days — a 6% lower offer ($179k) is reasonable based on typical stale-listing flexibility.
- 6 sale attempts since 22y ago with the ask held roughly flat each time — persistent listings suggest the price (not the market) is what's stuck; bring a comps-based counter.
- Current owner paid $82k; list at $190k implies a 132% gain — meaningful room to come down on a strong offer.
Risks & watch-outs
- Climate carrying-cost: extreme-heat days projected 7→19/yr by 2055 (HVAC capex compounding) — expect insurance premiums to compound above CPI over the hold.
Questions for the listing agent
- It's been on market 65 days. Have you received any prior offers? Is the seller open to a 7% concession, seller financing, or rate buy-down credit?
- Built in 1973 — when were the roof, HVAC, electrical panel, plumbing, and water heater last replaced?
- What does the HOA fee cover, when was the last increase, and are there any pending special assessments or reserve-fund shortfalls?
- Any open or pending special assessments — roof, HVAC, plumbing, elevator, façade? What's the per-unit balance and payoff schedule, and is the seller paying it off at close or rolling it to the buyer?
- Why hasn't it sold? Are there any deal-killer items the seller is aware of (foundation, flood, title, zoning, code violations)?
- Is there a deadline driving the sale (1031 exchange, divorce, estate, relocation)? That informs how much negotiation room exists.
- Schools are B-rated — typically a magnet for longer-tenancy family renters. What's the average tenant stay here, and is there a school-zone premium baked into asking?
- What's the average days-on-market for RENTAL listings here right now (not sales)? A rising rental-DOM trend means longer vacancies and softer asking-rent achievability than the comps imply.
- What's the recent tenant-quality profile in this submarket — average credit score on applications, eviction rate, late-payment / NSF rate, and stable-employment percentage? A property-management company in the area should have these aggregated.
- How much new apartment / multifamily construction is in the pipeline within 1–3 miles? Heavy new supply (>2% of stock underway) typically softens rents 12–24 months out; light construction supports rent growth.
Investment metrics
- 1% rule
- 0.93% ✗
- Cap rate
- 7.51%
- Cash-on-cash
- 4.36%
- DSCR
- 1.19
- GRM
- 8.9
CMA / ARV
- ARV (median comp)
- $238,309
- List price
- $189,900
- Delta
- -20.31%
- Verdict
- UNDERPRICED
- Comps
- 20 within 1.0 mi
Projected returns pro-forma
-3.0% appreciation · 0.62% rent growth · sell at horizon
- IRR
- -12.0%
- Equity multiple
- 0.57×
- Total profit
- $-22,633
- Equity at exit
- $28,315
- IRR
- -6.6%
- Equity multiple
- 0.62×
- Total profit
- $-20,196
- Equity at exit
- $16,419
Cash invested: $53,172 (down + closing). Projections, not guarantees.
Landlord ↔ Tenant lean methodology
- Overall (STATE)
- 87 Strongly Landlord-Friendly
- State Arizona
- 87 Strongly Landlord-Friendly · R+3
- County
- — inherits STATE
- City
- — inherits STATE
ZIP-level market 85345
- Home prices YoY
- -19.8%
- Rents YoY
- 0.6%
- Active inventory
- 331
- Price-to-rent
- 8.9×
Monthly cashflow live
- Estimated rent
- $1,768 high interval (Pro) →
- Mortgage (P&I)
- −$996
- Tax from tax record
- −$45 /mo · $536/yr
- Insurance
- −$79
- HOA
- −$84
- Vacancy / Maint / Mgmt
- −$371
- Net cashflow
- $193
Break-even live
Sensitivity live
| Price | -10% $301 | -5% $247 | +0% $193 | +5% $140 | +10% $86 |
|---|---|---|---|---|---|
| Rent | -10% $54 | -5% $124 | +0% $193 | +5% $263 | +10% $333 |
| Rate | -1.0pp $289 | -0.5pp $242 | base $193 | +0.5pp $144 | +1.0pp $94 |
UW: 25.0% down · 7.5% · 30yr · 1.5% tax · 5.0% vac · 8.0% maint · 8.0% mgmt
Financing live
Cash to close
- Down payment
- $47,475
- Closing costs
- $5,697
- Reserves months
- —
- Total cash needed
- —
Loan-product check · same deal, 3 products live
Conventional
25% down · 7.5% · 30yr
- Down + closing
- —
- Monthly P&I
- —
- Monthly cashflow
- —
- DSCR
- —
- Eligible?
- —
Personal DTI + credit; lowest rate.
DSCR
20% down · 8.5% · 30yr
- Down + closing
- —
- Monthly P&I
- —
- Monthly cashflow
- —
- DSCR
- —
- Eligible?
- —
No personal income docs; deal must DSCR.
Hard money
10% down · 12.0% · 12mo
- Down + closing
- —
- Monthly P&I
- —
- Monthly cashflow
- —
- DSCR
- —
- Eligible?
- —
Short-term bridge; refi at stabilization.
Rent comps 38 comps
| Address | Beds | Baths | Sqft | Rent | $/sqft | DOM | Units | Dist |
|---|---|---|---|---|---|---|---|---|
| 10316 N 94th Ln Peoria, AZ | 3.0 | 2.0 | 1352 | $2,000 | $1.48 | 26d | 1 | 0.09mi |
| 9426 W Monroe St Peoria, AZ | 3.0 | 3.5 | 1405 | $1,800 | $1.28 | 18d | 1 | 0.09mi |
| 10104 N 96th Dr Unit A Peoria, AZ | 2.0 | 2.0 | 1072 | $1,750 | $1.63 | 26d | 1 | 0.17mi |
| 10110 N 97th Dr Unit A Peoria, AZ | 2.0 | 1.5 | 1025 | $1,500 | $1.46 | 26d | 1 | 0.28mi |
| 9323 W Ironwood Dr Peoria, AZ | 3.0 | 2.0 | 1306 | $1,985 | $1.52 | 25d | 1 | 0.29mi |
| 9323 W Ironwood Dr Peoria, AZ | 3.0 | 2.0 | 1306 | $2,085 | $1.60 | 45d | 1 | 0.29mi |
| 9626 W Mountain View Rd Unit A Peoria, AZ | 2.0 | 2.0 | 1156 | $1,500 | $1.30 | 45d | 1 | 0.30mi |
| 10701 N 99th Ave Unit 230 Peoria, AZ | 2.0 | 2.0 | 784 | $1,099 | $1.40 | 22d | 1 | 0.54mi |
| 10101 N 91st Ave #109 Peoria, AZ | 2.0 | 2.5 | 1161 | $1,395 | $1.20 | 4d | 1 | 0.60mi |
| 9002 W Malapai Dr Peoria, AZ | 3.0 | 2.0 | 1270 | $2,040 | $1.61 | 21d | 1 | 0.64mi |
| 9680 W Olive Ave Peoria, AZ | 1.0–3.0 | 1.0–2.0 | 850 | $1,540 | $1.81 | 0d | 10 | 0.66mi |
| 8930 W Monroe St Peoria, AZ | 3.0 | 2.0 | 1300 | $1,899 | $1.46 | 45d | 2 | 0.69mi |
| 8930 W Monroe St Peoria, AZ | 3.0 | 2.0 | 1300 | $2,099 | $1.61 | 25d | 1 | 0.69mi |
| 10822 N Balboa Dr Sun City, AZ | 2.0 | 1.0 | 942 | $3,000 | $3.18 | 26d | 1 | 0.77mi |
| 9625 W Olive Ave Peoria, AZ | 1.0–3.0 | 1.0–3.0 | 1485 | $2,224 | $1.50 | 0d | 9 | 0.85mi |
| 8834 W Purdue Ave Peoria, AZ | 3.0 | 2.0 | 1319 | $1,800 | $1.36 | 4d | 1 | 0.85mi |
| 11411 N 91st Ave Unit 213 Peoria, AZ | 2.0 | 2.0 | 858 | $1,399 | $1.63 | 26d | 1 | 0.90mi |
| 10221 N 87th Ln Peoria, AZ | 3.0 | 2.0 | 1232 | $2,059 | $1.67 | 45d | 1 | 0.93mi |
| 11411 N 91st Ave Unit 134 Peoria, AZ | 3.0 | 2.0 | 1310 | $1,599 | $1.22 | 45d | 1 | 0.94mi |
| 8940 W Olive Ave Peoria, AZ | 2.0 | 2.0 | 897 | $1,400 | $1.56 | 18d | 1 | 0.94mi |
| 8940 W Olive Ave Peoria, AZ | 2.0 | 2.0 | 1446 | $1,600 | $1.11 | 45d | 1 | 0.94mi |
| 8821 W Sahuaro Dr Peoria, AZ | 3.0 | 2.0 | 1074 | $1,695 | $1.58 | 0d | 1 | 0.95mi |
| 8821 W Sahuaro Dr Peoria, AZ | 3.0 | 2.0 | 1074 | $1,595 | $1.49 | 26d | 1 | 0.95mi |
| 8821 W Sahuaro Dr Peoria, AZ | 3.0 | 2.0 | 1074 | $1,595 | $1.49 | 4d | 1 | 0.95mi |
| 10350 W Camden Ave Sun City, AZ | 2.0 | 2.0 | 1413 | $2,850 | $2.02 | 26d | 1 | 1.12mi |
| 8650 W Peoria Ave Peoria, AZ | 1.0–2.0 | 1.0–2.0 | 836 | $1,492 | $1.78 | 0d | 18 | 1.13mi |
| 8560 W Peoria Ave Peoria, AZ | 2.0 | 1.0 | 888 | $1,399 | $1.58 | 0d | 8 | 1.21mi |
| 8551 W Carol Ave Peoria, AZ | 3.0 | 2.0 | 1323 | $2,095 | $1.58 | 0d | 1 | 1.23mi |
| 8563 W Mission Ln Peoria, AZ | 3.0 | 2.0 | 1323 | $1,950 | $1.47 | 26d | 1 | 1.27mi |
| 8610 W Eva St Peoria, AZ | 3.0 | 2.0 | 1208 | $2,035 | $1.68 | 23d | 1 | 1.28mi |
| 8610 W Eva St Peoria, AZ | 3.0 | 2.0 | 1208 | $1,985 | $1.64 | 5d | 1 | 1.28mi |
| 10860 N 85th Ave Peoria, AZ | 2.0 | 1.0 | 780 | $1,225 | $1.57 | 45d | 1 | 1.28mi |
| 10860 N 85th Ave Peoria, AZ | 1.0–2.0 | 1.0 | 630 | $1,350 | $2.14 | 5d | 1 | 1.28mi |
| 10860 N 85th Ave Unit 87 Peoria, AZ | 2.0 | 1.0 | 780 | $1,149 | $1.47 | 7d | 1 | 1.30mi |
| 9514 W El Caminito Dr Peoria, AZ | 3.0 | 2.0 | 1382 | $1,850 | $1.34 | 45d | 1 | 1.35mi |
| 9503 W Las Palmaritas Dr Peoria, AZ | 3.0 | 2.0 | 1283 | $1,200 | $0.94 | 7d | 1 | 1.43mi |
| 10421 W Puget Ave Peoria, AZ | 3.0 | 2.0 | 1424 | $1,750 | $1.23 | 26d | 1 | 1.47mi |
| 8544 W Lawrence Ln Peoria, AZ | 3.0 | 2.0 | 1304 | $1,695 | $1.30 | 7d | 1 | 1.47mi |
HOA detail condo
- Monthly dues
- $84 · $1,008/yr
- Assessments
- None detected in remarks — confirm with the listing agent.
Listing history 21 events
-
2026-06-02statusdays on market $189,900 Pending 65 DOM
-
2026-06-01days on market $189,900 Active 64 DOM
-
2026-05-31days on market $189,900 Active 63 DOM
-
2026-03-20$189,900 Active 78-char remark
Show marketing remark (78 chars)
Nice and quiet. Adult community low maintenance. close to everything you need.
-
2026-03-03historical
-
2026-01-14$193,500 Active
-
2025-12-03historical
-
2025-10-14$193,500 Active
-
2011-03-22historical
-
2011-01-11price $39,000
-
2010-08-03price $60,000
-
2010-08-02$50,000 Active
-
2004-10-08soldstatus $81,900
-
2004-10-08soldstatus $81,900
-
2004-09-23historical
-
2004-06-22$81,900
-
2004-06-11soldstatus $55,250
-
2004-06-10soldstatus $55,250
-
2004-03-01$56,950
-
1993-04-23soldstatus $33,000
-
1973-09-10soldstatus $19,120
ⓘ Source: listings_history table (triggers on properties + properties_extension) + one-shot
backfill from property_details.listing_events for pre-trigger history.
Tax reassessment forecast AZ · Resets to sale price
- Current annual tax
- $536 · $45/mo
- Projected year-2 tax
- $1,253 · $104/mo
- Expected delta
- +$717/yr (+$60/mo · 133.7%)
ⓘ Screening estimate from a state-policy table — verify with the county assessor before closing.
Climate risk First Street
- Flood 1/10 Low FEMA zone X (shaded) · 0% chance over 30 yrs
- Wildfire 1/10 Low
- Heat 9/10 Extreme 7 d/yr ≥113°F today · 19 d/yr by 30 yrs out
- Wind 1/10 Low
- Air quality 2/10 Low 1 unhealthy d/yr today · 1 by 30 yrs out
Nearby sold comps map
Loading sold comps map…
Walkable amenities ~0.75 mi
Loading nearby amenities…
Taxation est. · year 1
- Rental income
- $21,221
- − Mortgage interest
- −$10,637
- − Property taxes
- −$536
- − Insurance
- −$950
- − Repairs & maintenance
- −$1,698
- − Management
- −$1,698
- − HOA
- −$1,008
- − Depreciation
- −$5,524
- Taxable loss
- −$830
- Est. tax savings @ 24.0%
- +$199
- After-tax cash flow
- $2,520/yr
For passive investors: Depreciation is non-cash, so a rental often shows a tax loss while cash-flowing — sheltering income. Rental losses are passive: they offset passive income freely, and up to $25,000/yr can offset ordinary (W-2) income if you actively participate and your MAGI is under $100k (phasing out to $0 by $150k); unused losses carry forward. On sale, claimed depreciation is recaptured at up to 25%, and gains may owe capital-gains tax (a 1031 exchange can defer both). Figures are a year-1 estimate at your 24.0% rate — not tax advice; consult a CPA.
Schools (NCES district)
- District
- Peoria Unified School District (4237)
- NCES district ID
- 0406250
- Math proficiency
- 36% ▼ -14.00%
- Reading proficiency
- 42% ▼ -8.00%
- Median HH income
- $60,171
- Composite
- 34.62/100
- National rank
- #5152
- State rank
- #64 of 249 in AZ
Livability — Peoria
- Score
- 76/100
- State rank
- #14
- US rank
- #3603
Category grades
Schools grade is shown separately in the Schools card above.
Census & demographics
- Census place
- Peoria, AZ
- County
- Maricopa County · 4,537,380 people
- City population
- 206,687
- Metro
- Phoenix-Mesa-Chandler, AZ
- Population (ZIP)
- 60,918
- Household income
- $67,380
- Rent vs Own
- Severe rent burden
- 1879.0
Population outlook (Maricopa County) Hauer SSP2
- Today (2025)
- 4,979,203 people
- By 2030
- 5,378,229 · +8.0%
- By 2040
- 6,156,598 · +23.6%
- By 2050
- 6,872,376 · +38.0%
- By 2075
- 8,401,270 · +68.7%
- By 2100
- 9,247,439 · +85.7%
Race, ethnicity, and origin ACS 2023
- Neighborhood character
- Diverse neighborhood (Simpson 0.62)
- Race & ethnicity
- White 51% Hispanic / Latino 34% Two or more races 14% Black 5% Asian 4% Native American 2%
- Hispanic origin (detail)
- Mexican 29%
- Common ancestry
- Romanian 2% Italian 2% Slovak 1%
- Foreign-born
- 13% · Canada, Vietnam
- Languages at home
- 76% English-only · Spanish 18% Other Indo-European 1% Vietnamese 1%
Political lean MEDSL · Maricopa
- 2024 margin
- Toss-up / Even · D 47.7% · R 51.2% · Other 1.1%
- 2008→2024 swing
- +7.1pp toward D · 2008: -10.6pp · 2024: -3.5pp
- All cycles
- 2024: R+3.5 2020: D+2.2 2016: R+3.5 2012: R+12.0 2008: R+10.6
Not yet ingested
- Civics
- —
Market trends
- HPI YoY
- ▼ -80.77%
- Current HPI
- 328.1069
- Rent YoY
- ▲ 0.62%
- Metro
- Phoenix-Mesa-Chandler, AZ
- State GDP YoY
- ▲ 4.54%
- F500 in state
- 20
Industry mix (Fortune 500 HQ in AZ)
| Industry | F500 HQs | Revenue |
|---|---|---|
| Technology | 2 | $13B |
|
||
| Mining / Metals | 1 | $23B |
|
||
| Environmental Services | 1 | $16B |
|
||
| Metals / Steel | 1 | $14B |
|
||
| Technology Distribution | 1 | $9B |
|
||
| Homebuilding | 1 | $8B |
|
||
Price history
+893.2% since first listed18 events — show timeline
- 2026-03-20 Listed $189,900 ARMLS
- 2026-03-03 Listing Removed — ARMLS
- 2026-01-14 Listed $193,500 ARMLS
- 2025-12-03 Listing Removed — ARMLS
- 2025-10-14 Listed $193,500 ARMLS
- 2011-03-22 Listing Removed — ARMLS
- 2011-01-11 Price Changed $39,000 ARMLS
- 2010-08-03 Price Changed $60,000 ARMLS
- 2010-08-02 Listed $50,000 ARMLS
- 2004-10-08 Sold (Public Records) $81,900 Public Records
- 2004-10-08 Sold (MLS) $81,900 ARMLS
- 2004-09-23 Listing Removed — ARMLS
- 2004-06-22 Listed $81,900 ARMLS
- 2004-06-11 Sold (MLS) $55,250 ARMLS
- 2004-06-10 Sold (Public Records) $55,250 Public Records
- 2004-03-01 Listed $56,950 ARMLS
- 1993-04-23 Sold (Public Records) $33,000 Public Records
- 1973-09-10 Sold (Public Records) $19,120 Public Records
Property tax history
-1.7%/yrLatest (2025): $536 · -11.7% YoY. Source: county tax records.
Cash-flow waterfall
monthlySold comps — $/sqft
last 12 mo · ≤1 miLoading sold comps…