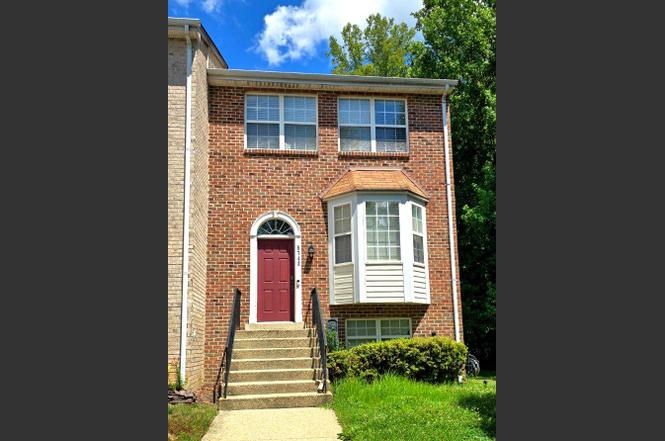
5742 E Boniwood Turn · Clinton, MD
Flood risk 4/10 · Minor
- FEMA flood zone
- X (unshaded)
- Chance of flooding over 30 yrs
- 0.22%
- Est. flood insurance / yr
- $473 – $860
Fire risk 3/10 · Minor
- Est. fire insurance / yr
- $755 – $1,403
Heat risk 8/10 · Major
- Hot days now (above 103°F)
- 7 days/yr
- Hot days in 30 yrs
- 17 days/yr
Wind risk 5/10 · Moderate
- Chance of severe wind over 30 yrs
- 22.0%
Air-quality risk 2/10 · Minimal
- Unhealthy air days now
- 1 days/yr
- Unhealthy air days in 30 yrs
- 2 days/yr
Risk factors via First Street. Map © Google.
Why this score? — see what drove the D+ grade
The composite is a weighted blend of 9 inputs, each scored 0–100. Each bar is that input's sub-score; the figure is the points it added to the 100-point composite (weight × sub-score).
- Cash flow +15.7/30.0
- ARV discount +11.8/15.0
- DSCR +4.9/10.0
- 1% rule +4.3/10.0
- Livability +3.2/5.0
- Rent growth +2.5/5.0
- Condition / age +2.5/5.0
- Schools +1.7/10.0
- Appreciation +0.0/10.0
$360,000
🖨 Deal sheet (PDF) 📄 Offer letter ✓ Due diligence
Listing remarks
Welcome to 5742 E. Boniwood Turn — an exciting opportunity to own a charming end-unit townhome in a peaceful community with a budget-friendly HOA. This 4 bedroom, 3 and a half bath townhome is full of warmth and potential. This well-maintained home is ready for you to add your personal style and make it your own. The main level features an inviting open-concept layout, creating the perfect space for entertaining guests, gathering with family, or enjoying everyday living. Downstairs, the versatile lower-level living area offers endless possibilities — create a media room, home office, recreation space, or private retreat to fit your lifestyle. Upstairs, you'll find comfortably si
Key facts
- $60 HOA
- Parking
- Built 2001
Property features AI
Finance
- Other: Property manager present
- HOA & community: Quarterly HOA fee of $180; HOA covers insurance, management, parking fee, recreation facility, and reserve funds; Community amenities include community center, tennis courts, and tot lots/playground
Exterior
- Parking: One assigned off-street parking space
- Utilities: Public water; Public sewer
- Home design: End of row townhouse; Fee simple ownership
- Construction: Brick construction; Permanent foundation; Built by Oaklawn Builders
- Exterior features: Partially fenced yard; Bay/Bow windows with double pane glass and screens
Interior
- Kitchen: Dishwasher; Garbage disposal; Gas oven/range; Refrigerator
- Bedrooms: Four bedrooms on the main level
- Bathrooms: Two full bathrooms; One half bathroom
- Heating & cooling: Central heating (natural gas); Central air conditioning (electric); Natural gas hot water
- Interior features: Dining area; Kitchen with table space; Master bathroom(s); Six-panel and sliding glass doors; Full, fully finished basement with outside/rear entrances and walkout level
Neighborhood map
What this means for you Summary
Snapshot
- This is a 4-bed/3.5-bath townhouse listed at $360k.
Deal economics
- At list price, monthly cash flow is $161 ($2k/yr) — positive.
- The deal already cash-flows at list — no discount required.
- To meet the 1% rule (rent ≥ 1% of price), the offer needs to be $334k (7.2% below list).
- Recommended offer: $334k (7.2% below list) — sets the bar for 1% rule.
- Cap rate 6.8% vs local median 5.3% in Clinton — meaningfully above typical; check what's discounted (condition, days-on-market, listing class) to confirm the premium yield is real.
Location & tenants
- Location reads 63/100 on livability (#304 in MD) — a middle-class / working-renter tenant base. Strengths: employment A+, housing A+; Watch: crime D+, amenities F, commute F.
- Prince George'S County Public Schools (suburban): math 8% / reading 24% proficiency, ranked #21 of 24 in MD (top 88%) — low school quality limits family demand, transient renter base, plan for 1-2y turnover.
- Zoned schools: Waldon Woods Elementary (math 4% / reading 11%, grade F, #681 of 860 statewide, top 81%, 529 students, 70% FRL); Stephen Decatur Middle (math 3% / reading 24%, grade F, #198 of 225 statewide, top 88%, 781 students, 70% FRL); Surrattsville High (math 2% / reading 27%, grade F, #185 of 222 statewide, top 85%, 772 students, 60% FRL).
- Market conditions: 124 active listings in the ZIP; 5 comparable units currently listed for rent nearby; rentals at typical pace (median 21d on market — plan ~3-4 weeks tenant-placement turnaround); 40% of comp listings sitting > 30 days — soft ceiling on asking rent; high-income renter base; 1,481 units permitted in Prince George's County in 2024 (0 in 5+ unit buildings).
- This rent runs 32% of the median local income ($126k/yr) — at the standard rent-burdened threshold; future hikes will face affordability resistance.
Forward outlook
- Local home prices are declining (-3.0%/yr); year-one equity from $2k of loan paydown is wiped out by about $11k of value loss. Plan a longer hold.
- Prince George's County population projected at +18% by 2050 — long-run rental-demand tailwind backs the buy-and-hold thesis.
Negotiation context
- Only 3 days on market — expect competitive offers; lowballing is unlikely to land.
- 2 sale attempts since 26y ago with the ask held roughly flat each time — persistent listings suggest the price (not the market) is what's stuck; bring a comps-based counter.
- Current owner paid $165k; list at $360k implies a 118% gain — meaningful room to come down on a strong offer.
Risks & watch-outs
- Climate carrying-cost: moderate wind risk, 22% chance of damaging wind over 30y; extreme-heat days projected 7→17/yr by 2055 (HVAC capex compounding) — expect insurance premiums to compound above CPI over the hold.
Questions for the listing agent
- What does the HOA fee cover, when was the last increase, and are there any pending special assessments or reserve-fund shortfalls?
- Is there a deadline driving the sale (1031 exchange, divorce, estate, relocation)? That informs how much negotiation room exists.
- Schools are D-rated, which usually means shorter tenancies and higher turnover. Who's the typical renter profile here, and what's been the actual vacancy rate?
- Crime grade is D in this area — have there been break-ins, vandalism, or insurance claims at this property in the last 3 years? What carrier currently insures it and at what premium?
- The area grade is low — what's the realistic commute time and amenity access for the typical tenant pool here? Any planned neighborhood developments (good or bad) we should know about?
- What's the average days-on-market for RENTAL listings here right now (not sales)? A rising rental-DOM trend means longer vacancies and softer asking-rent achievability than the comps imply.
- What's the recent tenant-quality profile in this submarket — average credit score on applications, eviction rate, late-payment / NSF rate, and stable-employment percentage? A property-management company in the area should have these aggregated.
- How much new for-sale + rental construction is in the pipeline within 1–3 miles? Heavy new supply typically softens prices + rents 12–24 months out; constrained supply supports both.
Investment metrics
- 1% rule
- 0.93% ✗
- Cap rate
- 6.83%
- Cash-on-cash
- 1.92%
- DSCR
- 1.09
- GRM
- 9.0
CMA / ARV
- ARV (on-the-fly)
- $397,880
- Comps found
- 12
Show comp detail 12 sales within ~0.75 mi
| Address | Dist | Beds/Ba | Sqft | Sold | Price | $/sf | Match |
|---|---|---|---|---|---|---|---|
| 11505 Cosca Park Pl | 0.05mi | 3/3.5 (-1) | 1,368 (-0%) | 2mo | $397,000 | $290 | 90 |
| 11400 Cosca Park Pl | 0.08mi | 4/3.5 | 1,328 (-3%) | 3mo | $400,000 | $301 | 88 |
| 5858 E Boniwood Turn | 0.18mi | 4/3.5 | 1,360 (-1%) | 3mo | $380,000 | $279 | 87 |
| 5845 E Boniwood Turn | 0.16mi | 4/3.5 | 1,368 (-0%) | 6mo | $370,000 | $270 | 87 |
| 5510 E Boniwood Turn | 0.15mi | 4/3.5 | 1,360 (-1%) | 7mo | $370,000 | $272 | 86 |
| 11664 Cosca Park Dr | 0.14mi | 4/3.0 | 1,328 (-3%) | 2mo | $335,000 | $252 | 84 |
| 5819 E Boniwood Turn | 0.14mi | 4/3.5 | 1,372 (0%) | 12mo | $395,000 | $288 | 84 |
| 5883 E Boniwood Turn | 0.19mi | 4/3.5 | 1,372 (0%) | 13mo | $410,000 | $299 | 80 |
| 5621 E Boniwood Turn | 0.13mi | 3/3.0 (-1) | 1,360 (-1%) | 11mo | $380,000 | $279 | 76 |
| 5613 E Boniwood Turn | 0.15mi | 4/3.5 | 1,320 (-4%) | 15mo | $400,000 | $303 | 74 |
| 5543 E Boniwood Turn | 0.18mi | 4/3.5 | 1,288 (-6%) | 10mo | $395,000 | $307 | 73 |
| 11500 Cosca Park Pl | 0.09mi | 3/3.0 (-1) | 1,328 (-3%) | 16mo | $385,000 | $290 | 70 |
Match score weights: distance 35% · size 25% · config 20% · recency 20%. Top-matched comps best support the ARV.
Projected returns pro-forma
-3.0% appreciation · 3.0% rent growth · sell at horizon
- IRR
- -13.2%
- Equity multiple
- 0.52×
- Total profit
- $-48,024
- Equity at exit
- $53,677
- IRR
- -4.3%
- Equity multiple
- 0.72×
- Total profit
- $-28,416
- Equity at exit
- $31,126
Cash invested: $100,800 (down + closing). Projections, not guarantees.
Landlord ↔ Tenant lean methodology
- Overall (STATE)
- 27 Tenant-Leaning
- State Maryland
- 27 Tenant-Leaning · D+14
- County
- — inherits STATE
- City
- — inherits STATE
ZIP-level market 20735
- Active inventory
- 124
- Price-to-rent
- 9.0×
Monthly cashflow live
- Estimated rent
- $3,343 high interval (Pro) →
- Mortgage (P&I)
- −$1,888
- Tax from tax record
- −$382 /mo · $4,579/yr
- Insurance
- −$150
- HOA
- −$60
- Vacancy / Maint / Mgmt
- −$702
- Net cashflow
- $161
Break-even live
Sensitivity live
| Price | -10% $365 | -5% $263 | +0% $161 | +5% $59 | +10% $-43 |
|---|---|---|---|---|---|
| Rent | -10% $-103 | -5% $29 | +0% $161 | +5% $293 | +10% $425 |
| Rate | -1.0pp $342 | -0.5pp $253 | base $161 | +0.5pp $68 | +1.0pp $-27 |
UW: 25.0% down · 7.5% · 30yr · 1.5% tax · 5.0% vac · 8.0% maint · 8.0% mgmt
Financing live
Cash to close
- Down payment
- $90,000
- Closing costs
- $10,800
- Reserves months
- —
- Total cash needed
- —
Loan-product check · same deal, 3 products live
Conventional
25% down · 7.5% · 30yr
- Down + closing
- —
- Monthly P&I
- —
- Monthly cashflow
- —
- DSCR
- —
- Eligible?
- —
Personal DTI + credit; lowest rate.
DSCR
20% down · 8.5% · 30yr
- Down + closing
- —
- Monthly P&I
- —
- Monthly cashflow
- —
- DSCR
- —
- Eligible?
- —
No personal income docs; deal must DSCR.
Hard money
10% down · 12.0% · 12mo
- Down + closing
- —
- Monthly P&I
- —
- Monthly cashflow
- —
- DSCR
- —
- Eligible?
- —
Short-term bridge; refi at stabilization.
Rent comps 5 comps
| Address | Beds | Baths | Sqft | Rent | $/sqft | DOM | Units | Dist |
|---|---|---|---|---|---|---|---|---|
| 5558 E Boniwood Turn Clinton, MD | 4.0 | 3.5 | 1360 | $3,200 | $2.35 | 4d | 1 | 0.11mi |
| 5508 E Boniwood Turn Clinton, MD | 4.0 | 3.5 | 1320 | $2,600 | $1.97 | 14d | 1 | 0.14mi |
| 5539 E Boniwood Turn Clinton, MD | 4.0 | 3.5 | 1288 | $2,950 | $2.29 | 45d | 1 | 0.19mi |
| 6004 Clinton Way Clinton, MD | 4.0 | 1.5 | 1028 | $2,850 | $2.77 | 45d | 1 | 0.57mi |
| 6907 Fulford St Clinton, MD | 4.0 | 3.0 | 1125 | $3,500 | $3.11 | 20d | 1 | 1.14mi |
HOA detail
- Monthly dues
- $60 · $720/yr
Listing history 3 events
-
2026-06-21days on market $360,000 Active 3 DOM
-
2026-06-18remarks 687-char remark
-
2026-06-18$360,000 Active 1 DOM
ⓘ Source: listings_history table (triggers on properties + properties_extension) + one-shot
backfill from property_details.listing_events for pre-trigger history.
Tax reassessment forecast MD · Partial reset (capped growth)
- Current annual tax
- $4,579 · $382/mo
- Projected year-2 tax
- $4,579 · $382/mo
- Expected delta
- $0/yr ($0/mo · 0.0%)
ⓘ Screening estimate from a state-policy table — verify with the county assessor before closing.
Climate risk First Street
- Flood 4/10 Moderate FEMA zone X (unshaded) · 22% chance over 30 yrs
- Wildfire 3/10 Moderate
- Heat 8/10 Severe 7 d/yr ≥103°F today · 17 d/yr by 30 yrs out
- Wind 5/10 Major 22% chance of damaging wind over 30 yrs
- Air quality 2/10 Low 1 unhealthy d/yr today · 2 by 30 yrs out
Nearby sold comps map
Loading sold comps map…
Walkable amenities ~0.75 mi
Loading nearby amenities…
Taxation est. · year 1
- Rental income
- $40,111
- − Mortgage interest
- −$20,166
- − Property taxes
- −$4,579
- − Insurance
- −$1,800
- − Repairs & maintenance
- −$3,209
- − Management
- −$3,209
- − HOA
- −$720
- − Depreciation
- −$10,473
- Taxable loss
- −$4,044
- Est. tax savings @ 24.0%
- +$971
- After-tax cash flow
- $2,905/yr
For passive investors: Depreciation is non-cash, so a rental often shows a tax loss while cash-flowing — sheltering income. Rental losses are passive: they offset passive income freely, and up to $25,000/yr can offset ordinary (W-2) income if you actively participate and your MAGI is under $100k (phasing out to $0 by $150k); unused losses carry forward. On sale, claimed depreciation is recaptured at up to 25%, and gains may owe capital-gains tax (a 1031 exchange can defer both). Figures are a year-1 estimate at your 24.0% rate — not tax advice; consult a CPA.
Schools (NCES district)
- District
- Prince George'S County Public Schools
- NCES district ID
- 2400510
- Math proficiency
- 8% ▼ -11.00%
- Reading proficiency
- 24% ▼ -9.00%
- Median HH income
- $73,967
- Composite
- 16.82/100
- National rank
- #9151
- State rank
- #21 of 24 in MD
Livability — Clinton
- Score
- 63/100
- State rank
- #304
- US rank
- #15951
Category grades
Schools grade is shown separately in the Schools card above.
Census & demographics
- Census place
- Clinton, MD
- County
- Prince Georges County · 919,866 people
- City population
- 37,464
- Metro
- Washington-Arlington-Alexandria, DC-VA-MD-WV
- Population (ZIP)
- 37,464
- Household income
- $126,196
- Rent vs Own
- Severe rent burden
- 334.0
Population outlook (Prince George's County) Hauer SSP2
- Today (2025)
- 1,005,426 people
- By 2030
- 1,048,416 · +4.3%
- By 2040
- 1,123,425 · +11.7%
- By 2050
- 1,183,220 · +17.7%
- By 2075
- 1,306,202 · +29.9%
- By 2100
- 1,408,179 · +40.1%
Race, ethnicity, and origin ACS 2023
- Neighborhood character
- Predominantly Black (76%)
- Race & ethnicity
- Black 76% Hispanic / Latino 10% White 7% Two or more races 5% Asian 2%
- Hispanic origin (detail)
- Mexican 1%
- Foreign-born
- 13% · Canada, Vietnam
- Languages at home
- 86% English-only · Spanish 9% Tagalog/Filipino 1% French/Haitian/Cajun 1%
Political lean MEDSL · Prince George's
- 2024 margin
- Solid D (+75.2) · D 86.3% · R 11.2% · Other 2.5%
- 2008→2024 swing
- -3.3pp toward R · 2008: 78.5pp · 2024: 75.2pp
- All cycles
- 2024: D+75.2 2020: D+80.5 2016: D+81.0 2012: D+80.9 2008: D+78.5
Not yet ingested
- Civics
- —
Market trends
- HPI YoY
- ▼ -299.23%
- Current HPI
- 251.6263
- Rent YoY
- —
- Metro
- Washington-Arlington-Alexandria, DC-VA-MD-WV
- State GDP YoY
- ▲ 2.97%
- F500 in state
- 12
Industry mix (Fortune 500 HQ in MD)
| Industry | F500 HQs | Revenue |
|---|---|---|
| Aerospace / Defense | 1 | $71B |
|
||
| Utilities | 1 | $25B |
|
||
| Hotels | 1 | $24B |
|
||
| Consumer Goods | 1 | $7B |
|
||
| Real Estate | 1 | $6B |
|
||
| Chemicals | 1 | $2B |
|
||
Price history
+118.0% since first listed4 events — show timeline
- 2026-06-18 Listed $360,000 BRIGHT MLS
- 2001-04-30 Sold (MLS) $165,100 MRIS
- 2000-10-02 Listed $165,100 MRIS
- 2000-10-02 Delisted — MRIS
Property tax history
+5.0%/yrLatest (2025): $4,579 · +3.8% YoY. Source: county tax records.
Cash-flow waterfall
monthlySold comps — $/sqft
last 12 mo · ≤1 miLoading sold comps…