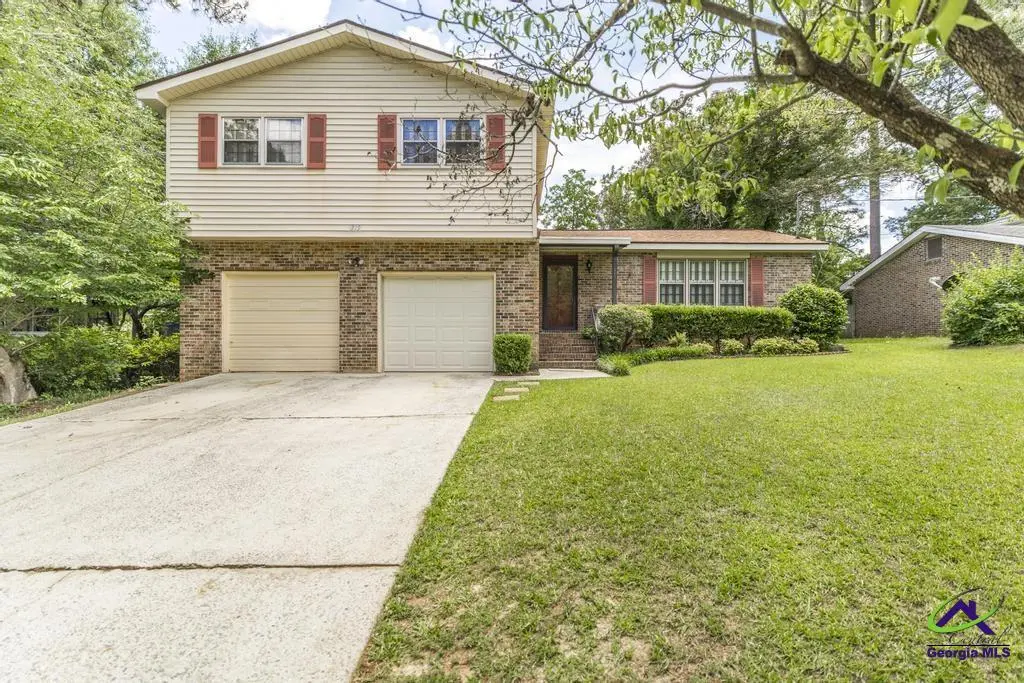
315 Donna Dr · Warner Robins, GA
Flood risk 1/10 · Minimal
- FEMA flood zone
- X (unshaded)
- Chance of flooding over 30 yrs
- 0.0%
- Est. flood insurance / yr
- $507 – $1,088
Fire risk 1/10 · Minimal
- Est. fire insurance / yr
- $963 – $1,789
Heat risk 7/10 · Major
- Hot days now (above 108°F)
- 7 days/yr
- Hot days in 30 yrs
- 17 days/yr
Wind risk 6/10 · Moderate
- Chance of severe wind over 30 yrs
- 76.0%
Air-quality risk 3/10 · Minor
- Unhealthy air days now
- 2 days/yr
- Unhealthy air days in 30 yrs
- 4 days/yr
Risk factors via First Street. Map © Google.
Why this score? — see what drove the D grade
The composite is a weighted blend of 9 inputs, each scored 0–100. Each bar is that input's sub-score; the figure is the points it added to the 100-point composite (weight × sub-score).
- Cash flow +14.3/30.0
- ARV discount +9.6/15.0
- DSCR +4.3/10.0
- Schools +3.9/10.0
- Livability +3.2/5.0
- 1% rule +2.9/10.0
- Rent growth +2.9/5.0
- Condition / age +2.5/5.0
- Appreciation +0.0/10.0
$225,000
🖨 Deal sheet 📄 Offer letter ✓ Due diligence
Listing remarks MLS
Well maintained home in established neighborhood. One owner home. Lots of space inside and out. 4 bedrooms with 2.5 baths. Beautiful backyard with mature landscaping. Roof is within the last 8 years per owner. HVAC is 4-5 years
Key facts
- One owner home
- Mature landscaping
- Beautiful backyard
Tags
Property features AI
Finance
- Other: Property located at 315 Donna Dr, Warner Robins, GA 31088; Lot size about 0.24 acres
- Financial info: No investor or income/expense details provided
- HOA & community: No HOA
Exterior
- Parking: Attached garage with space for 2 vehicles
- Security: No community features or association-provided security
- Utilities: Public water; Public sewer; Water available
- Home design: Single-family house; Residential property; Resale; Three or more stories
- Construction: Built in 1975; Brick and vinyl siding exterior; Composition roof; Building area approx. 2050 square feet
- Exterior features: Lot features: Other
Interior
- Kitchen: No specific kitchen appliance details provided
- Bedrooms: 4 bedrooms
- Flooring: Other flooring
- Bathrooms: 2 full bathrooms and 1 half bathroom (3 total)
- Heating & cooling: Heat pump for heating; Heat pump for cooling
- Interior features: Other interior features; Three or more levels; No basement; No fireplaces
- Laundry & utility: Laundry features: Other
Neighborhood map
What this means for you Summary
Snapshot
- This is a 4-bed/2.5-bath single-family listed at $225k.
Deal economics
- At list price, monthly cash flow is $40 ($476/yr) — positive.
- The deal already cash-flows at list — no discount required.
- To meet the 1% rule (rent ≥ 1% of price), the offer needs to be $178k (20.9% below list).
- Recommended offer: $178k (20.9% below list) — sets the bar for 1% rule.
- Cap rate 6.5% vs local median 4.9% in Warner Robins — top-decile yield for the area; either an underpriced asset or a hidden risk that comps aren't pricing in. Stress-test before assuming the spread holds.
Location & tenants
- Location reads 65/100 on livability (#227 in GA) — a middle-class / working-renter tenant base. Strengths: cost of living A+, housing A+, health & safety A+; Watch: employment D+, crime F, amenities F.
- Houston County (urban): math 43% / reading 46% proficiency, ranked #23 of 174 in GA (top 13%) — families likely to look elsewhere, expect single-tenant / working-renter base with shorter leases.
- Zoned schools: Shirley Hills Elementary School (math 44% / reading 52%, grade D, #289 of 1,228 statewide, top 24%, 545 students, 84% FRL); Warner Robins Middle School (math 25% / reading 37%, grade F, #237 of 470 statewide, top 51%, 813 students, 84% FRL); Warner Robins High School (math 7% / reading 21%, grade F, #322 of 424 statewide, top 76%, 1,816 students, 84% FRL) — zoned schools average 84% FRL vs 46% district-wide (38 pts higher); higher-poverty schools than district average — tighter screening recommended.
- Zoned-school proficiency averages 31% at this address vs 44% district-wide (-14 pts) — the specific schools serving this property underperform the Houston County average; the district grade overstates school quality for this exact location.
- Market conditions: Rents rising (+1.7%/yr); 286 active listings in the ZIP; 12 comparable units currently listed for rent nearby; rentals at typical pace (median 21d on market — plan ~3-4 weeks tenant-placement turnaround); solid renter incomes; 1,545 units permitted in Houston County in 2024 (336 in 5+ unit buildings).
Forward outlook
- Local home prices are declining (-3.0%/yr); year-one equity from $2k of loan paydown is wiped out by about $7k of value loss. Plan a longer hold.
- Houston County population projected at +22% by 2050 — long-run rental-demand tailwind backs the buy-and-hold thesis.
Negotiation context
- It's been on market 31 days — a 3% lower offer ($218k) is reasonable based on typical stale-listing flexibility.
- 2 sale attempts with the ask held roughly flat each time — persistent listings suggest the price (not the market) is what's stuck; bring a comps-based counter.
Risks & watch-outs
- Climate carrying-cost: major wind risk, 76% chance of damaging wind over 30y; extreme-heat days projected 7→17/yr by 2055 (HVAC capex compounding) — expect insurance premiums to compound above CPI over the hold.
Questions for the listing agent
- It's been on market 31 days. Have you received any prior offers? Is the seller open to a 21% concession, seller financing, or rate buy-down credit?
- Built in 1975 — when were the roof, HVAC, electrical panel, plumbing, and water heater last replaced?
- Is there a deadline driving the sale (1031 exchange, divorce, estate, relocation)? That informs how much negotiation room exists.
- Schools are D-rated, which usually means shorter tenancies and higher turnover. Who's the typical renter profile here, and what's been the actual vacancy rate?
- Crime grade is F in this area — have there been break-ins, vandalism, or insurance claims at this property in the last 3 years? What carrier currently insures it and at what premium?
- The area grade is low — what's the realistic commute time and amenity access for the typical tenant pool here? Any planned neighborhood developments (good or bad) we should know about?
- What's the average days-on-market for RENTAL listings here right now (not sales)? A rising rental-DOM trend means longer vacancies and softer asking-rent achievability than the comps imply.
- What's the recent tenant-quality profile in this submarket — average credit score on applications, eviction rate, late-payment / NSF rate, and stable-employment percentage? A property-management company in the area should have these aggregated.
- How much new for-sale + rental construction is in the pipeline within 1–3 miles? Heavy new supply typically softens prices + rents 12–24 months out; constrained supply supports both.
Investment metrics
- 1% rule
- 0.79% ✗
- Cap rate
- 6.50%
- Cash-on-cash
- 0.76%
- DSCR
- 1.03
- GRM
- 10.5
CMA / ARV
- ARV (on-the-fly)
- $235,750
- Comps found
- 12
Show comp detail 12 sales within ~0.75 mi
| Address | Dist | Beds/Ba | Sqft | Sold | Price | $/sf | Match |
|---|---|---|---|---|---|---|---|
| 413 Tracy Ter | 0.30mi | 4/2.5 | 1,831 (-11%) | 1mo | $181,000 | $99 | 68 |
| 503 Todd Cir | 0.36mi | 4/2.0 | 1,919 (-6%) | 5mo | $220,000 | $115 | 67 |
| 515 Kimberly Rd | 0.56mi | 4/2.5 | 2,144 (+5%) | 2mo | $236,600 | $110 | 65 |
| 213 Self St | 0.46mi | 4/2.0 | 2,202 (+7%) | 2mo | $245,000 | $111 | 62 |
| 113 Colonial Rd | 0.30mi | 3/2.5 (-1) | 1,892 (-8%) | 8mo | $226,000 | $119 | 62 |
| 82 Oliver Dr | 0.45mi | 3/2.0 (-1) | 1,873 (-9%) | 3mo | $215,000 | $115 | 55 |
| 215 Kimberly Rd | 0.46mi | 3/2.0 (-1) | 1,856 (-10%) | 4mo | $205,000 | $110 | 52 |
| 625 Todd Cir | 0.57mi | 3/2.0 (-1) | 1,876 (-8%) | 1mo | $250,000 | $133 | 51 |
| 273 Lakeshore Drive Dr | 0.71mi | 3/2.5 (-1) | 2,176 (+6%) | 1mo | $299,900 | $138 | 51 |
| 77 Oliver Dr | 0.43mi | 3/2.0 (-1) | 1,760 (-14%) | 3mo | $200,000 | $114 | 47 |
| 104 Oak Forest Ct | 0.59mi | 4/2.0 | 1,794 (-12%) | 5mo | $230,000 | $128 | 45 |
| 207 Atrium Ct | 0.59mi | 3/2.0 (-1) | 1,759 (-14%) | 8mo | $220,000 | $125 | 35 |
Match score weights: distance 35% · size 25% · config 20% · recency 20%. Top-matched comps best support the ARV.
Projected returns pro-forma
-3.0% appreciation · 1.67% rent growth · sell at horizon
- IRR
- -16.5%
- Equity multiple
- 0.42×
- Total profit
- $-36,373
- Equity at exit
- $33,548
- IRR
- -10.6%
- Equity multiple
- 0.39×
- Total profit
- $-38,171
- Equity at exit
- $19,454
Cash invested: $63,000 (down + closing). Projections, not guarantees.
Landlord ↔ Tenant lean methodology
- Overall (STATE)
- 90 Strongly Landlord-Friendly
- State Georgia
- 90 Strongly Landlord-Friendly · R+3
- County
- — inherits STATE
- City
- — inherits STATE
ZIP-level market 31088
- Rents YoY
- 1.7%
- Active inventory
- 286
- Price-to-rent
- 10.5×
Monthly cashflow live
- Estimated rent
- $1,779 high interval (Pro) →
- Mortgage (P&I)
- −$1,180
- Tax from tax record
- −$92 /mo · $1,102/yr
- Insurance
- −$94
- HOA
- −$0
- Vacancy / Maint / Mgmt
- −$374
- Net cashflow
- $40
Break-even live
UW: 25.0% down · 7.5% · 30yr · 1.5% tax · 5.0% vac · 8.0% maint · 8.0% mgmt
Financing live
Cash to close
- Down payment
- $56,250
- Closing costs
- $6,750
- Reserves months
- —
- Total cash needed
- —
Loan-product check · same deal, 3 products live
Conventional
25% down · 7.5% · 30yr
- Down + closing
- —
- Monthly P&I
- —
- Monthly cashflow
- —
- DSCR
- —
- Eligible?
- —
Personal DTI + credit; lowest rate.
DSCR
20% down · 8.5% · 30yr
- Down + closing
- —
- Monthly P&I
- —
- Monthly cashflow
- —
- DSCR
- —
- Eligible?
- —
No personal income docs; deal must DSCR.
Hard money
10% down · 12.0% · 12mo
- Down + closing
- —
- Monthly P&I
- —
- Monthly cashflow
- —
- DSCR
- —
- Eligible?
- —
Short-term bridge; refi at stabilization.
Rent comps 12 comps
| Address | Beds | Baths | Sqft | Rent | $/sqft | DOM | Units | Dist |
|---|---|---|---|---|---|---|---|---|
| 337 Mary Ln Warner Robins, GA | 3.0 | 2.0 | 1411 | $1,500 | $1.06 | 13d | 1 | 0.55mi |
| 121 Highland Dr Warner Robins, GA | 3.0 | 2.0 | 1712 | $1,795 | $1.05 | 43d | 1 | 0.56mi |
| 121 Highland Dr Warner Robins, GA | 3.0 | 2.0 | 1712 | $1,795 | $1.05 | 21d | 1 | 0.56mi |
| 341 Mary Ln Warner Robins, GA | 3.0 | 2.0 | 1413 | $1,350 | $0.96 | 21d | 1 | 0.56mi |
| 132 Cathy Ct Warner Robins, GA | 3.0 | 2.0 | 1428 | $1,450 | $1.02 | 13d | 1 | 0.57mi |
| 132 Cathy Ct Warner Robins, GA | 3.0 | 1.5 | 1428 | $1,450 | $1.02 | 21d | 1 | 0.57mi |
| 211 Laverne Dr Warner Robins, GA | 3.0 | 2.0 | 1431 | $1,395 | $0.97 | 13d | 1 | 0.89mi |
| 109 Leisure Pointe Cv Warner Robins, GA | 4.0 | 2.5 | 1682 | $1,925 | $1.14 | 43d | 1 | 1.06mi |
| 122 Rolling Woods Cir Warner Robins, GA | 3.0 | 2.5 | 1920 | $1,750 | $0.91 | 21d | 1 | 1.06mi |
| 122 Rolling Woods Cir Warner Robins, GA | 3.0 | 2.5 | 1920 | $1,750 | $0.91 | 43d | 1 | 1.06mi |
| 106 Leisure Pointe Cv Warner Robins, GA | 4.0 | 2.5 | 1682 | $2,000 | $1.19 | 43d | 1 | 1.07mi |
| 106 Leisure Pointe Cv Warner Robins, GA | 4.0 | 2.5 | 1682 | $1,950 | $1.16 | 13d | 1 | 1.07mi |
Listing history 19 events
-
2026-06-19days on market $225,000 Active 31 DOM
-
2026-06-18days on market $225,000 Active 30 DOM
-
2026-06-17days on market $225,000 Active 29 DOM
-
2026-06-16days on market $225,000 Active 28 DOM
-
2026-06-15days on market $225,000 Active 27 DOM
-
2026-06-14days on market $225,000 Active 25 DOM
-
2026-06-13days on market $225,000 Active 24 DOM
-
2026-06-10days on market $225,000 Active 22 DOM
-
2026-06-09days on market $225,000 Active 21 DOM
-
2026-06-08days on market $225,000 Active 20 DOM
-
2026-06-07statusdays on market $225,000 Active 19 DOM
-
2026-06-05pricedays on market $225,000 Price Change 16 DOM
-
2026-06-03pricestatusdays on market $220,000 Price Change 15 DOM
-
2026-06-02statusdays on market $230,000 Active 14 DOM
-
2026-06-01days on market $230,000 New 13 DOM
-
2026-05-31days on market $230,000 New 12 DOM
-
2026-05-30days on market $230,000 New 11 DOM
-
2026-05-19$230,000 Active 227-char remark
Show marketing remark (227 chars)
Well maintained home in established neighborhood. One owner home. Lots of space inside and out. 4 bedrooms with 2.5 baths. Beautiful backyard with mature landscaping. Roof is within the last 8 years per owner. HVAC is 4-5 years
-
2026-05-19$230,000 New
Show marketing remark (227 chars)
Well maintained home in established neighborhood. One owner home. Lots of space inside and out. 4 bedrooms with 2.5 baths. Beautiful backyard with mature landscaping. Roof is within the last 8 years per owner. HVAC is 4-5 years
ⓘ Source: listings_history table (triggers on properties + properties_extension) + one-shot
backfill from property_details.listing_events for pre-trigger history.
Tax reassessment forecast GA · Resets to sale price
- Current annual tax
- $1,102 · $92/mo
- Projected year-2 tax
- $2,070 · $172/mo
- Expected delta
- +$968/yr (+$81/mo · 87.8%)
ⓘ Screening estimate from a state-policy table — verify with the county assessor before closing.
Climate risk First Street
- Flood 1/10 Low FEMA zone X (unshaded) · 0% chance over 30 yrs
- Wildfire 1/10 Low
- Heat 7/10 Severe 7 d/yr ≥108°F today · 17 d/yr by 30 yrs out
- Wind 6/10 Major 76% chance of damaging wind over 30 yrs
- Air quality 3/10 Moderate 2 unhealthy d/yr today · 4 by 30 yrs out
Nearby sold comps map
Loading sold comps map…
Walkable amenities ~0.75 mi
Loading nearby amenities…
Taxation est. · year 1
- Rental income
- $21,345
- − Mortgage interest
- −$12,603
- − Property taxes
- −$1,102
- − Insurance
- −$1,125
- − Repairs & maintenance
- −$1,708
- − Management
- −$1,708
- − Depreciation
- −$6,545
- Taxable loss
- −$3,447
- Est. tax savings @ 24.0%
- +$827
- After-tax cash flow
- $1,303/yr
For passive investors: Depreciation is non-cash, so a rental often shows a tax loss while cash-flowing — sheltering income. Rental losses are passive: they offset passive income freely, and up to $25,000/yr can offset ordinary (W-2) income if you actively participate and your MAGI is under $100k (phasing out to $0 by $150k); unused losses carry forward. On sale, claimed depreciation is recaptured at up to 25%, and gains may owe capital-gains tax (a 1031 exchange can defer both). Figures are a year-1 estimate at your 24.0% rate — not tax advice; consult a CPA.
Schools (NCES district)
- District
- Houston County
- NCES district ID
- 1302880
- Math proficiency
- 43% ▼ -7.00%
- Reading proficiency
- 46% ▼ -2.00%
- Median HH income
- $54,823
- Composite
- 38.68/100
- National rank
- #4144
- State rank
- #23 of 174 in GA
Livability — Warner Robins
- Score
- 65/100
- State rank
- #227
- US rank
- #13290
Category grades
Schools grade is shown separately in the Schools card above.
Census & demographics
- Census place
- Warner Robins, GA
- County
- Houston County · 157,321 people
- City population
- 92,102
- Metro
- Warner Robins, GA
- Population (ZIP)
- 58,585
- Household income
- $83,082
- Rent vs Own
- Severe rent burden
- 1668.0
Population outlook (Houston County) Hauer SSP2
- Today (2025)
- 169,502 people
- By 2030
- 178,486 · +5.3%
- By 2040
- 194,642 · +14.8%
- By 2050
- 207,119 · +22.2%
- By 2075
- 231,480 · +36.6%
- By 2100
- 235,034 · +38.7%
Race, ethnicity, and origin ACS 2023
- Neighborhood character
- Diverse neighborhood (Simpson 0.63)
- Race & ethnicity
- White 51% Black 32% Two or more races 9% Hispanic / Latino 7% Asian 4%
- Hispanic origin (detail)
- Mexican 4%
- Common ancestry
- Romanian 2% Slovak 2% Lithuanian 2%
- Foreign-born
- 9% · Canada, Vietnam, Jamaica
- Languages at home
- 90% English-only · Spanish 5% Other Asian/Pacific 2% Vietnamese 2%
Political lean MEDSL · Houston
- 2024 margin
- R (+11.3) · D 44.0% · R 55.3%
- 2008→2024 swing
- +8.9pp toward D · 2008: -20.2pp · 2024: -11.3pp
- All cycles
- 2024: R+11.3 2020: R+12.4 2016: R+21.6 2012: R+20.7 2008: R+20.2
Not yet ingested
- Civics
- —
Market trends
- HPI YoY
- ▼ -135.75%
- Current HPI
- 219.8261
- Rent YoY
- ▲ 1.67%
- Metro
- Warner Robins, GA
- State GDP YoY
- ▲ 2.66%
- F500 in state
- 28
Industry mix (Fortune 500 HQ in GA)
| Industry | F500 HQs | Revenue |
|---|---|---|
| Paper / Packaging | 2 | $29B |
|
||
| Retail | 1 | $160B |
|
||
| Transportation / Logistics | 1 | $91B |
|
||
| Airlines | 1 | $62B |
|
||
| Consumer Goods | 1 | $47B |
|
||
| Utilities | 1 | $25B |
|
||
Price history
+0.0% since first listed2 events — show timeline
- 2026-05-19 Listed $230,000 GAMLS
- 2026-05-19 Listed $230,000 CGMLS
Property tax history
+4.1%/yrLatest (2024): $1,102 · +83.3% YoY. Source: county tax records.
Cash-flow waterfall
monthlySold comps — $/sqft
last 12 mo · ≤1 miLoading sold comps…