 🔨 Auction
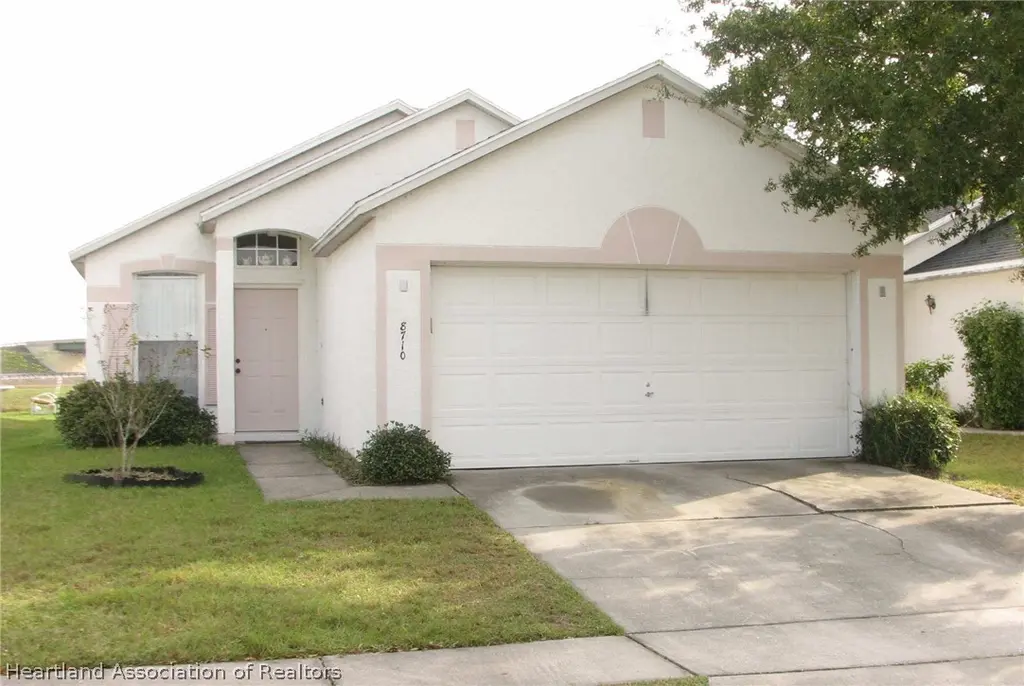
8710 Foley Dr · Rio Pinar, FL
Flood risk 1/10 · Minimal
- FEMA flood zone
- X (unshaded)
- Chance of flooding over 30 yrs
- 0.0%
- Est. flood insurance / yr
- $507 – $1,088
Fire risk 2/10 · Minimal
- Est. fire insurance / yr
- $947 – $1,759
Heat risk 8/10 · Major
- Hot days now (above 108°F)
- 7 days/yr
- Hot days in 30 yrs
- 20 days/yr
Wind risk 9/10 · Severe
- Chance of severe wind over 30 yrs
- 99.0%
Air-quality risk 2/10 · Minimal
- Unhealthy air days now
- 1 days/yr
- Unhealthy air days in 30 yrs
- 1 days/yr
Risk factors via First Street. Map © Google.
Why this score? — see what drove the F grade
The composite is a weighted blend of 9 inputs, each scored 0–100. Each bar is that input's sub-score; the figure is the points it added to the 100-point composite (weight × sub-score).
- ARV discount +7.5/15.0
- Cash flow +5.2/30.0
- Schools +4.1/10.0
- Livability +3.6/5.0
- Rent growth +3.2/5.0
- Condition / age +2.5/5.0
- 1% rule +0.9/10.0
- DSCR +0.0/10.0
- Appreciation +0.0/10.0
$5,000
🖨 Deal sheet 📄 Offer letter ✓ Due diligence
Listing remarks
Foreclosure Auction Ends June 16, 2026 at 11:00 AM EST. Explore this charming 3-bedroom, 2-bath residence set in a peaceful and well-located Orlando community. The list price is the opening bid for the online auction. Sold As-is. Explore more details and submit your bid through Federa Home App.
Key facts
- 3,920 sq ft lot
- 2 garage spots
- Built 1997
Property features AI
Finance
- Other: Zoning: P-D
Exterior
- Parking: 2-car garage
- Utilities: Other water source; Other sewer
- Home design: Single-family residence; One level; Residential property
- Construction: Construction details: see remarks
- Exterior features: Front porch; Other roof
Interior
- Flooring: Other flooring
- Bathrooms: 2 full bathrooms
- Heating & cooling: No heating specified; No cooling specified
- Interior features: Other flooring
Neighborhood map
What this means for you Summary
Snapshot
- This is a 3-bed/2.0-bath single-family listed at $5k.
Deal economics
- At list price, monthly cash flow is $-785 ($-9k/yr) — negative.
- The deal already cash-flows at list — no discount required.
- Meets the 1% rule at list price ($2k rent vs $5k).
Location & tenants
- Location reads 72/100 on livability (#341 in FL) — a middle-class / working-renter tenant base. Strengths: crime A+, employment A+, housing A+; Watch: schools C-, cost of living D+, amenities F.
- Orange (suburban): math 46% / reading 51% proficiency, ranked #43 of 73 in FL (top 59%) — families likely to look elsewhere, expect single-tenant / working-renter base with shorter leases.
- Market conditions: Rents rising (+2.8%/yr); 279 active listings in the ZIP; 33 comparable units currently listed for rent nearby; rentals leasing fast (median 11d on market — plan ~1-2 weeks tenant-placement turnaround); solid renter incomes; 8,053 units permitted in Orange County in 2024 (3,133 in 5+ unit buildings).
Forward outlook
- Local home prices are declining (-3.0%/yr); year-one equity from $2k of loan paydown is wiped out by about $10k of value loss. Plan a longer hold.
- Orange County population projected at +52% by 2050 — long-run rental-demand tailwind backs the buy-and-hold thesis.
Negotiation context
- Only 7 days on market — expect competitive offers; lowballing is unlikely to land.
Risks & watch-outs
- Watch-outs: property tax is 104.0% of price.
- Climate carrying-cost: severe wind risk, 99% chance of damaging wind over 30y; extreme-heat days projected 7→20/yr by 2055 (HVAC capex compounding) — expect insurance premiums to compound above CPI over the hold.
Questions for the listing agent
- What do current leases actually rent for vs. the listed asking? Can we see a recent rent roll and the last 12 months of T-12 income?
- Property tax is high relative to price — has the assessment been appealed recently, and will the sale trigger a re-assessment?
- Is there a deadline driving the sale (1031 exchange, divorce, estate, relocation)? That informs how much negotiation room exists.
- The area grade is low — what's the realistic commute time and amenity access for the typical tenant pool here? Any planned neighborhood developments (good or bad) we should know about?
- What's the average days-on-market for RENTAL listings here right now (not sales)? A rising rental-DOM trend means longer vacancies and softer asking-rent achievability than the comps imply.
- What's the recent tenant-quality profile in this submarket — average credit score on applications, eviction rate, late-payment / NSF rate, and stable-employment percentage? A property-management company in the area should have these aggregated.
- How much new for-sale + rental construction is in the pipeline within 1–3 miles? Heavy new supply typically softens prices + rents 12–24 months out; constrained supply supports both.
Investment metrics
- 1% rule
- 0.59% ✗
- Cap rate
- 3.57%
- Cash-on-cash
- -9.71%
- DSCR
- 0.57
- GRM
- 14.2
CMA / ARV
- ARV (on-the-fly)
- $346,560
- Comps found
- 4
Show comp detail 4 sales within ~0.75 mi
| Address | Dist | Beds/Ba | Sqft | Sold | Price | $/sf | Match |
|---|---|---|---|---|---|---|---|
| 628 Valencia Place Cir | 0.30mi | 3/2.0 | 1,184 (+4%) | 3mo | $360,000 | $304 | 77 |
| 9393 Dubois Blvd | 0.72mi | 3/2.0 | 1,133 (-1%) | 14mo | $265,320 | $234 | 54 |
| 9148 Dubois Blvd | 0.75mi | 3/2.0 | 1,086 (-5%) | 4mo | $295,800 | $272 | 54 |
| 846 Bella Vista Way | 0.46mi | 3/2.0 | 1,066 (-6%) | 23mo | $338,000 | $317 | 49 |
Match score weights: distance 35% · size 25% · config 20% · recency 20%. Top-matched comps best support the ARV.
Projected returns pro-forma
-3.0% appreciation · 2.77% rent growth · sell at horizon
- IRR
- -33.9%
- Equity multiple
- -0.10×
- Total profit
- $-106,591
- Equity at exit
- $51,673
- IRR
- -43.9%
- Equity multiple
- -0.64×
- Total profit
- $-158,988
- Equity at exit
- $29,964
Cash invested: $97,037 (down + closing). Projections, not guarantees.
Landlord ↔ Tenant lean methodology
- Overall (STATE)
- 87 Strongly Landlord-Friendly
- State Florida
- 87 Strongly Landlord-Friendly · R+3
- County
- — inherits STATE
- City
- — inherits STATE
ZIP-level market 32825
- Rents YoY
- 2.8%
- Active inventory
- 279
- Price-to-rent
- 0.2×
Monthly cashflow live
- Estimated rent
- $2,038 high interval (Pro) →
- Mortgage (P&I)
- −$1,817
- Tax est. 1.5%
- −$433 /mo · $5,198/yr
- Insurance
- −$144
- HOA
- −$0
- Vacancy / Maint / Mgmt
- −$428
- Net cashflow
- $-785
Break-even live
UW: 25.0% down · 7.5% · 30yr · 1.5% tax · 5.0% vac · 8.0% maint · 8.0% mgmt
Financing live
Cash to close
- Down payment
- $86,640
- Closing costs
- $10,397
- Reserves months
- —
- Total cash needed
- —
Loan-product check · same deal, 3 products live
Conventional
25% down · 7.5% · 30yr
- Down + closing
- —
- Monthly P&I
- —
- Monthly cashflow
- —
- DSCR
- —
- Eligible?
- —
Personal DTI + credit; lowest rate.
DSCR
20% down · 8.5% · 30yr
- Down + closing
- —
- Monthly P&I
- —
- Monthly cashflow
- —
- DSCR
- —
- Eligible?
- —
No personal income docs; deal must DSCR.
Hard money
10% down · 12.0% · 12mo
- Down + closing
- —
- Monthly P&I
- —
- Monthly cashflow
- —
- DSCR
- —
- Eligible?
- —
Short-term bridge; refi at stabilization.
Rent comps 33 comps
| Address | Beds | Baths | Sqft | Rent | $/sqft | DOM | Units | Dist |
|---|---|---|---|---|---|---|---|---|
| 8693 Foley Dr Orlando, FL | 3.0 | 2.0 | 1178 | $1,500 | $1.27 | 23d | 1 | 0.05mi |
| 466 Valencia Place Cir Orlando, FL | 3.0 | 2.0 | 1184 | $2,470 | $2.09 | 10d | 1 | 0.30mi |
| 1000 Avery Village Loop Orlando, FL | 2.0–3.0 | 2.0 | 1206 | $2,327 | $1.93 | 1d | 13 | 0.47mi |
| 8212 Troxler Dr Orlando, FL | 3.0 | 1.0 | 1200 | $2,250 | $1.88 | 2d | 1 | 0.58mi |
| 469 Glastonbury Dr Orlando, FL | 3.0 | 2.5 | 1300 | $2,195 | $1.69 | 21d | 1 | 0.59mi |
| 1000 Avida Village Cir Orlando, FL | 1.0–3.0 | 1.0–2.0 | 977 | $2,488 | $2.55 | 1d | 22 | 0.59mi |
| 8225 Claire Ann Dr #203 Orlando, FL | 2.0 | 2.0 | 1046 | $1,725 | $1.65 | 3d | 1 | 0.60mi |
| 8103 Lillies Way #107 Orlando, FL | 2.0 | 2.0 | 1000 | $1,600 | $1.60 | 7d | 1 | 0.61mi |
| 8137 Claire Ann Dr #207 Orlando, FL | 2.0 | 2.0 | 1046 | $1,750 | $1.67 | 21d | 1 | 0.61mi |
| 933 Vista Palma Way Orlando, FL | 3.0 | 2.0 | 1016 | $2,150 | $2.12 | 23d | 1 | 0.66mi |
| 8362 Cristobal Cir Unit a Orlando, FL | 3.0 | 1.0 | 1150 | $1,850 | $1.61 | 12d | 1 | 0.66mi |
| 8362 Cristobal Cir Unit a Orlando, FL | 3.0 | 1.0 | 1014 | $1,850 | $1.82 | 3d | 1 | 0.66mi |
| 8362 Cristobal Cir Unit a Orlando, FL | 3.0 | 1.0 | 1150 | $1,850 | $1.61 | 14d | 1 | 0.66mi |
| 9010 Running Bull Rd Orlando, FL | 1.0–4.0 | 1.0–4.0 | 1032 | $1,632 | $1.58 | 4d | 1 | 0.76mi |
| 604 Laurel Cove Ct Orlando, FL | 1.0–3.0 | 1.0–2.0 | 892 | $1,968 | $2.21 | 1d | 15 | 0.81mi |
| 314 Muscogee Ln Orlando, FL | 3.0 | 2.5 | 1296 | $2,500 | $1.93 | 23d | 1 | 0.82mi |
| 1108 Constantine St Orlando, FL | 4.0 | 2.0 | 1491 | $2,375 | $1.59 | 10d | 1 | 0.86mi |
| 1108 Constantine St Orlando, FL | 4.0 | 2.0 | 1491 | $2,350 | $1.58 | 2d | 1 | 0.86mi |
| 8211 Sun Spring Cir #41 Orlando, FL | 2.0 | 2.0 | 1064 | $1,499 | $1.41 | 4d | 1 | 0.87mi |
| 8215 Sun Spring Cir #23 Orlando, FL | 2.0 | 2.0 | 1064 | $1,550 | $1.46 | 21d | 1 | 0.93mi |
| 7934 Winter Song Dr Orlando, FL | 3.0 | 2.0 | 1315 | $2,205 | $1.68 | 10d | 1 | 0.95mi |
| 1228 Pine Sap Ct Orlando, FL | 3.0 | 2.0 | 1366 | $2,300 | $1.68 | 12d | 1 | 0.98mi |
| 9942 Dean Oaks Ct Orlando, FL | 3.0 | 2.0 | 1140 | $2,095 | $1.84 | 21d | 1 | 1.05mi |
| 454 Loblolly Ln Unit Labs Orlando, FL | 3.0 | 2.0 | 1315 | $2,300 | $1.75 | 4d | 1 | 1.07mi |
| 7960 Pine Crossings Cir Orlando, FL | 1.0–2.0 | 1.0–2.0 | 870 | $1,911 | $2.20 | 1d | 30 | 1.07mi |
| 949 Crowsnest Cir Orlando, FL | 1.0–2.0 | 1.0–2.0 | 822 | $1,754 | $2.13 | 1d | 31 | 1.09mi |
| 512 Owl Cir Orlando, FL | 2.0 | 2.0 | 1220 | $1,900 | $1.56 | 12d | 1 | 1.21mi |
| 8102 Turkey Dr Orlando, FL | 2.0 | 2.0 | 1010 | $1,850 | $1.83 | 23d | 1 | 1.26mi |
| 10038 Vista Laguna Dr Orlando, FL | 1.0–3.0 | 1.0–2.0 | 1008 | $2,526 | $2.51 | 2d | 16 | 1.35mi |
| 10039 Massey St Orlando, FL | 2.0 | 2.0 | 948 | $1,595 | $1.68 | 2d | 1 | 1.46mi |
| 10041 Massey St Alafaya, FL | 2.0 | 2.0 | 948 | $1,595 | $1.68 | 23d | 1 | 1.46mi |
| 7909 Richwood Dr Orlando, FL | 2.0 | 2.0 | 936 | $1,950 | $2.08 | 21d | 1 | 1.47mi |
| 1124 Crosstown Way Orlando, FL | 1.0–3.0 | 1.0–2.0 | 1104 | $2,730 | $2.47 | 1d | 10 | 1.50mi |
Listing history 6 events
-
2026-06-16days on market $5,000 Active 7 DOM
-
2026-06-15days on market $5,000 Active 6 DOM
-
2026-06-13days on market $5,000 Active 4 DOM
-
2026-06-13days on market $5,000 Active 3 DOM
-
2026-06-10remarks 335-char remark
-
2026-06-10$5,000 Active 1 DOM
ⓘ Source: listings_history table (triggers on properties + properties_extension) + one-shot
backfill from property_details.listing_events for pre-trigger history.
Climate risk First Street
- Flood 1/10 Low FEMA zone X (unshaded) · 0% chance over 30 yrs
- Wildfire 2/10 Low
- Heat 8/10 Severe 7 d/yr ≥108°F today · 20 d/yr by 30 yrs out
- Wind 9/10 Extreme 99% chance of damaging wind over 30 yrs
- Air quality 2/10 Low 1 unhealthy d/yr today · 1 by 30 yrs out
Nearby sold comps map
Loading sold comps map…
Walkable amenities ~0.75 mi
Loading nearby amenities…
Taxation est. · year 1
- Rental income
- $24,457
- − Mortgage interest
- −$19,413
- − Property taxes
- −$5,198
- − Insurance
- −$1,733
- − Repairs & maintenance
- −$1,957
- − Management
- −$1,957
- − Depreciation
- −$10,082
- Taxable loss
- −$15,882
- Est. tax savings @ 24.0%
- +$3,812
- After-tax cash flow
- $-5,608/yr
For passive investors: Depreciation is non-cash, so a rental often shows a tax loss while cash-flowing — sheltering income. Rental losses are passive: they offset passive income freely, and up to $25,000/yr can offset ordinary (W-2) income if you actively participate and your MAGI is under $100k (phasing out to $0 by $150k); unused losses carry forward. On sale, claimed depreciation is recaptured at up to 25%, and gains may owe capital-gains tax (a 1031 exchange can defer both). Figures are a year-1 estimate at your 24.0% rate — not tax advice; consult a CPA.
Schools (NCES district)
- District
- Orange
- NCES district ID
- 1201440
- Math proficiency
- 46% ▼ -9.00%
- Reading proficiency
- 51% ▼ -2.00%
- Median HH income
- $49,350
- Composite
- 41.47/100
- National rank
- #3461
- State rank
- #43 of 73 in FL
Livability — Rio Pinar
- Score
- 72/100
- State rank
- #341
- US rank
- #5937
Category grades
Schools grade is shown separately in the Schools card above.
Census & demographics
- County
- Orange County · 1,471,359 people
- Metro
- Orlando-Kissimmee-Sanford, FL
- Population (ZIP)
- 63,698
- Household income
- $81,651
- Rent vs Own
- Severe rent burden
- 1458.0
Population outlook (Orange County) Hauer SSP2
- Today (2025)
- 1,618,226 people
- By 2030
- 1,787,404 · +10.5%
- By 2040
- 2,125,621 · +31.4%
- By 2050
- 2,454,016 · +51.6%
- By 2075
- 3,173,711 · +96.1%
- By 2100
- 3,607,781 · +122.9%
Race, ethnicity, and origin ACS 2023
- Neighborhood character
- Diverse neighborhood (Simpson 0.66)
- Race & ethnicity
- Hispanic / Latino 47% White 32% Two or more races 23% Black 11% Asian 7%
- Hispanic origin (detail)
- Mexican 2% Puerto Rican 25% Cuban 6% Dominican 3%
- Common ancestry
- Lithuanian 1% Romanian 1% Slovak 1%
- Foreign-born
- 20% · Canada, Vietnam, Jamaica
- Languages at home
- 56% English-only · Spanish 35% Other Indo-European 3% Vietnamese 2%
Political lean MEDSL · Orange
- 2024 margin
- D (+13.6) · D 56.1% · R 42.5% · Other 1.3%
- 2008→2024 swing
- -5.0pp toward R · 2008: 18.6pp · 2024: 13.6pp
- All cycles
- 2024: D+13.6 2020: D+23.1 2016: D+24.6 2012: D+18.2 2008: D+18.6
Not yet ingested
- Civics
- —
Market trends
- HPI YoY
- ▼ -171.52%
- Current HPI
- 315.8496
- Rent YoY
- ▲ 2.77%
- Metro
- Orlando-Kissimmee-Sanford, FL
- State GDP YoY
- ▲ 3.28%
- F500 in state
- 36
Industry mix (Fortune 500 HQ in FL)
| Industry | F500 HQs | Revenue |
|---|---|---|
| Industrial Technology | 2 | $29B |
|
||
| Insurance | 2 | $17B |
|
||
| Retail | 1 | $60B |
|
||
| Technology Distribution | 1 | $58B |
|
||
| Homebuilding | 1 | $35B |
|
||
| Technology Manufacturing | 1 | $35B |
|
||
Price history
-99.1% since first listed4 events — show timeline
- 2026-06-09 Listed $5,000 HAOR as distributed by MLS GRID
- 2008-08-15 Sold (Public Records) $174,000 Public Records
- 1995-08-07 Sold (Public Records) $18,400 Public Records
- 1994-05-26 Sold (Public Records) $537,600 Public Records
Property tax history
+2.7%/yrLatest (2025): $1,367 · +10.8% YoY. Source: county tax records.
Cash-flow waterfall
monthlySold comps — $/sqft
last 12 mo · ≤1 miLoading sold comps…