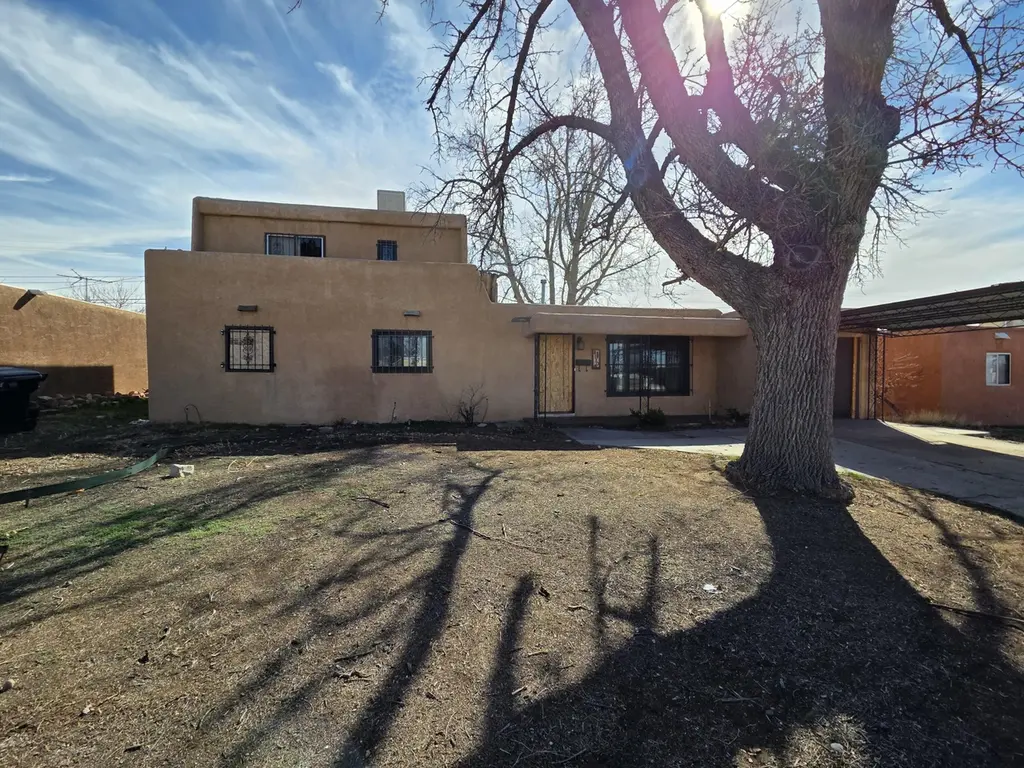
8110 Robin Ave NE · Albuquerque, NM
Flood risk 4/10 · Minor
- FEMA flood zone
- X (unshaded)
- Chance of flooding over 30 yrs
- 0.22%
- Est. flood insurance / yr
- $507 – $1,088
Fire risk 1/10 · Minimal
- Est. fire insurance / yr
- $706 – $1,312
Heat risk 4/10 · Minor
- Hot days now (above 94°F)
- 6 days/yr
- Hot days in 30 yrs
- 15 days/yr
Wind risk 1/10 · Minimal
- Chance of severe wind over 30 yrs
- —
Air-quality risk 2/10 · Minimal
- Unhealthy air days now
- 1 days/yr
- Unhealthy air days in 30 yrs
- 3 days/yr
Risk factors via First Street. Map © Google.
Why this score? — see what drove the C+ grade
The composite is a weighted blend of 9 inputs, each scored 0–100. Each bar is that input's sub-score; the figure is the points it added to the 100-point composite (weight × sub-score).
- Cash flow +19.4/30.0
- ARV discount +15.0/15.0
- DSCR +6.1/10.0
- Schools +5.3/10.0
- 1% rule +4.8/10.0
- Livability +3.6/5.0
- Rent growth +3.2/5.0
- Condition / age +2.5/5.0
- Appreciation +0.0/10.0
$219,000
🖨 Deal sheet (PDF) 📄 Offer letter ✓ Due diligence
Listing remarks MLS
PRICE REDUCED! Bank Owned Fixer Upper in Prime NE Albuquerque Location! ARV $385-400KGreat opportunity in a highly desirable NE Albuquerque neighborhood. This property needs Repairs, New Roof, Remodeling, a Full Rehab--perfect for investors, flippers, or buyers looking to build equity with renovations. Conveniently located close to the Abq Uptown district shopping malls, restaurants, and everyday amenities, with easy access to I-40 for commuting. Excellent potential in a strong area where updated homes are in demand. Property is being sold As-Is. Cash only.
Key facts
- 6,708 sq ft lot
- Garage
- Built 1953
Tags
Neighborhood map
What this means for you Summary
Snapshot
- This is a 4-bed/3.0-bath single-family listed at $219k.
Deal economics
- At list price, monthly cash flow is $246 ($3k/yr) — positive.
- The deal already cash-flows at list — no discount required.
- To meet the 1% rule (rent ≥ 1% of price), the offer needs to be $215k (1.7% below list).
- Recommended offer: $193k (12.0% below list) — sets the bar for market timing.
- Cap rate 7.6% vs local median 3.7% in Albuquerque — top-decile yield for the area; either an underpriced asset or a hidden risk that comps aren't pricing in. Stress-test before assuming the spread holds.
Location & tenants
- Location reads 72/100 on livability (#13 in NM) — a middle-class / working-renter tenant base. Strengths: amenities A+, commute A+, cost of living A+; Watch: schools D-, crime F.
- Albuquerque Public Schools (urban): math 51% / reading 75% proficiency, ranked #3 of 29 in NM (top 10%) — acceptable for families but not a draw, mixed tenant base, ~2y average lease; 60% free/reduced lunch — lower-income household profile, screen leases tightly.
- Market conditions: Rents rising (+2.7%/yr); 192 active listings in the ZIP; 6 comparable units currently listed for rent nearby; rentals at typical pace (median 25d on market — plan ~3-4 weeks tenant-placement turnaround); 1,316 units permitted in Bernalillo County in 2024 (546 in 5+ unit buildings).
- This rent runs 40% of the median local income ($65k/yr) — at the standard rent-burdened threshold; future hikes will face affordability resistance.
Forward outlook
- Local home prices are declining (-3.0%/yr); year-one equity from $2k of loan paydown is wiped out by about $7k of value loss. Plan a longer hold.
Negotiation context
- It's been on market 125 days — a 12% lower offer ($193k) is reasonable based on typical stale-listing flexibility.
Risks & watch-outs
- Watch-outs: built in 1953 — expect roof / HVAC / electrical / plumbing capex.
Questions for the listing agent
- It's been on market 125 days. Have you received any prior offers? Is the seller open to a 12% concession, seller financing, or rate buy-down credit?
- Built in 1953 — when were the roof, HVAC, electrical panel, plumbing, and water heater last replaced?
- Why hasn't it sold? Are there any deal-killer items the seller is aware of (foundation, flood, title, zoning, code violations)?
- Is there a deadline driving the sale (1031 exchange, divorce, estate, relocation)? That informs how much negotiation room exists.
- Schools are D-rated, which usually means shorter tenancies and higher turnover. Who's the typical renter profile here, and what's been the actual vacancy rate?
- Crime grade is F in this area — have there been break-ins, vandalism, or insurance claims at this property in the last 3 years? What carrier currently insures it and at what premium?
- What's the average days-on-market for RENTAL listings here right now (not sales)? A rising rental-DOM trend means longer vacancies and softer asking-rent achievability than the comps imply.
- What's the recent tenant-quality profile in this submarket — average credit score on applications, eviction rate, late-payment / NSF rate, and stable-employment percentage? A property-management company in the area should have these aggregated.
- How much new for-sale + rental construction is in the pipeline within 1–3 miles? Heavy new supply typically softens prices + rents 12–24 months out; constrained supply supports both.
Investment metrics
- 1% rule
- 0.98% ✗
- Cap rate
- 7.64%
- Cash-on-cash
- 4.81%
- DSCR
- 1.21
- GRM
- 8.5
CMA / ARV
- ARV (median comp)
- $379,590
- List price
- $219,000
- Delta
- -42.31%
- Verdict
- UNDERPRICED
- Comps
- 20 within 1.0 mi
Show comp detail 5 sales within ~0.75 mi
| Address | Dist | Beds/Ba | Sqft | Sold | Price | $/sf | Match |
|---|---|---|---|---|---|---|---|
| 8904 Haines Ave NE | 0.45mi | 4/3.0 | 2,809 (+2%) | 16mo | $470,000 | $167 | 62 |
| 1525 Marron Cir NE | 0.34mi | 4/2.5 | 2,443 (-11%) | 3mo | $455,000 | $186 | 61 |
| 7200 Constitution Ave NE | 0.74mi | 4/3.0 | 2,454 (-10%) | 1mo | $450,000 | $183 | 48 |
| 2120 Hoffman Dr NE | 0.46mi | 3/3.0 (-1) | 2,377 (-13%) | 7mo | $395,000 | $166 | 45 |
| 1620 Moon St NE | 0.68mi | 5/2.5 (+1) | 2,476 (-10%) | 4mo | $360,000 | $145 | 42 |
Match score weights: distance 35% · size 25% · config 20% · recency 20%. Top-matched comps best support the ARV.
Projected returns pro-forma
-3.0% appreciation · 2.67% rent growth · sell at horizon
- IRR
- -9.2%
- Equity multiple
- 0.67×
- Total profit
- $-20,533
- Equity at exit
- $32,654
- IRR
- -0.1%
- Equity multiple
- 0.99×
- Total profit
- $-621
- Equity at exit
- $18,935
Cash invested: $61,320 (down + closing). Projections, not guarantees.
Landlord ↔ Tenant lean methodology
- Overall (STATE)
- 55 Moderately Landlord-Leaning
- State New Mexico
- 55 Moderately Landlord-Leaning · D+3
- County
- — inherits STATE
- City
- — inherits STATE
ZIP-level market 87110
- Rents YoY
- 2.7%
- Active inventory
- 192
- Price-to-rent
- 8.5×
Monthly cashflow live
- Estimated rent
- $2,152 high interval (Pro) →
- Mortgage (P&I)
- −$1,148
- Tax from tax record
- −$215 /mo · $2,574/yr
- Insurance
- −$91
- HOA
- −$0
- Vacancy / Maint / Mgmt
- −$452
- Net cashflow
- $246
Break-even live
Sensitivity live
| Price | -10% $370 | -5% $308 | +0% $246 | +5% $184 | +10% $122 |
|---|---|---|---|---|---|
| Rent | -10% $76 | -5% $161 | +0% $246 | +5% $331 | +10% $416 |
| Rate | -1.0pp $356 | -0.5pp $302 | base $246 | +0.5pp $189 | +1.0pp $132 |
UW: 25.0% down · 7.5% · 30yr · 1.5% tax · 5.0% vac · 8.0% maint · 8.0% mgmt
Financing live
Cash to close
- Down payment
- $54,750
- Closing costs
- $6,570
- Reserves months
- —
- Total cash needed
- —
Loan-product check · same deal, 3 products live
Conventional
25% down · 7.5% · 30yr
- Down + closing
- —
- Monthly P&I
- —
- Monthly cashflow
- —
- DSCR
- —
- Eligible?
- —
Personal DTI + credit; lowest rate.
DSCR
20% down · 8.5% · 30yr
- Down + closing
- —
- Monthly P&I
- —
- Monthly cashflow
- —
- DSCR
- —
- Eligible?
- —
No personal income docs; deal must DSCR.
Hard money
10% down · 12.0% · 12mo
- Down + closing
- —
- Monthly P&I
- —
- Monthly cashflow
- —
- DSCR
- —
- Eligible?
- —
Short-term bridge; refi at stabilization.
Rent comps 6 comps
| Address | Beds | Baths | Sqft | Rent | $/sqft | DOM | Units | Dist |
|---|---|---|---|---|---|---|---|---|
| 1721 Utah St NE Albuquerque, NM | 3.0 | 2.0 | 1917 | $1,900 | $0.99 | 4d | 1 | 0.18mi |
| 1413 Field Dr NE Albuquerque, NM | 3.0 | 2.0 | 1847 | $3,000 | $1.62 | 45d | 1 | 0.54mi |
| 7408 Euclid Ave NE Albuquerque, NM | 3.0 | 2.0 | 1750 | $2,150 | $1.23 | 24d | 1 | 0.58mi |
| 1504 Mesilla St NE Albuquerque, NM | 3.0 | 2.0 | 2261 | $2,000 | $0.88 | 4d | 1 | 0.73mi |
| 1316 Espejo St NE Albuquerque, NM | 3.0 | 2.0 | 1876 | $2,200 | $1.17 | 4d | 1 | 1.10mi |
| 1705 California St NE Albuquerque, NM | 3.0 | 2.0 | 1832 | $1,900 | $1.04 | 24d | 1 | 1.27mi |
Listing history 19 events
-
2026-06-18days on market $219,000 Active 125 DOM
-
2026-06-17days on market $219,000 Active 124 DOM
-
2026-06-16days on market $219,000 Active 123 DOM
-
2026-06-15days on market $219,000 Active 122 DOM
-
2026-06-13days on market $219,000 Active 120 DOM
-
2026-06-10days on market $219,000 Active 117 DOM
-
2026-06-09days on market $219,000 Active 116 DOM
-
2026-06-08days on market $219,000 Active 115 DOM
-
2026-06-07remarks 593-char remark
-
2026-06-07days on market $219,000 Active 114 DOM
-
2026-06-05days on market $219,000 Active 111 DOM
-
2026-06-03days on market $219,000 Active 110 DOM
-
2026-06-02days on market $219,000 Active 109 DOM
-
2026-06-01days on market $219,000 Active 108 DOM
-
2026-05-31days on market $219,000 Active 107 DOM
-
2026-05-05price $229,000 565-char remark
Show marketing remark (565 chars)
PRICE REDUCED! Bank Owned Fixer Upper in Prime NE Albuquerque Location! ARV $385-400KGreat opportunity in a highly desirable NE Albuquerque neighborhood. This property needs Repairs, New Roof, Remodeling, a Full Rehab--perfect for investors, flippers, or buyers looking to build equity with renovations. Conveniently located close to the Abq Uptown district shopping malls, restaurants, and everyday amenities, with easy access to I-40 for commuting. Excellent potential in a strong area where updated homes are in demand. Property is being sold As-Is. Cash only.
-
2026-03-14price $245,000 565-char remark
Show marketing remark (565 chars)
PRICE REDUCED! Bank Owned Fixer Upper in Prime NE Albuquerque Location! ARV $385-400KGreat opportunity in a highly desirable NE Albuquerque neighborhood. This property needs Repairs, New Roof, Remodeling, a Full Rehab--perfect for investors, flippers, or buyers looking to build equity with renovations. Conveniently located close to the Abq Uptown district shopping malls, restaurants, and everyday amenities, with easy access to I-40 for commuting. Excellent potential in a strong area where updated homes are in demand. Property is being sold As-Is. Cash only.
-
2026-02-11soldstatus $269,000
-
2026-02-06$259,000 Active 565-char remark
Show marketing remark (565 chars)
PRICE REDUCED! Bank Owned Fixer Upper in Prime NE Albuquerque Location! ARV $385-400KGreat opportunity in a highly desirable NE Albuquerque neighborhood. This property needs Repairs, New Roof, Remodeling, a Full Rehab--perfect for investors, flippers, or buyers looking to build equity with renovations. Conveniently located close to the Abq Uptown district shopping malls, restaurants, and everyday amenities, with easy access to I-40 for commuting. Excellent potential in a strong area where updated homes are in demand. Property is being sold As-Is. Cash only.
ⓘ Source: listings_history table (triggers on properties + properties_extension) + one-shot
backfill from property_details.listing_events for pre-trigger history.
Tax reassessment forecast NM · Resets to sale price
- Current annual tax
- $2,574 · $215/mo
- Projected year-2 tax
- $2,574 · $215/mo
- Expected delta
- $0/yr ($0/mo · 0.0%)
ⓘ Screening estimate from a state-policy table — verify with the county assessor before closing.
Climate risk First Street
- Flood 4/10 Moderate FEMA zone X (unshaded) · 22% chance over 30 yrs
- Wildfire 1/10 Low
- Heat 4/10 Moderate 6 d/yr ≥94°F today · 15 d/yr by 30 yrs out
- Wind 1/10 Low
- Air quality 2/10 Low 1 unhealthy d/yr today · 3 by 30 yrs out
Nearby sold comps map
Loading sold comps map…
Walkable amenities ~0.75 mi
Loading nearby amenities…
Taxation est. · year 1
- Rental income
- $25,827
- − Mortgage interest
- −$12,267
- − Property taxes
- −$2,574
- − Insurance
- −$1,095
- − Repairs & maintenance
- −$2,066
- − Management
- −$2,066
- − Depreciation
- −$6,371
- Taxable loss
- −$613
- Est. tax savings @ 24.0%
- +$147
- After-tax cash flow
- $3,100/yr
For passive investors: Depreciation is non-cash, so a rental often shows a tax loss while cash-flowing — sheltering income. Rental losses are passive: they offset passive income freely, and up to $25,000/yr can offset ordinary (W-2) income if you actively participate and your MAGI is under $100k (phasing out to $0 by $150k); unused losses carry forward. On sale, claimed depreciation is recaptured at up to 25%, and gains may owe capital-gains tax (a 1031 exchange can defer both). Figures are a year-1 estimate at your 24.0% rate — not tax advice; consult a CPA.
Schools (NCES district)
- District
- Albuquerque Public Schools
- NCES district ID
- 3500060
- Math proficiency
- 51% ▲ 30.00%
- Reading proficiency
- 75% ▲ 45.00%
- Median HH income
- $48,151
- Composite
- 53.29/100
- National rank
- #1487
- State rank
- #3 of 29 in NM
Livability — Albuquerque
- Score
- 72/100
- State rank
- #13
- US rank
- #6219
Category grades
Schools grade is shown separately in the Schools card above.
Census & demographics
- Census place
- Albuquerque, NM
- County
- Bernalillo County · 647,165 people
- City population
- 647,165
- Metro
- Albuquerque, NM
- Population (ZIP)
- 39,685
- Household income
- $64,892
- Rent vs Own
- Severe rent burden
- 1845.0
Population outlook (Bernalillo County) Hauer SSP2
- Today (2025)
- 704,528 people
- By 2030
- 711,723 · +1.0%
- By 2040
- 714,522 · +1.4%
- By 2050
- 709,274 · +0.7%
- By 2075
- 680,015 · -3.5%
- By 2100
- 619,879 · -12.0%
Race, ethnicity, and origin ACS 2023
- Neighborhood character
- Diverse neighborhood (Simpson 0.65)
- Race & ethnicity
- White 44% Hispanic / Latino 39% Two or more races 18% Native American 5% Black 4% Asian 2%
- Hispanic origin (detail)
- Mexican 22%
- Common ancestry
- Lithuanian 2% Italian 2% Iranian 2%
- Foreign-born
- 8% · Canada, China, Vietnam
- Languages at home
- 80% English-only · Spanish 14% Chinese 1% Other Indo-European 1%
Political lean MEDSL · Bernalillo
- 2024 margin
- Strong D (+21.0) · D 59.2% · R 38.2% · Other 2.6%
- 2008→2024 swing
- -0.3pp no change · 2008: 21.4pp · 2024: 21.0pp
- All cycles
- 2024: D+21.0 2020: D+24.4 2016: D+17.8 2012: D+16.2 2008: D+21.4
Not yet ingested
- Civics
- —
Market trends
- HPI YoY
- ▼ -329.45%
- Current HPI
- 256.0806
- Rent YoY
- ▲ 2.67%
- Metro
- Albuquerque, NM
- State GDP YoY
- —
- F500 in state
- 0
Price history
-11.6% since first listed4 events — show timeline
- 2026-05-05 Price Changed $229,000 Southwest MLS
- 2026-03-14 Price Changed $245,000 Southwest MLS
- 2026-02-11 Sold (Public Records) $269,000 Public Records
- 2026-02-06 Listed $259,000 Southwest MLS
Property tax history
+9.5%/yrLatest (2025): $2,574 · +3.3% YoY. Source: county tax records.
Cash-flow waterfall
monthlySold comps — $/sqft
last 12 mo · ≤1 miLoading sold comps…