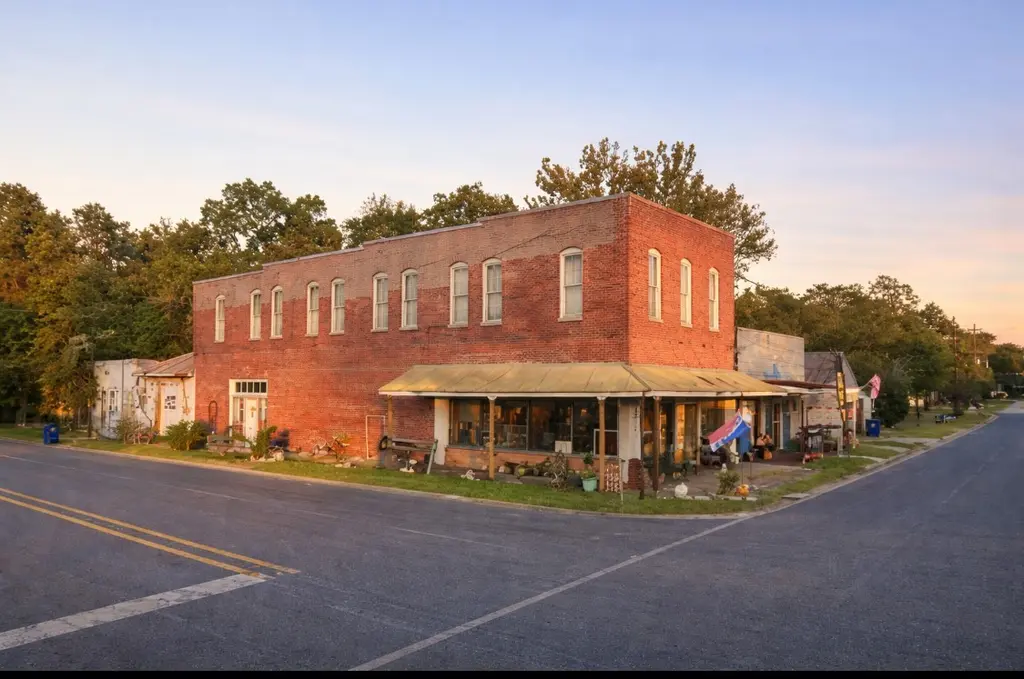
100 E 2nd St · Groveton, TX
Flood risk 1/10 · Minimal
- FEMA flood zone
- —
- Chance of flooding over 30 yrs
- 0.0%
- Est. flood insurance / yr
- —
Fire risk 5/10 · Moderate
- Est. fire insurance / yr
- $1,222 – $2,270
Heat risk 8/10 · Major
- Hot days now (above 111°F)
- 7 days/yr
- Hot days in 30 yrs
- 25 days/yr
Wind risk 8/10 · Major
- Chance of severe wind over 30 yrs
- 92.0%
Air-quality risk 1/10 · Minimal
- Unhealthy air days now
- 0 days/yr
- Unhealthy air days in 30 yrs
- 0 days/yr
Risk factors via First Street. Map © Google.
Why this score? — see what drove the C+ grade
The composite is a weighted blend of 9 inputs, each scored 0–100. Each bar is that input's sub-score; the figure is the points it added to the 100-point composite (weight × sub-score).
- Cash flow +22.4/30.0
- ARV discount +7.5/15.0
- DSCR +7.2/10.0
- Appreciation +7.2/10.0
- 1% rule +5.9/10.0
- Schools +3.8/10.0
- Livability +3.1/5.0
- Rent growth +2.5/5.0
- Condition / age +1.0/5.0
$99,900
🖨 Deal sheet (PDF) 📄 Offer letter ✓ Due diligence
Listing remarks
Step into history with this 1915 brick building located in Historic Downtown Groveton, sitting directly across from the beautifully restored Trinity County Courthouse. This remarkable property once served as both home and business to one of Groveton's oldest families. The West family operated their retail business downstairs while raising generations of their family in the upstairs living quarters. The walls of this building hold over a century of stories, community history, and small-town charm. The possibilities for this property are truly endless. With its prime downtown location and historic character, it could easily be transformed into:Retail space, Apartments or loft living, Airbnb o
Key facts
- Historic character
- Brick building
- Retail space
Tags
Neighborhood map
What this means for you Summary
Snapshot
- This is a 3-bed/1.0-bath single-family listed at $100k. Condition is rated poor.
Deal economics
- At list price, monthly cash flow is $167 ($2k/yr) — positive.
- The deal already cash-flows at list — no discount required.
- Meets the 1% rule at list price ($1k rent vs $100k).
- Recommended offer: $98k (1.5% below list) — sets the bar for market timing.
Location & tenants
- Location reads 61/100 on livability (#995 in TX) — a middle-class / working-renter tenant base. Strengths: cost of living A+, crime A-, housing B+; Watch: amenities F, commute F, employment F.
- Groveton ISD (rural): math 45% / reading 46% proficiency, ranked #281 of 826 in TX (top 34%) — families likely to look elsewhere, expect single-tenant / working-renter base with shorter leases.
- Zoned schools: Groveton J H-H S (math 50% / reading 49%, grade D, #509 of 1,632 statewide, top 34%, 428 students, 62% FRL).
- Market conditions: 56 active listings in the ZIP; 1 units permitted in Trinity County in 2024 (0 in 5+ unit buildings).
Forward outlook
- In year one you build about $5k of equity ($691 loan paydown + $4k appreciation (4.4% local appreciation)).
- Trinity County population projected at -13% by 2050 — secular population decline; favor cash flow + early exit over multi-decade hold.
- At projected returns (4.4% appreciation + 3.0% rent growth), your $28k cash investment doubles in ~4 years — after that, you're playing with house money.
- By year 7, paydown + projected appreciation supports a ~$33k cash-out refi (75% LTV) — recoverable capital for the next deal without selling this one.
Negotiation context
- It's been on market 19 days — a 2% lower offer ($98k) is reasonable based on typical stale-listing flexibility.
Risks & watch-outs
- Watch-outs: built in 1915 — expect roof / HVAC / electrical / plumbing capex.
- Climate carrying-cost: severe wind risk, 92% chance of damaging wind over 30y; moderate wildfire risk; extreme-heat days projected 7→25/yr by 2055 (HVAC capex compounding) — expect insurance premiums to compound above CPI over the hold.
Questions for the listing agent
- Have any recent inspections been done? Can we get a copy of the seller's disclosures and any deferred-maintenance estimates?
- Built in 1915 — when were the roof, HVAC, electrical panel, plumbing, and water heater last replaced?
- Is there a deadline driving the sale (1031 exchange, divorce, estate, relocation)? That informs how much negotiation room exists.
- Schools are D-rated, which usually means shorter tenancies and higher turnover. Who's the typical renter profile here, and what's been the actual vacancy rate?
- What's the average days-on-market for RENTAL listings here right now (not sales)? A rising rental-DOM trend means longer vacancies and softer asking-rent achievability than the comps imply.
- What's the recent tenant-quality profile in this submarket — average credit score on applications, eviction rate, late-payment / NSF rate, and stable-employment percentage? A property-management company in the area should have these aggregated.
- How much new for-sale + rental construction is in the pipeline within 1–3 miles? Heavy new supply typically softens prices + rents 12–24 months out; constrained supply supports both.
Investment metrics
- 1% rule
- 1.09% ✓
- Cap rate
- 8.30%
- Cash-on-cash
- 7.16%
- DSCR
- 1.32
- GRM
- 7.7
CMA / ARV
- ARV (on-the-fly)
- $100,000
- Comps found
- 1
Show comp detail 1 sale within ~0.75 mi
| Address | Dist | Beds/Ba | Sqft | Sold | Price | $/sf | Match |
|---|---|---|---|---|---|---|---|
| 100 E 2nd St | 0.00mi | 3/1.0 | 4,000 (0%) | 1mo | $99,900 | $25 | 99 |
Match score weights: distance 35% · size 25% · config 20% · recency 20%. Top-matched comps best support the ARV.
Projected returns pro-forma
4.41% appreciation · 3.0% rent growth · sell at horizon
- IRR
- 17.6%
- Equity multiple
- 2.08×
- Total profit
- $30,314
- Equity at exit
- $53,043
- IRR
- 18.1%
- Equity multiple
- 4.01×
- Total profit
- $84,201
- Equity at exit
- $88,722
Cash invested: $27,972 (down + closing). Projections, not guarantees.
Landlord ↔ Tenant lean methodology
- Overall (STATE)
- 87 Strongly Landlord-Friendly
- State Texas
- 87 Strongly Landlord-Friendly · R+5
- County
- — inherits STATE
- City
- — inherits STATE
ZIP-level market 75845
- Home prices YoY
- 2.6%
- Active inventory
- 56
- Price-to-rent
- 7.7×
Monthly cashflow live
- Estimated rent
- $1,085 medium interval (Pro) →
- Mortgage (P&I)
- −$524
- Tax est. 1.5%
- −$125 /mo · $1,498/yr
- Insurance
- −$42
- HOA
- −$0
- Vacancy / Maint / Mgmt
- −$228
- Net cashflow
- $167
Break-even live
Sensitivity live
| Price | -10% $236 | -5% $201 | +0% $167 | +5% $132 | +10% $98 |
|---|---|---|---|---|---|
| Rent | -10% $81 | -5% $124 | +0% $167 | +5% $210 | +10% $253 |
| Rate | -1.0pp $217 | -0.5pp $192 | base $167 | +0.5pp $141 | +1.0pp $115 |
UW: 25.0% down · 7.5% · 30yr · 1.5% tax · 5.0% vac · 8.0% maint · 8.0% mgmt
Financing live
Cash to close
- Down payment
- $24,975
- Closing costs
- $2,997
- Reserves months
- —
- Total cash needed
- —
Loan-product check · same deal, 3 products live
Conventional
25% down · 7.5% · 30yr
- Down + closing
- —
- Monthly P&I
- —
- Monthly cashflow
- —
- DSCR
- —
- Eligible?
- —
Personal DTI + credit; lowest rate.
DSCR
20% down · 8.5% · 30yr
- Down + closing
- —
- Monthly P&I
- —
- Monthly cashflow
- —
- DSCR
- —
- Eligible?
- —
No personal income docs; deal must DSCR.
Hard money
10% down · 12.0% · 12mo
- Down + closing
- —
- Monthly P&I
- —
- Monthly cashflow
- —
- DSCR
- —
- Eligible?
- —
Short-term bridge; refi at stabilization.
Listing history 2 events
-
2026-03-26status Pending
-
2026-03-07$99,900 Active
ⓘ Source: listings_history table (triggers on properties + properties_extension) + one-shot
backfill from property_details.listing_events for pre-trigger history.
Climate risk First Street
- Flood 1/10 Low 0% chance over 30 yrs
- Wildfire 5/10 Major
- Heat 8/10 Severe 7 d/yr ≥111°F today · 25 d/yr by 30 yrs out
- Wind 8/10 Severe 92% chance of damaging wind over 30 yrs
- Air quality 1/10 Low 0 unhealthy d/yr today · 0 by 30 yrs out
Nearby sold comps map
Loading sold comps map…
Walkable amenities ~0.75 mi
Loading nearby amenities…
Taxation est. · year 1
- Rental income
- $13,021
- − Mortgage interest
- −$5,596
- − Property taxes
- −$1,498
- − Insurance
- −$500
- − Repairs & maintenance
- −$1,042
- − Management
- −$1,042
- − Depreciation
- −$2,906
- Taxable income
- $438
- Est. tax owed @ 24.0%
- −$105
- After-tax cash flow
- $1,897/yr
For passive investors: Depreciation is non-cash, so a rental often shows a tax loss while cash-flowing — sheltering income. Rental losses are passive: they offset passive income freely, and up to $25,000/yr can offset ordinary (W-2) income if you actively participate and your MAGI is under $100k (phasing out to $0 by $150k); unused losses carry forward. On sale, claimed depreciation is recaptured at up to 25%, and gains may owe capital-gains tax (a 1031 exchange can defer both). Figures are a year-1 estimate at your 24.0% rate — not tax advice; consult a CPA.
Condition & rehab AI · 10 photos
This historic 1915 brick building in Groveton, TX, requires extensive repairs and renovations to bring it up to modern standards. Significant structural and exterior damage, along with interior wear and outdated systems, make it a project for a dedicated investor looking to restore and redevelop this unique property.
Repairs flagged
- Major Roof — Significant damage and potential structural issues.
- Major Exterior walls — Peeling paint and exposed brick indicate extensive damage.
- Major Flooring — Worn and damaged, likely in need of replacement.
- Major Interior walls/paint — Significant wear and discoloration, with peeling paint.
- Major HVAC/mechanicals — Given the age of the building, they likely need replacement.
- Major Landscaping — Overgrown and unkempt, detracting from the curb appeal of the property.
- Major Windows — Old and may need replacement or repair to improve energy efficiency and appearance.
- Major Foundation/structure — No visible signs of foundation issues, but the overall condition of the building suggests it may need structural repairs.
Value-add opportunities
- Both Roof replacement — Improves the overall condition and safety of the property.
- Both Exterior wall repair and painting — Enhances the curb appeal and structural integrity.
- Both Flooring replacement — Improves the living space and adds value to the property.
- Both Interior wall repair and painting — Enhances the living space and adds value to the property.
- Both HVAC replacement — Improves energy efficiency and adds value to the property.
- Both Landscaping and curb appeal improvements — Enhances the overall appearance and adds value to the property.
- Both Window replacement — Improves energy efficiency and adds value to the property.
- Both Foundation and structural repairs — Ensures the property's safety and adds value to the property.
Renovation cost estimate screening
| Repair item | Severity | Est. cost |
|---|---|---|
| Roof · Significant damage and potential structural issues. | Major | $15,000–50,000 |
| Exterior walls · Peeling paint and exposed brick indicate extensive damage. | Major | $15,000–50,000 |
| Flooring · Worn and damaged, likely in need of replacement. | Major | $15,000–50,000 |
| Interior walls/paint · Significant wear and discoloration, with peeling paint. | Major | $15,000–50,000 |
| HVAC/mechanicals · Given the age of the building, they likely need replacement. | Major | $15,000–50,000 |
| Landscaping · Overgrown and unkempt, detracting from the curb appeal of the property. | Major | $15,000–50,000 |
| Windows · Old and may need replacement or repair to improve energy efficiency and appearance. | Major | $15,000–50,000 |
| Foundation/structure · No visible signs of foundation issues, but the overall condition of the building suggests it may need structural repairs. | Major | $15,000–50,000 |
| Total estimated repair cost · 8 items | $120,000–400,000 |
Value-add ROI direction
- Both Roof replacement — Improves the overall condition and safety of the property. ↑
- Both Exterior wall repair and painting — Enhances the curb appeal and structural integrity. ↑
- Both Flooring replacement — Improves the living space and adds value to the property. ↑
- Both Interior wall repair and painting — Enhances the living space and adds value to the property. ↑
- Both HVAC replacement — Improves energy efficiency and adds value to the property. ↑
- Both Landscaping and curb appeal improvements — Enhances the overall appearance and adds value to the property. ↑
- Both Window replacement — Improves energy efficiency and adds value to the property. ↑
- Both Foundation and structural repairs — Ensures the property's safety and adds value to the property. ↑
ⓘ Cost ranges are severity-bucket heuristics (US national rule-of-thumb). Get contractor quotes + a written scope before underwriting a rehab budget.
Schools (NCES district)
- District
- Groveton ISD
- NCES district ID
- 4821900
- Math proficiency
- 45% ▼ -2.00%
- Reading proficiency
- 46% ▲ 1.00%
- Median HH income
- $36,375
- Composite
- 37.76/100
- National rank
- #4348
- State rank
- #281 of 826 in TX
Livability — Groveton
- Score
- 61/100
- State rank
- #995
- US rank
- #17710
Category grades
Schools grade is shown separately in the Schools card above.
Census & demographics
- Census place
- Groveton, TX
- Population (ZIP)
- 2,287
Population outlook (Trinity County) Hauer SSP2
- Today (2025)
- 13,746 people
- By 2030
- 13,333 · -3.0%
- By 2040
- 12,542 · -8.8%
- By 2050
- 11,942 · -13.1%
- By 2075
- 10,871 · -20.9%
- By 2100
- 9,784 · -28.8%
Race, ethnicity, and origin ACS 2023
- Neighborhood character
- Predominantly White (87%)
- Race & ethnicity
- White 87% Hispanic / Latino 6% Black 5% Two or more races 3%
- Hispanic origin (detail)
- Mexican 5%
- Common ancestry
- Portuguese 5% Lithuanian 2% Italian 2%
- Foreign-born
- 2% · Canada, Guatemala
- Languages at home
- 92% English-only · Spanish 8%
Political lean MEDSL · Trinity
- 2024 margin
- Solid R (+67.0) · D 16.2% · R 83.2%
- 2008→2024 swing
- -31.3pp toward R · 2008: -35.7pp · 2024: -67.0pp
- All cycles
- 2024: R+67.0 2020: R+61.3 2016: R+59.9 2012: R+46.9 2008: R+35.7
Not yet ingested
- Civics
- —
Market trends
- HPI YoY
- ▲ 4.41%
- Current HPI
- 175.9686
- Rent YoY
- —
- Metro
- —
- State GDP YoY
- ▲ 3.95%
- F500 in state
- 110
Industry mix (Fortune 500 HQ in TX)
| Industry | F500 HQs | Revenue |
|---|---|---|
| Energy | 16 | $1,198B |
|
||
| Technology | 5 | $198B |
|
||
| Engineering / Construction | 4 | $72B |
|
||
| Energy Services | 3 | $60B |
|
||
| Utilities | 3 | $41B |
|
||
| Healthcare | 2 | $330B |
|
||
Price history
2 events — show timeline
- 2026-03-26 Pending — HARMLS
- 2026-03-07 Listed $99,900 HARMLS
Cash-flow waterfall
monthlySold comps — $/sqft
last 12 mo · ≤1 miLoading sold comps…