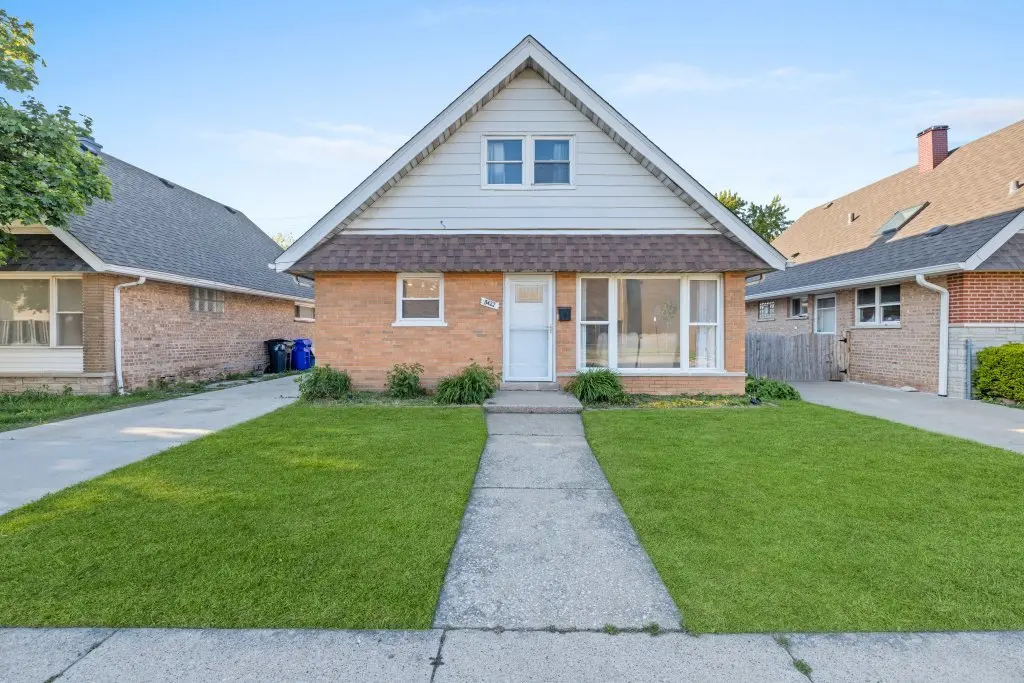
8422 W 45th St · Lyons, IL
Flood risk 1/10 · Minimal
- FEMA flood zone
- X (unshaded)
- Chance of flooding over 30 yrs
- 0.0%
- Est. flood insurance / yr
- $507 – $1,088
Fire risk 1/10 · Minimal
- Est. fire insurance / yr
- $804 – $1,492
Heat risk 3/10 · Minor
- Hot days now (above 101°F)
- 7 days/yr
- Hot days in 30 yrs
- 15 days/yr
Wind risk 2/10 · Minimal
- Chance of severe wind over 30 yrs
- 1.0%
Air-quality risk 4/10 · Minor
- Unhealthy air days now
- 3 days/yr
- Unhealthy air days in 30 yrs
- 5 days/yr
Risk factors via First Street. Map © Google.
Why this score? — see what drove the C- grade
The composite is a weighted blend of 9 inputs, each scored 0–100. Each bar is that input's sub-score; the figure is the points it added to the 100-point composite (weight × sub-score).
- Cash flow +22.7/30.0
- ARV discount +7.4/15.0
- DSCR +7.3/10.0
- 1% rule +5.9/10.0
- Livability +4.0/5.0
- Rent growth +2.5/5.0
- Condition / age +2.5/5.0
- Schools +1.1/10.0
- Appreciation +0.0/10.0
$325,000
🖨 Deal sheet (PDF) 📄 Offer letter ✓ Due diligence
Listing remarks
This home has your name written all over it! If you're looking for spacious rooms and plenty of living space, your search ends here. This charming home features four bedrooms, with two conveniently located on the main level and two additional bedrooms upstairs. The second floor boasts beautiful hardwood flooring that was installed just two years ago, adding both style and value to the home. Speaking of value, you'll also appreciate the remodeled kitchen and updated bathroom, offering modern touches throughout. Be sure to take a look at the photos-but even better, schedule a visit and experience this lovely home in person. Conveniently located near Interstate 55, getting here is quick and ea
Key facts
- Hardwood floor
- Remodeled bathroom
- Remodeled kitchen
Tags
Property features AI
Finance
- Other: Lot dimensions approximately 45 x 105 (less than 0.25 acre)
- HOA & community: No master association fee required
Exterior
- Parking: Detached garage (2 garage spaces; 2 parking spaces total)
- Utilities: Public water; Public sewer
- Home design: Detached single-family home; 1.5-story design; Fee simple ownership; Estimated age: 61–70 years; Brick construction; Built before 1978
- Construction: Brick exterior
- Exterior features: Patio
Interior
- Kitchen: Kitchen on main level (17 x 10); Vinyl flooring in kitchen
- Bedrooms: 4 bedrooms (Master on main; one bedroom on main; two bedrooms on second floor); Bedroom sizes: 12 x 12, 12 x 12, 11 x 9, 12 x 11
- Flooring: Carpet in most bedrooms and living room; Vinyl in kitchen
- Bathrooms: 1 full bathroom; 1 half bathroom
- Heating & cooling: Natural gas forced air heating; Central air conditioning
- Interior features: Six total rooms; Crawl space basement
- Laundry & utility: Dedicated laundry room
Neighborhood map
What this means for you Summary
Snapshot
- This is a 4-bed/1.5-bath single-family listed at $325k.
Deal economics
- At list price, monthly cash flow is $561 ($7k/yr) — positive.
- The deal already cash-flows at list — no discount required.
- Meets the 1% rule at list price ($4k rent vs $325k).
- Recommended offer: $315k (3.0% below list) — sets the bar for market timing.
- Cap rate 8.4% vs local median 4.2% in Lyons — top-decile yield for the area; either an underpriced asset or a hidden risk that comps aren't pricing in. Stress-test before assuming the spread holds.
Location & tenants
- Location reads 79/100 on livability (#126 in IL, #2,222 nationally) — a middle-class / working-renter tenant base. Strengths: commute A+, cost of living A+, housing A+; Watch: schools F.
- J S Morton Hsd 201 (suburban): math 9% / reading 14% proficiency, ranked #557 of 620 in IL (top 90%) — low school quality limits family demand, transient renter base, plan for 1-2y turnover.
- Market conditions: 38 active listings in the ZIP; 2 comparable units currently listed for rent nearby; 6,272 units permitted in Cook County in 2024 (4,658 in 5+ unit buildings).
Forward outlook
- Local home prices are declining (-3.0%/yr); year-one equity from $2k of loan paydown is wiped out by about $10k of value loss. Plan a longer hold.
Negotiation context
- It's been on market 31 days — a 3% lower offer ($315k) is reasonable based on typical stale-listing flexibility.
- 3 sale attempts since 19y ago; this cycle's ask has dropped $20k (6%) from the opening price — seller is motivated, your offer sets the floor, not the list.
- Current owner paid $197k; list at $325k implies a 65% gain — meaningful room to come down on a strong offer.
Risks & watch-outs
- Watch-outs: built in 1957 — expect roof / HVAC / electrical / plumbing capex.
Questions for the listing agent
- It's been on market 31 days. Have you received any prior offers? Is the seller open to a 3% concession, seller financing, or rate buy-down credit?
- Built in 1957 — when were the roof, HVAC, electrical panel, plumbing, and water heater last replaced?
- Is there a deadline driving the sale (1031 exchange, divorce, estate, relocation)? That informs how much negotiation room exists.
- Schools are F-rated, which usually means shorter tenancies and higher turnover. Who's the typical renter profile here, and what's been the actual vacancy rate?
- What's the average days-on-market for RENTAL listings here right now (not sales)? A rising rental-DOM trend means longer vacancies and softer asking-rent achievability than the comps imply.
- What's the recent tenant-quality profile in this submarket — average credit score on applications, eviction rate, late-payment / NSF rate, and stable-employment percentage? A property-management company in the area should have these aggregated.
- How much new for-sale + rental construction is in the pipeline within 1–3 miles? Heavy new supply typically softens prices + rents 12–24 months out; constrained supply supports both.
Investment metrics
- 1% rule
- 1.09% ✓
- Cap rate
- 8.37%
- Cash-on-cash
- 7.40%
- DSCR
- 1.33
- GRM
- 7.6
CMA / ARV
- ARV (on-the-fly)
- $324,522
- Comps found
- 12
Show comp detail 12 sales within ~0.75 mi
| Address | Dist | Beds/Ba | Sqft | Sold | Price | $/sf | Match |
|---|---|---|---|---|---|---|---|
| 8330 45th St | 0.13mi | 3/2.0 (-1) | 1,361 (+2%) | 5mo | $300,000 | $220 | 80 |
| 4010 Fern Ave | 0.58mi | 4/2.0 | 1,352 (+1%) | 7mo | $325,500 | $241 | 64 |
| 4617 Joliet Ave | 0.62mi | 4/2.0 | 1,302 (-3%) | 2mo | $315,000 | $242 | 62 |
| 8718 Plainfield Rd | 0.39mi | 3/2.0 (-1) | 1,421 (+6%) | 6mo | $175,000 | $123 | 60 |
| 8611 44th St | 0.22mi | 4/2.0 | 1,197 (-11%) | 12mo | $370,000 | $309 | 60 |
| 8745 43rd St | 0.47mi | 4/2.0 | 1,493 (+11%) | 3mo | $334,000 | $224 | 54 |
| 8214 45th St | 0.28mi | 3/3.0 (-1) | 1,520 (+13%) | 5mo | $362,500 | $238 | 49 |
| 4614 Prairie Ave | 0.67mi | 3/2.0 (-1) | 1,291 (-4%) | 10mo | $337,900 | $262 | 47 |
| 8129 45th Pl | 0.40mi | 3/2.0 (-1) | 1,485 (+11%) | 12mo | $380,000 | $256 | 47 |
| 4343 Amelia Ave | 0.73mi | 3/1.0 (-1) | 1,272 (-5%) | 6mo | $265,000 | $208 | 45 |
| 4233 Grove Ave | 0.55mi | 3/2.0 (-1) | 1,153 (-14%) | 12mo | $337,000 | $292 | 34 |
| 4041 Rose Ave | 0.55mi | 3/2.5 (-1) | 1,516 (+13%) | 12mo | $463,000 | $305 | 34 |
Match score weights: distance 35% · size 25% · config 20% · recency 20%. Top-matched comps best support the ARV.
Projected returns pro-forma
-3.0% appreciation · 3.0% rent growth · sell at horizon
- IRR
- -5.0%
- Equity multiple
- 0.81×
- Total profit
- $-16,854
- Equity at exit
- $48,459
- IRR
- 4.7%
- Equity multiple
- 1.35×
- Total profit
- $31,585
- Equity at exit
- $28,100
Cash invested: $91,000 (down + closing). Projections, not guarantees.
Landlord ↔ Tenant lean methodology
- Overall (STATE)
- 43 Moderately Tenant-Leaning
- State Illinois
- 43 Moderately Tenant-Leaning · D+7
- County
- — inherits STATE
- City
- — inherits STATE
ZIP-level market 60534
- Home prices YoY
- -26.6%
- Active inventory
- 38
- Price-to-rent
- 7.6×
Monthly cashflow live
- Estimated rent
- $3,554 medium interval (Pro) →
- Mortgage (P&I)
- −$1,704
- Tax from tax record
- −$407 /mo · $4,878/yr
- Insurance
- −$135
- HOA
- −$0
- Vacancy / Maint / Mgmt
- −$746
- Net cashflow
- $561
Break-even live
Sensitivity live
| Price | -10% $745 | -5% $653 | +0% $561 | +5% $469 | +10% $377 |
|---|---|---|---|---|---|
| Rent | -10% $281 | -5% $421 | +0% $561 | +5% $702 | +10% $842 |
| Rate | -1.0pp $725 | -0.5pp $644 | base $561 | +0.5pp $477 | +1.0pp $392 |
UW: 25.0% down · 7.5% · 30yr · 1.5% tax · 5.0% vac · 8.0% maint · 8.0% mgmt
Financing live
Cash to close
- Down payment
- $81,250
- Closing costs
- $9,750
- Reserves months
- —
- Total cash needed
- —
Loan-product check · same deal, 3 products live
Conventional
25% down · 7.5% · 30yr
- Down + closing
- —
- Monthly P&I
- —
- Monthly cashflow
- —
- DSCR
- —
- Eligible?
- —
Personal DTI + credit; lowest rate.
DSCR
20% down · 8.5% · 30yr
- Down + closing
- —
- Monthly P&I
- —
- Monthly cashflow
- —
- DSCR
- —
- Eligible?
- —
No personal income docs; deal must DSCR.
Hard money
10% down · 12.0% · 12mo
- Down + closing
- —
- Monthly P&I
- —
- Monthly cashflow
- —
- DSCR
- —
- Eligible?
- —
Short-term bridge; refi at stabilization.
Rent comps 2 comps
| Address | Beds | Baths | Sqft | Rent | $/sqft | DOM | Units | Dist |
|---|---|---|---|---|---|---|---|---|
| 4605 Prairie Ave Brookfield, IL | 3.0 | 2.0 | 1100 | $3,200 | $2.91 | 11d | 1 | 0.62mi |
| 4000 Forest Ave Unit 6 Brookfield, IL | 3.0 | 2.0 | 1150 | $4,000 | $3.48 | 11d | 1 | 0.82mi |
Listing history 22 events
-
2026-06-21pricedays on market $325,000 Active 31 DOM
-
2026-06-18days on market $334,900 Active 28 DOM
-
2026-06-17days on market $334,900 Active 27 DOM
-
2026-06-16days on market $334,900 Active 26 DOM
-
2026-06-15days on market $334,900 Active 25 DOM
-
2026-06-13days on market $334,900 Active 23 DOM
-
2026-06-09days on market $334,900 Active 19 DOM
-
2026-06-08days on market $334,900 Active 18 DOM
-
2026-06-07pricedays on market $334,900 Active 17 DOM
-
2026-06-04days on market $345,000 Active 14 DOM
-
2026-06-03days on market $345,000 Active 13 DOM
-
2026-06-02days on market $345,000 Active 12 DOM
-
2026-06-01days on market $345,000 Active 11 DOM
-
2026-05-31remarks 699-char remark
-
2026-05-31days on market $345,000 Active 10 DOM
-
2026-05-21$345,000 Active
-
2008-11-06historical
-
2008-10-09
-
2008-02-13historical
-
2007-07-13
-
2006-04-18soldstatus $197,000
-
2000-06-28soldstatus $105,000
ⓘ Source: listings_history table (triggers on properties + properties_extension) + one-shot
backfill from property_details.listing_events for pre-trigger history.
Tax reassessment forecast IL · Partial reset (capped growth)
- Current annual tax
- $4,878 · $407/mo
- Projected year-2 tax
- $6,128 · $511/mo
- Expected delta
- +$1,250/yr (+$104/mo · 25.6%)
ⓘ Screening estimate from a state-policy table — verify with the county assessor before closing.
Climate risk First Street
- Flood 1/10 Low FEMA zone X (unshaded) · 0% chance over 30 yrs
- Wildfire 1/10 Low
- Heat 3/10 Moderate 7 d/yr ≥101°F today · 15 d/yr by 30 yrs out
- Wind 2/10 Low 100% chance of damaging wind over 30 yrs
- Air quality 4/10 Moderate 3 unhealthy d/yr today · 5 by 30 yrs out
Nearby sold comps map
Loading sold comps map…
Walkable amenities ~0.75 mi
Loading nearby amenities…
Taxation est. · year 1
- Rental income
- $42,648
- − Mortgage interest
- −$18,205
- − Property taxes
- −$4,878
- − Insurance
- −$1,625
- − Repairs & maintenance
- −$3,412
- − Management
- −$3,412
- − Depreciation
- −$9,455
- Taxable income
- $1,662
- Est. tax owed @ 24.0%
- −$399
- After-tax cash flow
- $6,338/yr
For passive investors: Depreciation is non-cash, so a rental often shows a tax loss while cash-flowing — sheltering income. Rental losses are passive: they offset passive income freely, and up to $25,000/yr can offset ordinary (W-2) income if you actively participate and your MAGI is under $100k (phasing out to $0 by $150k); unused losses carry forward. On sale, claimed depreciation is recaptured at up to 25%, and gains may owe capital-gains tax (a 1031 exchange can defer both). Figures are a year-1 estimate at your 24.0% rate — not tax advice; consult a CPA.
Schools (NCES district)
- District
- J S Morton Hsd 201
- NCES district ID
- 1726880
- Math proficiency
- 9% ▲ 1.00%
- Reading proficiency
- 14% ▼ -1.00%
- Median HH income
- $48,698
- Composite
- 10.73/100
- National rank
- #9768
- State rank
- #557 of 620 in IL
Livability — Lyons
- Score
- 79/100
- State rank
- #126
- US rank
- #2222
Category grades
Schools grade is shown separately in the Schools card above.
Census & demographics
- Census place
- Lyons, IL
- City population
- 10,362
- Population (ZIP)
- 10,362
Population outlook (Cook County) Hauer SSP2
- Today (2025)
- 5,347,519 people
- By 2030
- 5,357,703 · +0.2%
- By 2040
- 5,324,924 · -0.4%
- By 2050
- 5,230,762 · -2.2%
- By 2075
- 4,785,735 · -10.5%
- By 2100
- 4,188,836 · -21.7%
Race, ethnicity, and origin ACS 2023
- Neighborhood character
- Diverse neighborhood (Simpson 0.55)
- Race & ethnicity
- Hispanic / Latino 49% White 46% Two or more races 8% Black 3% Asian 2%
- Hispanic origin (detail)
- Mexican 38% Puerto Rican 6%
- Common ancestry
- Romanian 17% Italian 1% Lithuanian 1%
- Foreign-born
- 24% · Canada, Vietnam, Jamaica
- Languages at home
- 54% English-only · Spanish 36% Russian/Polish/Slavic 6% Other Indo-European 3%
Political lean MEDSL · Cook
- 2024 margin
- Solid D (+42.0) · D 70.4% · R 28.4% · Other 1.2%
- 2008→2024 swing
- -11.4pp toward R · 2008: 53.4pp · 2024: 42.0pp
- All cycles
- 2024: D+42.0 2020: D+50.3 2016: D+53.0 2012: D+49.4 2008: D+53.4
Not yet ingested
- Civics
- —
Market trends
- HPI YoY
- ▼ -88.39%
- Current HPI
- 243.8425
- Rent YoY
- —
- Metro
- —
- State GDP YoY
- ▲ 1.59%
- F500 in state
- 60
Industry mix (Fortune 500 HQ in IL)
| Industry | F500 HQs | Revenue |
|---|---|---|
| Insurance | 4 | $201B |
|
||
| Consumer Goods | 4 | $87B |
|
||
| Industrial Machinery | 3 | $64B |
|
||
| Healthcare | 2 | $55B |
|
||
| Retail / Pharmacy | 1 | $148B |
|
||
| Agriculture / Food | 1 | $86B |
|
||
Price history
+228.6% since first listed7 events — show timeline
- 2026-05-21 Listed $345,000 MRED as Distributed by MLS Grid
- 2008-11-06 Listing Removed — MRED as Distributed by MLS Grid
- 2008-10-09 Listed — MRED as Distributed by MLS Grid
- 2008-02-13 Listing Removed — MRED as Distributed by MLS Grid
- 2007-07-13 Listed — MRED as Distributed by MLS Grid
- 2006-04-18 Sold (Public Records) $197,000 Public Records
- 2000-06-28 Sold (Public Records) $105,000 Public Records
Property tax history
+0.9%/yrLatest (2023): $4,878 · +35.2% YoY. Source: county tax records.
Cash-flow waterfall
monthlySold comps — $/sqft
last 12 mo · ≤1 miLoading sold comps…