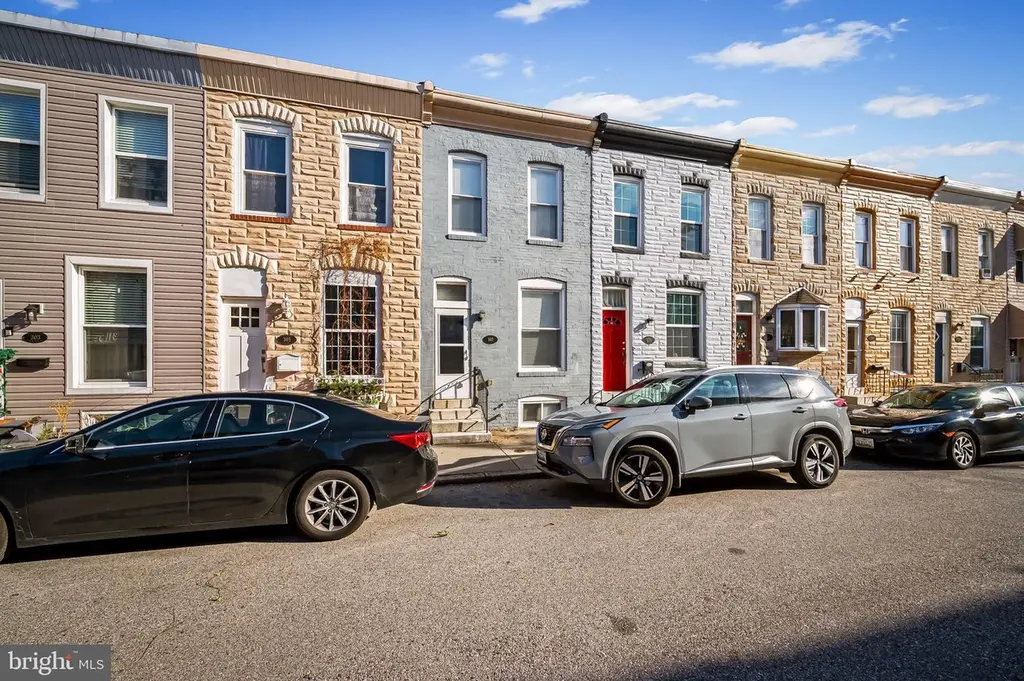
307 Fagley St · Baltimore, MD
Flood risk 1/10 · Minimal
- FEMA flood zone
- X (unshaded)
- Chance of flooding over 30 yrs
- 0.0%
- Est. flood insurance / yr
- $473 – $860
Fire risk 1/10 · Minimal
- Est. fire insurance / yr
- $755 – $1,403
Heat risk 8/10 · Major
- Hot days now (above 103°F)
- 7 days/yr
- Hot days in 30 yrs
- 15 days/yr
Wind risk 6/10 · Moderate
- Chance of severe wind over 30 yrs
- 27.0%
Air-quality risk 4/10 · Minor
- Unhealthy air days now
- 6 days/yr
- Unhealthy air days in 30 yrs
- 7 days/yr
Risk factors via First Street. Map © Google.
Why this score? — see what drove the D grade
The composite is a weighted blend of 9 inputs, each scored 0–100. Each bar is that input's sub-score; the figure is the points it added to the 100-point composite (weight × sub-score).
- Cash flow +21.7/30.0
- DSCR +6.9/10.0
- 1% rule +6.2/10.0
- Livability +3.8/5.0
- Rent growth +2.8/5.0
- Condition / age +2.5/5.0
- Schools +1.0/10.0
- ARV discount +0.0/15.0
- Appreciation +0.0/10.0
$174,000
🖨 Deal sheet (PDF) 📄 Offer letter ✓ Due diligence
Listing remarks
Welcome to 307 Fagley Street, a charming and classic brick townhome located in the heart of Highlandtown. Step inside to a bright and open living/dining area featuring gleaming wood-look flooring and recessed lighting, creating a warm and inviting space for everyday living and entertaining. Continue into the updated kitchen complete with tile flooring, stainless steel appliances, upgraded cabinetry, and modern countertops. The upper level offers two comfortable bedrooms, each with plush upgraded carpeting and ceiling fans, along with a full hall bath featuring a stylish walk-in tiled shower. The lower level is unfinished, providing excellent storage space or potential for future customizati
Key facts
- Brick townhome
- Private parking pad
- Updated kitchen
Tags
Property features AI
Exterior
- Parking: On-street parking
- Utilities: Public water; Public sewer; Electric cooling; Natural gas service
- Home design: Interior townhouse/rowhouse; Fee simple ownership; Brick construction
- Construction: Brick construction; Permanent foundation; Above-grade and below-grade structures
- Exterior features: Rear fencing; Below-grade area (unfinished basement)
Interior
- Kitchen: Stainless steel appliances; Dishwasher; Refrigerator; Gas range/oven; Built-in microwave
- Bedrooms: 2 bedrooms on the first upper level
- Flooring: Wood floors; Carpet
- Bathrooms: 1 full bathroom; 1 half bathroom
- Heating & cooling: Forced air heating; Natural gas heating and hot water; Central air conditioning (electric)
- Interior features: Walk-in shower; Ceiling fans; Combination dining and living area; Traditional floor plan; Recessed lighting; Upgraded countertops; Carpeted areas; Wood floors
- Laundry & utility: Unfinished basement (utility/storage space)
Neighborhood map
What this means for you Summary
Snapshot
- This is a 2-bed/1.5-bath townhouse listed at $174k.
Deal economics
- At list price, monthly cash flow is $268 ($3k/yr) — positive.
- The deal already cash-flows at list — no discount required.
- Meets the 1% rule at list price ($2k rent vs $174k).
- Recommended offer: $171k (1.5% below list) — sets the bar for market timing.
- Cap rate 8.1% vs local median 6.0% in Baltimore — top-decile yield for the area; either an underpriced asset or a hidden risk that comps aren't pricing in. Stress-test before assuming the spread holds.
Location & tenants
- Location reads 76/100 on livability (#90 in MD, #3,396 nationally) — a middle-class / working-renter tenant base. Strengths: amenities A+, commute A+, housing A+; Watch: crime F.
- Baltimore City Public Schools (urban): math 7% / reading 16% proficiency, ranked #24 of 24 in MD (top 100%) — low school quality limits family demand, transient renter base, plan for 1-2y turnover; 79% free/reduced lunch — lower-income household profile, screen leases tightly.
- Zoned schools: Highlandtown Elementary/Middle #237 (math 2% / reading 6%, grade F, #814 of 860 statewide, top 95%, 726 students, 59% FRL); Baltimore Polytechnic Institute (math 71% / reading 84%, grade A-, #22 of 222 statewide, top 10%, 1,555 students, 43% FRL) — zoned schools average 51% FRL vs 79% district-wide (28 pts lower); this property's tenant base skews higher-income than the district average.
- Zoned-school proficiency averages 41% at this address vs 12% district-wide (+29 pts) — the actual schools serving this property are materially stronger than the Baltimore City Public Schools average implies; a family-tenant draw the district grade alone would hide.
- Market conditions: Rents rising (+1.3%/yr); 393 active listings in the ZIP; 40 comparable units currently listed for rent nearby; rentals at typical pace (median 26d on market — plan ~3-4 weeks tenant-placement turnaround); solid renter incomes; 1,273 units permitted in Baltimore city in 2024 (1,104 in 5+ unit buildings).
Forward outlook
- Local home prices are declining (-3.0%/yr); year-one equity from $1k of loan paydown is wiped out by about $5k of value loss. Plan a longer hold.
- Baltimore County population projected to shrink 4% by 2050 — rents likely to lag national; underwrite the cash flow, not the appreciation.
Negotiation context
- It's been on market 23 days — a 2% lower offer ($171k) is reasonable based on typical stale-listing flexibility.
- 8 sale attempts since 9y ago with the ask held roughly flat each time — persistent listings suggest the price (not the market) is what's stuck; bring a comps-based counter.
- Current owner paid $113k; list at $174k implies a 54% gain — meaningful room to come down on a strong offer.
Risks & watch-outs
- Watch-outs: built in 1920 — expect roof / HVAC / electrical / plumbing capex.
- Climate carrying-cost: major wind risk, 27% chance of damaging wind over 30y; extreme-heat days projected 7→15/yr by 2055 (HVAC capex compounding) — expect insurance premiums to compound above CPI over the hold.
Questions for the listing agent
- Built in 1920 — when were the roof, HVAC, electrical panel, plumbing, and water heater last replaced?
- Is there a deadline driving the sale (1031 exchange, divorce, estate, relocation)? That informs how much negotiation room exists.
- Schools are D-rated, which usually means shorter tenancies and higher turnover. Who's the typical renter profile here, and what's been the actual vacancy rate?
- Crime grade is F in this area — have there been break-ins, vandalism, or insurance claims at this property in the last 3 years? What carrier currently insures it and at what premium?
- The area grade is low — what's the realistic commute time and amenity access for the typical tenant pool here? Any planned neighborhood developments (good or bad) we should know about?
- What's the average days-on-market for RENTAL listings here right now (not sales)? A rising rental-DOM trend means longer vacancies and softer asking-rent achievability than the comps imply.
- What's the recent tenant-quality profile in this submarket — average credit score on applications, eviction rate, late-payment / NSF rate, and stable-employment percentage? A property-management company in the area should have these aggregated.
- How much new for-sale + rental construction is in the pipeline within 1–3 miles? Heavy new supply typically softens prices + rents 12–24 months out; constrained supply supports both.
Investment metrics
- 1% rule
- 1.12% ✓
- Cap rate
- 8.14%
- Cash-on-cash
- 6.59%
- DSCR
- 1.29
- GRM
- 7.4
CMA / ARV
- ARV (median comp)
- $142,685
- List price
- $174,000
- Delta
- 21.95%
- Verdict
- OVERPRICED
- Comps
- 20 within 1.0 mi
Show comp detail 12 sales within ~0.75 mi
| Address | Dist | Beds/Ba | Sqft | Sold | Price | $/sf | Match |
|---|---|---|---|---|---|---|---|
| 321 S Fagley St | 0.02mi | 2/1.0 | 780 (0%) | 12mo | $157,000 | $201 | 87 |
| 107 S Dean St | 0.18mi | 2/1.0 | 720 (-8%) | 0mo | $104,000 | $144 | 76 |
| 124 N Janney St | 0.45mi | 2/1.0 | 792 (+2%) | 2mo | $63,800 | $81 | 72 |
| 228 S Haven St | 0.13mi | 2/2.5 | 720 (-8%) | 7mo | $145,000 | $201 | 71 |
| 223 Grundy St | 0.11mi | 2/1.0 | 864 (+11%) | 5mo | $150,000 | $174 | 71 |
| 1026 S Highland Ave | 0.58mi | 2/1.5 | 757 (-3%) | 8mo | $305,000 | $403 | 61 |
| 3516 Mount Pleasant Ave | 0.24mi | 2/1.0 | 884 (+13%) | 7mo | $117,000 | $132 | 58 |
| 3904 Mount Pleasant Ave | 0.18mi | 1/1.0 (-1) | 896 (+15%) | 8mo | $40,000 | $45 | 54 |
| 3405 Mount Pleasant Ave | 0.27mi | 3/2.5 (+1) | 888 (+14%) | 8mo | $162,500 | $183 | 48 |
| 3022 Hudson St | 0.64mi | 2/1.0 | 858 (+10%) | 7mo | $278,250 | $324 | 46 |
| 2927 Pulaski Hwy | 0.73mi | 2/1.0 | 858 (+10%) | 8mo | $108,950 | $127 | 40 |
| 908 S Potomac St | 0.70mi | 1/1.5 (-1) | 890 (+14%) | 2mo | $255,500 | $287 | 37 |
Match score weights: distance 35% · size 25% · config 20% · recency 20%. Top-matched comps best support the ARV.
Projected returns pro-forma
-3.0% appreciation · 1.31% rent growth · sell at horizon
- IRR
- -8.1%
- Equity multiple
- 0.71×
- Total profit
- $-14,331
- Equity at exit
- $25,944
- IRR
- -1.0%
- Equity multiple
- 0.94×
- Total profit
- $-3,157
- Equity at exit
- $15,044
Cash invested: $48,720 (down + closing). Projections, not guarantees.
Landlord ↔ Tenant lean methodology
- Overall (CITY)
- 12 Strongly Tenant-Friendly
- State Maryland
- 27 Tenant-Leaning · D+14
- County
- — inherits STATE
- City Baltimore
- 12 Strongly Tenant-Friendly · D+58
ZIP-level market 21224
- Rents YoY
- 1.3%
- Active inventory
- 393
- Price-to-rent
- 7.4×
Monthly cashflow live
- Estimated rent
- $1,949 high interval (Pro) →
- Mortgage (P&I)
- −$912
- Tax from tax record
- −$287 /mo · $3,446/yr
- Insurance
- −$72
- HOA
- −$0
- Vacancy / Maint / Mgmt
- −$409
- Net cashflow
- $268
Break-even live
Sensitivity live
| Price | -10% $366 | -5% $317 | +0% $268 | +5% $218 | +10% $169 |
|---|---|---|---|---|---|
| Rent | -10% $114 | -5% $191 | +0% $268 | +5% $345 | +10% $422 |
| Rate | -1.0pp $355 | -0.5pp $312 | base $268 | +0.5pp $223 | +1.0pp $177 |
UW: 25.0% down · 7.5% · 30yr · 1.5% tax · 5.0% vac · 8.0% maint · 8.0% mgmt
Financing live
Cash to close
- Down payment
- $43,500
- Closing costs
- $5,220
- Reserves months
- —
- Total cash needed
- —
Loan-product check · same deal, 3 products live
Conventional
25% down · 7.5% · 30yr
- Down + closing
- —
- Monthly P&I
- —
- Monthly cashflow
- —
- DSCR
- —
- Eligible?
- —
Personal DTI + credit; lowest rate.
DSCR
20% down · 8.5% · 30yr
- Down + closing
- —
- Monthly P&I
- —
- Monthly cashflow
- —
- DSCR
- —
- Eligible?
- —
No personal income docs; deal must DSCR.
Hard money
10% down · 12.0% · 12mo
- Down + closing
- —
- Monthly P&I
- —
- Monthly cashflow
- —
- DSCR
- —
- Eligible?
- —
Short-term bridge; refi at stabilization.
Rent comps 40 comps
| Address | Beds | Baths | Sqft | Rent | $/sqft | DOM | Units | Dist |
|---|---|---|---|---|---|---|---|---|
| 321 Fagley St Baltimore, MD | 2.0 | 1.0 | 800 | $1,650 | $2.06 | 22d | 1 | 0.05mi |
| 223 Grundy St Baltimore, MD | 2.0 | 1.0 | 864 | $1,450 | $1.68 | 25d | 1 | 0.07mi |
| 3905 Bank St Baltimore, MD | 4.0 | 1.0–3.0 | 909 | $2,365 | $2.60 | 0d | 18 | 0.12mi |
| 201 S Conkling St Baltimore, MD | 1.0 | 1.0 | 740 | $1,500 | $2.03 | 4d | 2 | 0.18mi |
| 4015 Eastern Ave Unit 2L Baltimore, MD | 3.0 | 2.0 | 1100 | $1,800 | $1.64 | 45d | 1 | 0.18mi |
| 400 S Conkling St Unit 3 Baltimore, MD | 1.0 | 1.0 | 700 | $1,700 | $2.43 | 45d | 1 | 0.22mi |
| 3801 Fleet St Unit 209 Baltimore, MD | 1.0 | 1.5 | 814 | $1,899 | $2.33 | 45d | 1 | 0.25mi |
| 400 S Highland Ave Unit 402 Baltimore, MD | 2.0 | 1.0 | 900 | $1,700 | $1.89 | 45d | 1 | 0.31mi |
| 3413 Leverton Ave Baltimore, MD | 2.0 | 1.0 | 832 | $1,000 | $1.20 | 25d | 1 | 0.31mi |
| 3232 Eastern Ave Baltimore, MD | 1.0 | 1.5 | 874 | $2,030 | $2.32 | 0d | 1 | 0.37mi |
| 3235 Eastern Ave Unit 2FL Baltimore, MD | 1.0 | 1.0 | 552 | $1,650 | $2.99 | 0d | 1 | 0.39mi |
| 3344 E Baltimore St Unit 2 Baltimore, MD | 1.0 | 1.0 | 545 | $1,250 | $2.29 | 45d | 1 | 0.39mi |
| 3610 Dillon St Baltimore, MD | 1.0–2.0 | 1.0–2.0 | 828 | $2,820 | $3.41 | 45d | 1 | 0.50mi |
| 3200 Fait Ave Baltimore, MD | 1.0 | 1.0 | 800 | $1,700 | $2.12 | 3d | 1 | 0.54mi |
| 3205 Esther Pl Baltimore, MD | 2.0 | 2.0 | 960 | $1,850 | $1.93 | 25d | 1 | 0.55mi |
| 29 N Ellwood Ave Baltimore, MD | 3.0 | 1.5 | 1100 | $2,395 | $2.18 | 25d | 1 | 0.57mi |
| 643 S Potomac St Baltimore, MD | 2.0 | 1.0 | 785 | $1,650 | $2.10 | 45d | 1 | 0.63mi |
| 3850 Boston St Baltimore, MD | 2.0 | 1.0–2.0 | 854 | $3,378 | $3.96 | 0d | 23 | 0.63mi |
| 1211 S Eaton St Unit 8041 Baltimore, MD | 1.0 | 1.0 | 768 | $2,300 | $2.99 | 25d | 1 | 0.63mi |
| 1211 S Eaton St Unit 8038 Baltimore, MD | 1.0 | 1.0 | 1037 | $2,475 | $2.39 | 18d | 1 | 0.63mi |
| 1211 S Eaton St Unit 5012 Baltimore, MD | 1.0 | 1.0 | 774 | $2,325 | $3.00 | 25d | 1 | 0.63mi |
| 1211 S Eaton St Unit 6010 Baltimore, MD | 1.0 | 1.0 | 774 | $2,325 | $3.00 | 23d | 1 | 0.63mi |
| 1211 S Eaton St Unit 6046 Baltimore, MD | 1.0 | 1.0 | 774 | $2,325 | $3.00 | 18d | 1 | 0.63mi |
| 1211 S Eaton St Unit 8024 Baltimore, MD | 1.0 | 1.0 | 627 | $2,014 | $3.21 | 45d | 1 | 0.63mi |
| 1211 S Eaton St Unit 5020 Baltimore, MD | 1.0 | 1.0 | 832 | $2,534 | $3.05 | 45d | 1 | 0.63mi |
| 1211 S Eaton St Unit 7020 Baltimore, MD | 1.0 | 1.0 | 832 | $2,400 | $2.88 | 25d | 1 | 0.63mi |
| 1211 S Eaton St Unit 6012 Baltimore, MD | 1.0 | 1.0 | 774 | $2,554 | $3.30 | 23d | 1 | 0.63mi |
| 203 N Ellwood Ave Unit Main Baltimore, MD | 2.0 | 2.0 | 880 | $2,200 | $2.50 | 25d | 1 | 0.64mi |
| 3518 Elliott St Baltimore, MD | 3.0 | 2.5 | 1036 | $2,800 | $2.70 | 19d | 1 | 0.66mi |
| 3700 Toone St Baltimore, MD | 1.0–2.0 | 1.0–2.0 | 1093 | $3,218 | $2.94 | 0d | 30 | 0.70mi |
| 825 S Linwood Ave Baltimore, MD | 1.0 | 1.0 | 1000 | $2,150 | $2.15 | 25d | 1 | 0.75mi |
| 3018 O Donnell St Unit 2R Baltimore, MD | 1.0 | 1.0 | 750 | $1,700 | $2.27 | 45d | 1 | 0.77mi |
| 520 N Decker Ave Baltimore, MD | 2.0 | 1.0 | 1000 | $1,650 | $1.65 | 45d | 1 | 0.82mi |
| 560 Bayview Blvd Baltimore, MD | 1.0–3.0 | 1.0–3.0 | 1108 | $2,496 | $2.25 | 0d | 29 | 0.85mi |
| 127 N Glover St Baltimore, MD | 2.0 | 1.5 | 1110 | $2,100 | $1.89 | 4d | 1 | 0.91mi |
| 415 N Belnord Ave Baltimore, MD | 2.0 | 1.0 | 1008 | $1,300 | $1.29 | 25d | 1 | 0.93mi |
| 2608 E Fayette St Unit 1 Baltimore, MD | 2.0 | 1.0 | 900 | $1,700 | $1.89 | 16d | 1 | 0.95mi |
| 531 N Belnord Ave Baltimore, MD | 2.0 | 1.5 | 1100 | $1,700 | $1.55 | 25d | 1 | 0.98mi |
| 104 N Rose St Baltimore, MD | 3.0 | 2.0 | 936 | $2,500 | $2.67 | 45d | 1 | 0.98mi |
| 415 N Glover St Baltimore, MD | 2.0 | 2.5 | 1092 | $1,600 | $1.47 | 25d | 1 | 0.99mi |
Listing history 36 events
-
2026-06-21days on market $174,000 Active 23 DOM
-
2026-06-18days on market $174,000 Active 20 DOM
-
2026-06-17days on market $174,000 Active 19 DOM
-
2026-06-16days on market $174,000 Active 18 DOM
-
2026-06-15days on market $174,000 Active 17 DOM
-
2026-06-13days on market $174,000 Active 15 DOM
-
2026-06-09days on market $174,000 Active 11 DOM
-
2026-06-08days on market $174,000 Active 10 DOM
-
2026-06-07days on market $174,000 Active 9 DOM
-
2026-06-04days on market $174,000 Active 6 DOM
-
2026-06-03days on market $174,000 Active 5 DOM
-
2026-06-02days on market $174,000 Active 4 DOM
-
2026-06-01days on market $174,000 Active 3 DOM
-
2026-05-31days on market $174,000 Active 2 DOM
-
2026-05-18historical
-
2026-04-22price $174,000
-
2026-02-27status Active
-
2026-02-21status Pending
-
2026-02-20historical
-
2026-01-14$179,000 Active
-
2019-03-03historical
-
2019-02-16price $147,400
-
2019-01-16$149,900 Active
-
2018-05-09soldstatus $112,875
-
2018-04-25soldstatus $112,875 Closed
-
2018-04-25soldstatus $112,875 Sold
-
2018-04-11status Pending
-
2018-04-11status Contract
-
2018-03-17$30,000 Active
-
2018-03-17$30,000 Active
-
2018-03-06historical
-
2018-03-06historical Withdrawn
-
2017-11-13price
-
2017-11-01Active
-
2017-11-01$124,900 Active
-
1980-08-20soldstatus $20,000
ⓘ Source: listings_history table (triggers on properties + properties_extension) + one-shot
backfill from property_details.listing_events for pre-trigger history.
Tax reassessment forecast MD · Partial reset (capped growth)
- Current annual tax
- $3,446 · $287/mo
- Projected year-2 tax
- $3,446 · $287/mo
- Expected delta
- $0/yr ($0/mo · 0.0%)
ⓘ Screening estimate from a state-policy table — verify with the county assessor before closing.
Climate risk First Street
- Flood 1/10 Low FEMA zone X (unshaded) · 0% chance over 30 yrs
- Wildfire 1/10 Low
- Heat 8/10 Severe 7 d/yr ≥103°F today · 15 d/yr by 30 yrs out
- Wind 6/10 Major 27% chance of damaging wind over 30 yrs
- Air quality 4/10 Moderate 6 unhealthy d/yr today · 7 by 30 yrs out
Nearby sold comps map
Loading sold comps map…
Walkable amenities ~0.75 mi
Loading nearby amenities…
Taxation est. · year 1
- Rental income
- $23,390
- − Mortgage interest
- −$9,747
- − Property taxes
- −$3,446
- − Insurance
- −$870
- − Repairs & maintenance
- −$1,871
- − Management
- −$1,871
- − Depreciation
- −$5,062
- Taxable income
- $523
- Est. tax owed @ 24.0%
- −$126
- After-tax cash flow
- $3,087/yr
For passive investors: Depreciation is non-cash, so a rental often shows a tax loss while cash-flowing — sheltering income. Rental losses are passive: they offset passive income freely, and up to $25,000/yr can offset ordinary (W-2) income if you actively participate and your MAGI is under $100k (phasing out to $0 by $150k); unused losses carry forward. On sale, claimed depreciation is recaptured at up to 25%, and gains may owe capital-gains tax (a 1031 exchange can defer both). Figures are a year-1 estimate at your 24.0% rate — not tax advice; consult a CPA.
Schools (NCES district)
- District
- Baltimore City Public Schools
- NCES district ID
- 2400090
- Math proficiency
- 7% ▼ -9.00%
- Reading proficiency
- 16% ▼ -5.00%
- Median HH income
- $42,108
- Composite
- 10.08/100
- National rank
- #9805
- State rank
- #24 of 24 in MD
Livability — Baltimore
- Score
- 76/100
- State rank
- #90
- US rank
- #3396
Category grades
Schools grade is shown separately in the Schools card above.
Census & demographics
- Census place
- Baltimore, MD
- County
- Baltimore City · 558,601 people
- City population
- 588,727
- Metro
- Baltimore-Columbia-Towson, MD
- Population (ZIP)
- 47,465
- Household income
- $89,017
- Rent vs Own
- Severe rent burden
- 1786.0
Population outlook (Baltimore County) Hauer SSP2
- Today (2025)
- 624,249 people
- By 2030
- 621,541 · -0.4%
- By 2040
- 609,756 · -2.3%
- By 2050
- 597,249 · -4.3%
- By 2075
- 552,236 · -11.5%
- By 2100
- 513,934 · -17.7%
Race, ethnicity, and origin ACS 2023
- Neighborhood character
- Diverse neighborhood (Simpson 0.62)
- Race & ethnicity
- White 55% Hispanic / Latino 21% Black 16% Two or more races 7% Asian 4%
- Hispanic origin (detail)
- Mexican 4% Puerto Rican 2% Dominican 1%
- Common ancestry
- Romanian 5% Lithuanian 2% Italian 1%
- Foreign-born
- 17% · Canada, China, Vietnam
- Languages at home
- 76% English-only · Spanish 18% Other Indo-European 2% Russian/Polish/Slavic 1%
Political lean MEDSL · Baltimore
- 2024 margin
- Solid D (+73.0) · D 85.2% · R 12.2% · Other 2.6%
- 2008→2024 swing
- -2.5pp toward R · 2008: 75.5pp · 2024: 73.0pp
- All cycles
- 2024: D+73.0 2020: D+76.6 2016: D+74.6 2012: D+76.4 2008: D+75.5
Not yet ingested
- Civics
- —
Market trends
- HPI YoY
- ▼ -332.23%
- Current HPI
- 241.284
- Rent YoY
- ▲ 1.31%
- Metro
- Baltimore-Columbia-Towson, MD
- State GDP YoY
- ▲ 2.97%
- F500 in state
- 12
Industry mix (Fortune 500 HQ in MD)
| Industry | F500 HQs | Revenue |
|---|---|---|
| Aerospace / Defense | 1 | $71B |
|
||
| Utilities | 1 | $25B |
|
||
| Hotels | 1 | $24B |
|
||
| Consumer Goods | 1 | $7B |
|
||
| Real Estate | 1 | $6B |
|
||
| Chemicals | 1 | $2B |
|
||
Price history
+770.0% since first listed23 events — show timeline
- 2026-05-29 Listed $174,000 BRIGHT MLS
- 2026-05-18 Listing Removed — BRIGHT MLS
- 2026-04-22 Price Changed $174,000 BRIGHT MLS
- 2026-02-27 Relisted — BRIGHT MLS
- 2026-02-21 Pending — BRIGHT MLS
- 2026-02-20 Listing Removed — BRIGHT MLS
- 2026-01-14 Listed $179,000 BRIGHT MLS
- 2019-03-03 Listing Removed — BRIGHT MLS
- 2019-02-16 Price Changed $147,400 BRIGHT MLS
- 2019-01-16 Listed $149,900 BRIGHT MLS
- 2018-05-09 Sold (Public Records) $112,875 Public Records
- 2018-04-25 Sold (MLS) $112,875 MRIS
- 2018-04-25 Sold (MLS) $112,875 BRIGHT MLS
- 2018-04-11 Pending — BRIGHT MLS
- 2018-04-11 Pending — MRIS
- 2018-03-17 Listed $30,000 MRIS
- 2018-03-17 Listed $30,000 BRIGHT MLS
- 2018-03-06 Listing Removed — BRIGHT MLS
- 2018-03-06 Delisted — MRIS
- 2017-11-13 Price Changed — MRIS
- 2017-11-01 Listed — MRIS
- 2017-11-01 Listed $124,900 BRIGHT MLS
- 1980-08-20 Sold (Public Records) $20,000 Public Records
Property tax history
+2.0%/yrLatest (2025): $3,446 · +0.8% YoY. Source: county tax records.
Cash-flow waterfall
monthlySold comps — $/sqft
last 12 mo · ≤1 miLoading sold comps…