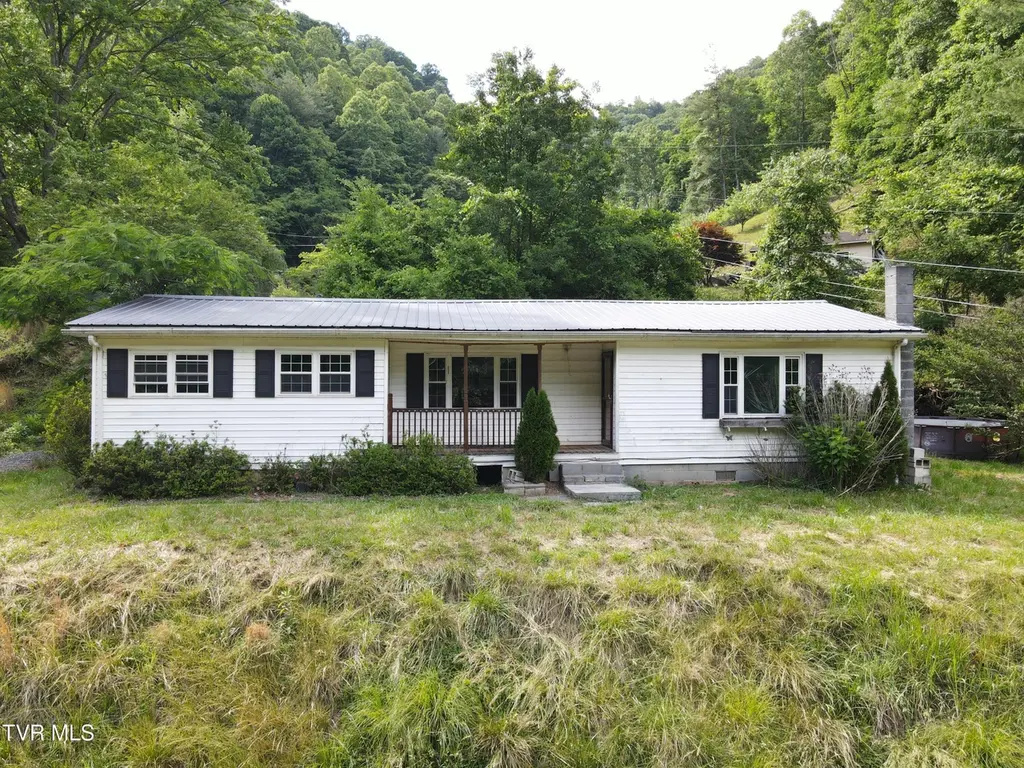
1020 Steep Fork Rd · Vansant, VA
Flood risk 10/10 · Severe
- FEMA flood zone
- X (unshaded)
- Chance of flooding over 30 yrs
- 0.99%
- Est. flood insurance / yr
- $473 – $860
Fire risk 5/10 · Moderate
- Est. fire insurance / yr
- $666 – $1,236
Heat risk 3/10 · Minor
- Hot days now (above 98°F)
- 8 days/yr
- Hot days in 30 yrs
- 22 days/yr
Wind risk 2/10 · Minimal
- Chance of severe wind over 30 yrs
- —
Air-quality risk 1/10 · Minimal
- Unhealthy air days now
- 0 days/yr
- Unhealthy air days in 30 yrs
- 0 days/yr
Risk factors via First Street. Map © Google.
Why this score? — see what drove the B grade
The composite is a weighted blend of 9 inputs, each scored 0–100. Each bar is that input's sub-score; the figure is the points it added to the 100-point composite (weight × sub-score).
- Cash flow +30.0/30.0
- DSCR +10.0/10.0
- 1% rule +9.6/10.0
- ARV discount +7.5/15.0
- Schools +4.8/10.0
- Appreciation +3.5/10.0
- Livability +2.7/5.0
- Rent growth +2.5/5.0
- Condition / age +2.5/5.0
$84,900
🖨 Deal sheet (PDF) 📄 Offer letter ✓ Due diligence
Listing remarks MLS
VERY NICE 4 BEDROOM, 1 BATH RANCH. OPEN FLOOR PLAN, COMPLETELY UPDATED INSIDE AND OUT. INTERIOR FEATURES NEW VINYL IN KITCHEN, NEW CARPET, KITCHEN APPLIANCES. NEW WINDOWS AND METAL ROOF & STORM DOOR. CARRIER HEAT PUMP, COVERED FRONT AND BACK PORCHES. LARGE LAUNDRY ROOM, KNOTTY PINE KITCHEN CABINETS.
Key facts
- 0.4 acre lot
- Built 1970
- Listed 17 days
Property features AI
Exterior
- Parking: Driveway
- Utilities: Public water; Septic tank
- Home design: Single-family house; Single-story
- Construction: Vinyl siding; Metal roof; Built as a house
- Exterior features: Front porch; Rear porch; Outbuilding/shed
Interior
- Kitchen: Built-in electric oven; Cooktop; Dishwasher; Refrigerator
- Bedrooms: 6 total rooms (includes bedrooms and living spaces)
- Flooring: Carpet; Vinyl
- Bathrooms: 1 full bathroom
- Heating & cooling: Heat pump for heating and cooling
- Interior features: Double-pane windows; Crawl space basement
- Laundry & utility: Washer hookup; Electric dryer hookup; Washer included
Neighborhood map
What this means for you Summary
Snapshot
- This is a 4-bed/1.0-bath other listed at $85k.
Deal economics
- At list price, monthly cash flow is $338 ($4k/yr) — positive.
- The deal already cash-flows at list — no discount required.
- Meets the 1% rule at list price ($1k rent vs $85k).
- Recommended offer: $84k (1.5% below list) — sets the bar for market timing.
Location & tenants
- Location reads 54/100 on livability (#523 in VA) — a working-class tenant base; expect higher turnover. Strengths: cost of living A+, housing A+, crime A; Watch: amenities F, commute F, employment F.
- Buchanan County Public School District (rural): math 52% / reading 65% proficiency, ranked #76 of 131 in VA (top 58%) — acceptable for families but not a draw, mixed tenant base, ~2y average lease; 62% free/reduced lunch — lower-income household profile, screen leases tightly.
- Zoned schools: Riverview Elementary/Middle (math 49% / reading 60%, grade C, #650 of 1,108 statewide, top 62%, 750 students, 88% FRL); Grundy High (math 77% / reading 72%, grade B+, #107 of 319 statewide, top 37%, 355 students, 97% FRL) — zoned schools average 92% FRL vs 62% district-wide (30 pts higher); higher-poverty schools than district average — tighter screening recommended.
- Market conditions: 27 active listings in the ZIP; 12 units permitted in Buchanan County in 2024 (0 in 5+ unit buildings).
Forward outlook
- Local home prices are declining (-3.0%/yr); year-one equity from $587 of loan paydown is wiped out by about $3k of value loss. Plan a longer hold.
- Buchanan County population projected at -32% by 2050 — secular population decline; favor cash flow + early exit over multi-decade hold.
- At projected returns (-3.0% appreciation + 3.0% rent growth), your $24k cash investment doubles in ~7 years — after that, you're playing with house money.
Negotiation context
- It's been on market 18 days — a 2% lower offer ($84k) is reasonable based on typical stale-listing flexibility.
- 2 sale attempts since 11y ago with the ask held roughly flat each time — persistent listings suggest the price (not the market) is what's stuck; bring a comps-based counter.
- Current owner paid $73k; 17% above their basis — modest negotiation headroom, anchor on the comps not their cost.
Risks & watch-outs
- Watch-outs: flood insurance adds $56/mo.
- Climate carrying-cost: severe flood risk; moderate wildfire risk — expect insurance premiums to compound above CPI over the hold.
Questions for the listing agent
- Built in 1970 — when were the roof, HVAC, electrical panel, plumbing, and water heater last replaced?
- What's the actual annual flood-insurance premium (NFIP or private), and is the property in a SFHA with mandatory coverage?
- Is there a deadline driving the sale (1031 exchange, divorce, estate, relocation)? That informs how much negotiation room exists.
- Schools are F-rated, which usually means shorter tenancies and higher turnover. Who's the typical renter profile here, and what's been the actual vacancy rate?
- What's the average days-on-market for RENTAL listings here right now (not sales)? A rising rental-DOM trend means longer vacancies and softer asking-rent achievability than the comps imply.
- What's the recent tenant-quality profile in this submarket — average credit score on applications, eviction rate, late-payment / NSF rate, and stable-employment percentage? A property-management company in the area should have these aggregated.
- How much new for-sale + rental construction is in the pipeline within 1–3 miles? Heavy new supply typically softens prices + rents 12–24 months out; constrained supply supports both.
Investment metrics
- 1% rule
- 1.46% ✓
- Cap rate
- 11.86%
- Cash-on-cash
- 19.88%
- DSCR
- 1.88
- GRM
- 5.7
CMA / ARV
No comps found within radius.
Projected returns pro-forma
-3.0% appreciation · 3.0% rent growth · sell at horizon
- IRR
- 8.4%
- Equity multiple
- 1.33×
- Total profit
- $7,835
- Equity at exit
- $12,659
- IRR
- 17.7%
- Equity multiple
- 2.46×
- Total profit
- $34,773
- Equity at exit
- $7,341
Cash invested: $23,772 (down + closing). Projections, not guarantees.
Landlord ↔ Tenant lean methodology
- Overall (STATE)
- 55 Moderately Landlord-Leaning
- State Virginia
- 55 Moderately Landlord-Leaning · D+2
- County
- — inherits STATE
- City
- — inherits STATE
ZIP-level market 24614
- Home prices YoY
- -3.0%
- Active inventory
- 27
- Price-to-rent
- 5.7×
Monthly cashflow live
- Estimated rent
- $1,241 medium interval (Pro) →
- Mortgage (P&I)
- −$445
- Tax est. 1.5%
- −$106 /mo · $1,274/yr
- Insurance
- −$35
- Flood insurance flood zone
- −$56 /mo · $666/yr
- HOA
- −$0
- Lot rent
- −$0
- Vacancy / Maint / Mgmt
- −$261
- Net cashflow
- $338
Break-even live
Sensitivity live
| Price | -10% $397 | -5% $368 | +0% $338 | +5% $309 | +10% $280 |
|---|---|---|---|---|---|
| Rent | -10% $240 | -5% $289 | +0% $338 | +5% $387 | +10% $436 |
| Rate | -1.0pp $381 | -0.5pp $360 | base $338 | +0.5pp $316 | +1.0pp $294 |
UW: 25.0% down · 7.5% · 30yr · 1.5% tax · 5.0% vac · 8.0% maint · 8.0% mgmt
Financing live
Cash to close
- Down payment
- $21,225
- Closing costs
- $2,547
- Reserves months
- —
- Total cash needed
- —
Loan-product check · same deal, 3 products live
Conventional
25% down · 7.5% · 30yr
- Down + closing
- —
- Monthly P&I
- —
- Monthly cashflow
- —
- DSCR
- —
- Eligible?
- —
Personal DTI + credit; lowest rate.
DSCR
20% down · 8.5% · 30yr
- Down + closing
- —
- Monthly P&I
- —
- Monthly cashflow
- —
- DSCR
- —
- Eligible?
- —
No personal income docs; deal must DSCR.
Hard money
10% down · 12.0% · 12mo
- Down + closing
- —
- Monthly P&I
- —
- Monthly cashflow
- —
- DSCR
- —
- Eligible?
- —
Short-term bridge; refi at stabilization.
Listing history 15 events
-
2026-06-22days on market $84,900 Active 18 DOM
-
2026-06-21days on market $84,900 Active 17 DOM
-
2026-06-21days on market $84,900 Active 16 DOM
-
2026-06-18days on market $84,900 Active 14 DOM
-
2026-06-17days on market $84,900 Active 13 DOM
-
2026-06-16days on market $84,900 Active 12 DOM
-
2026-06-15days on market $84,900 Active 11 DOM
-
2026-06-15days on market $84,900 Active 10 DOM
-
2026-06-13days on market $84,900 Active 9 DOM
-
2026-06-12days on market $84,900 Active 8 DOM
-
2026-06-09days on market $84,900 Active 5 DOM
-
2026-06-08days on market $84,900 Active 4 DOM
-
2026-06-08days on market $84,900 Active 3 DOM
-
2026-06-07remarks 286-char remark
-
2026-06-07$84,900 Active 2 DOM
ⓘ Source: listings_history table (triggers on properties + properties_extension) + one-shot
backfill from property_details.listing_events for pre-trigger history.
Climate risk First Street
- Flood 10/10 Extreme FEMA zone X (unshaded) · 99% chance over 30 yrs
- Wildfire 5/10 Major
- Heat 3/10 Moderate 8 d/yr ≥98°F today · 22 d/yr by 30 yrs out
- Wind 2/10 Low
- Air quality 1/10 Low 0 unhealthy d/yr today · 0 by 30 yrs out
Nearby sold comps map
Loading sold comps map…
Walkable amenities ~0.75 mi
Loading nearby amenities…
Taxation est. · year 1
- Rental income
- $14,893
- − Mortgage interest
- −$4,756
- − Property taxes
- −$1,274
- − Insurance
- −$1,091
- − Repairs & maintenance
- −$1,191
- − Management
- −$1,191
- − Depreciation
- −$2,470
- Taxable income
- $2,920
- Est. tax owed @ 24.0%
- −$701
- After-tax cash flow
- $3,357/yr
For passive investors: Depreciation is non-cash, so a rental often shows a tax loss while cash-flowing — sheltering income. Rental losses are passive: they offset passive income freely, and up to $25,000/yr can offset ordinary (W-2) income if you actively participate and your MAGI is under $100k (phasing out to $0 by $150k); unused losses carry forward. On sale, claimed depreciation is recaptured at up to 25%, and gains may owe capital-gains tax (a 1031 exchange can defer both). Figures are a year-1 estimate at your 24.0% rate — not tax advice; consult a CPA.
Schools (NCES district)
- District
- Buchanan County Public School District
- NCES district ID
- 5100510
- Math proficiency
- 52% ▼ -27.00%
- Reading proficiency
- 65% ▼ -7.00%
- Median HH income
- $29,669
- Composite
- 47.84/100
- National rank
- #2221
- State rank
- #76 of 131 in VA
Livability — Vansant
- Score
- 54/100
- State rank
- #523
- US rank
- #24092
Category grades
Schools grade is shown separately in the Schools card above.
Census & demographics
- Population (ZIP)
- 6,992
Population outlook (Buchanan County) Hauer SSP2
- Today (2025)
- 20,160 people
- By 2030
- 18,734 · -7.1%
- By 2040
- 16,071 · -20.3%
- By 2050
- 13,815 · -31.5%
- By 2075
- 10,376 · -48.5%
- By 2100
- 8,432 · -58.2%
Race, ethnicity, and origin ACS 2023
- Neighborhood character
- Predominantly White (97%)
- Race & ethnicity
- White 97% Black 1%
- Common ancestry
- Italian 1%
- Foreign-born
- 1%
- Languages at home
- 96% English-only · Spanish 2%
Political lean MEDSL · Buchanan
- 2024 margin
- Solid R (+70.6) · D 14.5% · R 85.1%
- 2008→2024 swing
- -65.1pp toward R · 2008: -5.5pp · 2024: -70.6pp
- All cycles
- 2024: R+70.6 2020: R+67.6 2016: R+60.4 2012: R+34.7 2008: R+5.5
Not yet ingested
- Civics
- —
Market trends
- HPI YoY
- ▼ -3.05%
- Current HPI
- 97.3351
- Rent YoY
- —
- Metro
- —
- State GDP YoY
- ▲ 2.40%
- F500 in state
- 50
Industry mix (Fortune 500 HQ in VA)
| Industry | F500 HQs | Revenue |
|---|---|---|
| Aerospace / Defense | 4 | $236B |
|
||
| Technology / Defense | 3 | $32B |
|
||
| Financial Services | 2 | $176B |
|
||
| Utilities | 2 | $27B |
|
||
| Insurance | 2 | $25B |
|
||
| Technology | 2 | $15B |
|
||
Price history
+24.9% since first listed4 events — show timeline
- 2026-06-04 Listed $84,900 TVRMLS
- 2026-01-23 Sold (Public Records) $72,600 Public Records
- 2017-09-19 Sold (MLS) $72,000 SWVAR
- 2015-06-02 Listed $68,000 SWVAR
Property tax history
+3.2%/yrLatest (2025): $160 · +0.0% YoY. Source: county tax records.
Cash-flow waterfall
monthlySold comps — $/sqft
last 12 mo · ≤1 miLoading sold comps…