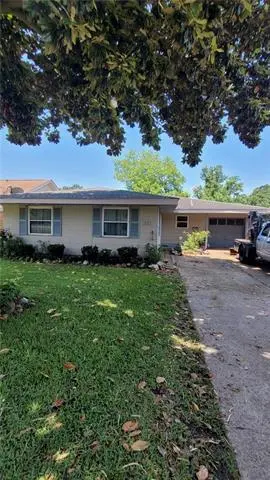
311 River Oaks Dr · New Orleans, LA
Flood risk 8/10 · Major
- FEMA flood zone
- X
- Chance of flooding over 30 yrs
- 0.6%
- Est. flood insurance / yr
- $507 – $1,088
Fire risk 1/10 · Minimal
- Est. fire insurance / yr
- $1,269 – $2,357
Heat risk 10/10 · Severe
- Hot days now (above 108°F)
- 7 days/yr
- Hot days in 30 yrs
- 21 days/yr
Wind risk 10/10 · Severe
- Chance of severe wind over 30 yrs
- 99.0%
Air-quality risk 2/10 · Minimal
- Unhealthy air days now
- 2 days/yr
- Unhealthy air days in 30 yrs
- 2 days/yr
Risk factors via First Street. Map © Google.
Why this score? — see what drove the B grade
The composite is a weighted blend of 9 inputs, each scored 0–100. Each bar is that input's sub-score; the figure is the points it added to the 100-point composite (weight × sub-score).
- Cash flow +30.0/30.0
- ARV discount +15.0/15.0
- DSCR +10.0/10.0
- 1% rule +9.9/10.0
- Livability +4.0/5.0
- Condition / age +2.5/5.0
- Schools +1.6/10.0
- Rent growth +0.2/5.0
- Appreciation +0.0/10.0
$145,000
🖨 Deal sheet (PDF) 📄 Offer letter ✓ Due diligence
Listing remarks MLS
This charming home offers comfort, convenience, and endless potential. Located in an established neighborhood with easy access to schools, shopping, dining, and major roadways. Home is being sold " As Is" Inspections would be for informational purposes only.
Key facts
- 8,267 sq ft lot
- Parking
- Built 1970
Tags
Property features AI
Exterior
- Parking: Attached, one parking space
- Utilities: Public water; Public sewer
- Home design: Single-story home
- Construction: Shingle roof; Slab foundation
- Exterior features: City lot; Rectangular lot; Lot dimensions approximately 53 x 155
Interior
- Bedrooms: 3 full bathrooms
- Bathrooms: 3 full bathrooms
- Heating & cooling: Central heating; Central air conditioning
- Interior features: Total of 9 rooms; Average condition
Neighborhood map
What this means for you Summary
Snapshot
- This is a 3-bed/2.0-bath single-family listed at $145k.
Deal economics
- At list price, monthly cash flow is $705 ($8k/yr) — positive.
- The deal already cash-flows at list — no discount required.
- Meets the 1% rule at list price ($2k rent vs $145k).
- Cap rate 12.7% vs local median 4.4% in New Orleans — top-decile yield for the area; either an underpriced asset or a hidden risk that comps aren't pricing in. Stress-test before assuming the spread holds.
Location & tenants
- Location reads 81/100 on livability (#3 in LA, #1,383 nationally) — a professional / high-income tenant draw. Strengths: amenities A+, commute A+, health & safety A+; Watch: crime C-, employment D.
- Orleans Parish (urban): math 11% / reading 27% proficiency, ranked #69 of 98 in LA (top 70%) — low school quality limits family demand, transient renter base, plan for 1-2y turnover; 68% free/reduced lunch — lower-income household profile, screen leases tightly.
- Zoned schools: Benjamin Franklin Elem. Math And Science (math 12% / reading 23%, grade F, #479 of 646 statewide, top 75%, 747 students, 98% FRL, charter) — zoned schools average 98% FRL vs 68% district-wide (30 pts higher); higher-poverty schools than district average — tighter screening recommended.
- Market conditions: Rents falling (-9.2%/yr); 275 active listings in the ZIP; 17 comparable units currently listed for rent nearby; rentals at typical pace (median 26d on market — plan ~3-4 weeks tenant-placement turnaround); 710 units permitted in Orleans Parish in 2024 (244 in 5+ unit buildings).
- This rent runs 42% of the median local income ($62k/yr) — at the standard rent-burdened threshold; future hikes will face affordability resistance.
Forward outlook
- Local home prices are declining (-3.0%/yr); year-one equity from $1k of loan paydown is wiped out by about $4k of value loss. Plan a longer hold.
- Orleans County population projected at +61% by 2050 — long-run rental-demand tailwind backs the buy-and-hold thesis.
- At projected returns (-3.0% appreciation + 0.0% rent growth), your $41k cash investment doubles in ~8 years — after that, you're playing with house money.
Negotiation context
- Only 2 days on market — expect competitive offers; lowballing is unlikely to land.
- 12 sale attempts since 22y ago with the ask held roughly flat each time — persistent listings suggest the price (not the market) is what's stuck; bring a comps-based counter.
- Current owner paid $42k; list at $145k implies a 249% gain — meaningful room to come down on a strong offer.
Risks & watch-outs
- Watch-outs: flood insurance adds $66/mo.
- Climate carrying-cost: severe flood risk; severe wind risk, 99% chance of damaging wind over 30y; extreme-heat days projected 7→21/yr by 2055 (HVAC capex compounding) — expect insurance premiums to compound above CPI over the hold.
Questions for the listing agent
- Built in 1970 — when were the roof, HVAC, electrical panel, plumbing, and water heater last replaced?
- What's the actual annual flood-insurance premium (NFIP or private), and is the property in a SFHA with mandatory coverage?
- Is there a deadline driving the sale (1031 exchange, divorce, estate, relocation)? That informs how much negotiation room exists.
- What's the average days-on-market for RENTAL listings here right now (not sales)? A rising rental-DOM trend means longer vacancies and softer asking-rent achievability than the comps imply.
- What's the recent tenant-quality profile in this submarket — average credit score on applications, eviction rate, late-payment / NSF rate, and stable-employment percentage? A property-management company in the area should have these aggregated.
- How much new for-sale + rental construction is in the pipeline within 1–3 miles? Heavy new supply typically softens prices + rents 12–24 months out; constrained supply supports both.
Investment metrics
- 1% rule
- 1.49% ✓
- Cap rate
- 12.67%
- Cash-on-cash
- 22.79%
- DSCR
- 2.01
- GRM
- 5.6
CMA / ARV
- ARV (median comp)
- $223,902
- List price
- $145,000
- Delta
- -35.24%
- Verdict
- UNDERPRICED
- Comps
- 20 within 1.0 mi
Show comp detail 12 sales within ~0.75 mi
| Address | Dist | Beds/Ba | Sqft | Sold | Price | $/sf | Match |
|---|---|---|---|---|---|---|---|
| 2133 Ellen Park Pl | 0.27mi | 3/2.5 | 2,018 (+3%) | 0mo | $186,000 | $92 | 80 |
| 2800 Hyman Pl | 0.32mi | 3/2.5 | 2,000 (+2%) | 0mo | $246,500 | $123 | 79 |
| 2638 Gallinghouse St | 0.33mi | 3/2.0 | 2,021 (+3%) | 3mo | $200,000 | $99 | 77 |
| 2542 Hudson Pl | 0.41mi | 3/2.5 | 1,903 (-3%) | 5mo | $220,000 | $116 | 70 |
| 5600 Durbridge Dr | 0.58mi | 4/2.5 (+1) | 2,100 (+7%) | 2mo | $305,000 | $145 | 52 |
| 2529 Hudson Pl | 0.38mi | 4/2.5 (+1) | 2,232 (+14%) | 0mo | $240,000 | $108 | 52 |
| 2000 Easter Ln | 0.46mi | 4/2.0 (+1) | 2,209 (+13%) | 5mo | $300,000 | $136 | 47 |
| 3221 Hyman Pl | 0.61mi | 3/2.0 | 1,708 (-13%) | 4mo | $65,000 | $38 | 47 |
| 2513 Eton St | 0.50mi | 4/2.0 (+1) | 2,210 (+13%) | 5mo | $132,000 | $60 | 46 |
| 5 Leeward Ct | 0.51mi | 4/2.5 (+1) | 2,204 (+13%) | 6mo | $365,000 | $166 | 43 |
| 3401 Huntlee Dr | 0.72mi | 3/2.0 | 1,715 (-12%) | 4mo | $180,000 | $105 | 42 |
| 5400 Macarthur Blvd | 0.71mi | 3/2.0 | 1,700 (-13%) | 4mo | $240,000 | $141 | 42 |
Match score weights: distance 35% · size 25% · config 20% · recency 20%. Top-matched comps best support the ARV.
Projected returns pro-forma
-3.0% appreciation · 0.0% rent growth · sell at horizon
- IRR
- 9.8%
- Equity multiple
- 1.37×
- Total profit
- $15,082
- Equity at exit
- $21,620
- IRR
- 16.3%
- Equity multiple
- 2.15×
- Total profit
- $46,589
- Equity at exit
- $12,537
Cash invested: $40,600 (down + closing). Projections, not guarantees.
Landlord ↔ Tenant lean methodology
- Overall (STATE)
- 90 Strongly Landlord-Friendly
- State Louisiana
- 90 Strongly Landlord-Friendly · R+12
- County
- — inherits STATE
- City
- — inherits STATE
ZIP-level market 70131
- Home prices YoY
- -12.0%
- Rents YoY
- -9.2%
- Active inventory
- 275
- Price-to-rent
- 5.6×
Monthly cashflow live
- Estimated rent
- $2,160 high interval (Pro) →
- Mortgage (P&I)
- −$760
- Tax from tax record
- −$114 /mo · $1,372/yr
- Insurance
- −$60
- Flood insurance flood zone
- −$66 /mo · $798/yr
- HOA
- −$0
- Vacancy / Maint / Mgmt
- −$454
- Net cashflow
- $705
Break-even live
Sensitivity live
| Price | -10% $787 | -5% $746 | +0% $705 | +5% $664 | +10% $623 |
|---|---|---|---|---|---|
| Rent | -10% $534 | -5% $619 | +0% $705 | +5% $790 | +10% $875 |
| Rate | -1.0pp $778 | -0.5pp $741 | base $705 | +0.5pp $667 | +1.0pp $629 |
UW: 25.0% down · 7.5% · 30yr · 1.5% tax · 5.0% vac · 8.0% maint · 8.0% mgmt
Financing live
Cash to close
- Down payment
- $36,250
- Closing costs
- $4,350
- Reserves months
- —
- Total cash needed
- —
Loan-product check · same deal, 3 products live
Conventional
25% down · 7.5% · 30yr
- Down + closing
- —
- Monthly P&I
- —
- Monthly cashflow
- —
- DSCR
- —
- Eligible?
- —
Personal DTI + credit; lowest rate.
DSCR
20% down · 8.5% · 30yr
- Down + closing
- —
- Monthly P&I
- —
- Monthly cashflow
- —
- DSCR
- —
- Eligible?
- —
No personal income docs; deal must DSCR.
Hard money
10% down · 12.0% · 12mo
- Down + closing
- —
- Monthly P&I
- —
- Monthly cashflow
- —
- DSCR
- —
- Eligible?
- —
Short-term bridge; refi at stabilization.
Rent comps 17 comps
| Address | Beds | Baths | Sqft | Rent | $/sqft | DOM | Units | Dist |
|---|---|---|---|---|---|---|---|---|
| 1410 Kabel Dr New Orleans, LA | 3.0 | 2.0 | 2200 | $2,200 | $1.00 | 25d | 1 | 0.13mi |
| 103 Danny Dr New Orleans, LA | 4.0 | 2.0 | 2040 | $2,400 | $1.18 | 25d | 1 | 0.41mi |
| 2001 Saint Nick Dr New Orleans, LA | 4.0 | 2.5 | 2400 | $2,300 | $0.96 | 25d | 1 | 0.41mi |
| 2741 Chelsea Dr New Orleans, LA | 4.0 | 2.5 | 2382 | $2,500 | $1.05 | 18d | 1 | 0.57mi |
| 3151 Plymouth Pl New Orleans, LA | 3.0 | 1.0 | 1470 | $1,700 | $1.16 | 25d | 1 | 0.60mi |
| 5801 Albany Ct New Orleans, LA | 4.0 | 2.5 | 2160 | $2,000 | $0.93 | 25d | 1 | 0.67mi |
| 3511 Hyman Pl New Orleans, LA | 3.0 | 2.0 | 1975 | $2,700 | $1.37 | 3d | 1 | 0.84mi |
| 6021 Brighton Pl New Orleans, LA | 4.0 | 3.0 | 1840 | $3,100 | $1.68 | 18d | 1 | 1.00mi |
| 3751 Herald St New Orleans, LA | 4.0 | 2.0 | 1624 | $2,150 | $1.32 | 25d | 1 | 1.01mi |
| 3738 Somerset Dr New Orleans, LA | 4.0 | 2.0 | 2247 | $3,000 | $1.34 | 16d | 1 | 1.10mi |
| 21 Carriage Ln New Orleans, LA | 3.0 | 2.5 | 1900 | $2,000 | $1.05 | 23d | 1 | 1.18mi |
| 1825 Murl St New Orleans, LA | 3.0 | 2.0 | 2484 | $1,750 | $0.70 | 25d | 1 | 1.25mi |
| 3000 Americus St New Orleans, LA | 3.0 | 2.0 | 1280 | $1,400 | $1.09 | 25d | 1 | 1.28mi |
| 1622 Jo Ann Pl New Orleans, LA | 3.0 | 1.5 | 1301 | $1,500 | $1.15 | 4d | 1 | 1.35mi |
| 1774 Pace Blvd New Orleans, LA | 4.0 | 2.5 | 1574 | $2,000 | $1.27 | 25d | 1 | 1.39mi |
| 438 Friscoville Ave Arabi, LA | 3.0 | 2.0 | 1500 | $3,200 | $2.13 | 4d | 1 | 1.41mi |
| 6015 Carlisle Ct New Orleans, LA | 3.0 | 2.0 | 2300 | $1,800 | $0.78 | 18d | 1 | 1.43mi |
Listing history 18 events
-
2026-05-16status Pending 268-char remark
Show marketing remark (268 chars)
This charming home offers comfort, convenience, and endless potential. Located in an established neighborhood with easy access to schools, shopping, dining, and major roadways. Home is being sold " As Is" Inspections would be for informational purposes only.
-
2026-05-14$145,000 Active 268-char remark
Show marketing remark (268 chars)
This charming home offers comfort, convenience, and endless potential. Located in an established neighborhood with easy access to schools, shopping, dining, and major roadways. Home is being sold " As Is" Inspections would be for informational purposes only.
-
2011-02-14soldstatus $41,500
Show marketing remark (252 chars)
Put your personal touches on this one. Great price for this area. Seller will pay up to 3% towards purchasers closing costs and provide a 2 year home warranty for owner occupied purchaser. All offers must include a preapproval letter or proof of funds.
-
2010-12-01$41,500
Show marketing remark (252 chars)
Put your personal touches on this one. Great price for this area. Seller will pay up to 3% towards purchasers closing costs and provide a 2 year home warranty for owner occupied purchaser. All offers must include a preapproval letter or proof of funds.
-
2010-06-14$56,900
-
2010-06-14$56,900
-
2009-07-11$110,000
-
2009-07-11$110,000
-
2007-06-12soldstatus $127,500
-
2007-06-08soldstatus $127,500
-
2007-01-05$135,900
-
2007-01-05$135,900
-
2004-12-30soldstatus $118,000
-
2004-05-01$120,000
-
2004-05-01$120,000
ⓘ Source: listings_history table (triggers on properties + properties_extension) + one-shot
backfill from property_details.listing_events for pre-trigger history.
Tax reassessment forecast LA · Resets to sale price
- Current annual tax
- $1,372 · $114/mo
- Projected year-2 tax
- $1,372 · $114/mo
- Expected delta
- $0/yr ($0/mo · 0.0%)
ⓘ Screening estimate from a state-policy table — verify with the county assessor before closing.
Climate risk First Street
- Flood 8/10 Severe FEMA zone X · 60% chance over 30 yrs
- Wildfire 1/10 Low
- Heat 10/10 Extreme 7 d/yr ≥108°F today · 21 d/yr by 30 yrs out
- Wind 10/10 Extreme 99% chance of damaging wind over 30 yrs
- Air quality 2/10 Low 2 unhealthy d/yr today · 2 by 30 yrs out
Nearby sold comps map
Loading sold comps map…
Walkable amenities ~0.75 mi
Loading nearby amenities…
Taxation est. · year 1
- Rental income
- $25,917
- − Mortgage interest
- −$8,122
- − Property taxes
- −$1,372
- − Insurance
- −$1,522
- − Repairs & maintenance
- −$2,073
- − Management
- −$2,073
- − Depreciation
- −$4,218
- Taxable income
- $6,535
- Est. tax owed @ 24.0%
- −$1,568
- After-tax cash flow
- $6,887/yr
For passive investors: Depreciation is non-cash, so a rental often shows a tax loss while cash-flowing — sheltering income. Rental losses are passive: they offset passive income freely, and up to $25,000/yr can offset ordinary (W-2) income if you actively participate and your MAGI is under $100k (phasing out to $0 by $150k); unused losses carry forward. On sale, claimed depreciation is recaptured at up to 25%, and gains may owe capital-gains tax (a 1031 exchange can defer both). Figures are a year-1 estimate at your 24.0% rate — not tax advice; consult a CPA.
Schools (NCES district)
- District
- Orleans Parish
- NCES district ID
- 2201170
- Math proficiency
- 11% ▼ -52.00%
- Reading proficiency
- 27% ▼ -46.00%
- Median HH income
- $37,011
- Composite
- 15.78/100
- National rank
- #9271
- State rank
- #69 of 98 in LA
Livability — New Orleans
- Score
- 81/100
- State rank
- #3
- US rank
- #1383
Category grades
Schools grade is shown separately in the Schools card above.
Census & demographics
- Census place
- New Orleans, LA
- County
- Orleans Parish · 338,817 people
- City population
- 338,817
- Metro
- New Orleans-Metairie, LA
- Population (ZIP)
- 25,151
- Household income
- $62,389
- Rent vs Own
- Severe rent burden
- 707.0
Population outlook (Orleans County) Hauer SSP2
- Today (2025)
- 513,025 people
- By 2030
- 575,781 · +12.2%
- By 2040
- 700,174 · +36.5%
- By 2050
- 826,541 · +61.1%
- By 2075
- 1,123,374 · +119.0%
- By 2100
- 1,355,609 · +164.2%
Race, ethnicity, and origin ACS 2023
- Neighborhood character
- Diverse neighborhood (Simpson 0.57)
- Race & ethnicity
- Black 62% White 20% Hispanic / Latino 11% Two or more races 6% Asian 4%
- Hispanic origin (detail)
- Mexican 2% Dominican 2%
- Common ancestry
- Lithuanian 4% Hispanic 1%
- Foreign-born
- 8% · Canada, Vietnam, China
- Languages at home
- 86% English-only · Spanish 9% Vietnamese 2% French/Haitian/Cajun 1%
Political lean MEDSL · Orleans
- 2024 margin
- Solid D (+67.0) · D 82.2% · R 15.2% · Other 2.7%
- 2008→2024 swing
- +6.7pp toward D · 2008: 60.3pp · 2024: 67.0pp
- All cycles
- 2024: D+67.0 2020: D+68.2 2016: D+66.2 2012: D+62.5 2008: D+60.3
Not yet ingested
- Civics
- —
Market trends
- HPI YoY
- ▼ -28.08%
- Current HPI
- 206.7552
- Rent YoY
- ▼ -9.23%
- Metro
- New Orleans-Metairie, LA
- State GDP YoY
- ▲ 3.29%
- F500 in state
- 10
Industry mix (Fortune 500 HQ in LA)
| Industry | F500 HQs | Revenue |
|---|---|---|
| Telecommunications | 2 | $23B |
|
||
| Utilities | 1 | $12B |
|
||
| Wholesale / Distribution | 1 | $5B |
|
||
| Advertising | 1 | $2B |
|
||
Price history
+20.8% since first listed18 events — show timeline
- 2026-05-16 Pending — AcadianaMLS
- 2026-05-16 Pending — GSREIN
- 2026-05-14 Listed $145,000 GSREIN
- 2026-05-14 Listed $145,000 AcadianaMLS
- 2011-02-14 Sold (MLS) $41,500 GSREIN
- 2010-12-01 Listed $41,500 AcadianaMLS
- 2010-12-01 Listed $41,500 GSREIN
- 2010-06-14 Listed $56,900 GSREIN
- 2010-06-14 Listed $56,900 AcadianaMLS
- 2009-07-11 Listed $110,000 GSREIN
- 2009-07-11 Listed $110,000 AcadianaMLS
- 2007-06-12 Sold (Public Records) $127,500 Public Records
- 2007-06-08 Sold (MLS) $127,500 GSREIN
- 2007-01-05 Listed $135,900 AcadianaMLS
- 2007-01-05 Listed $135,900 GSREIN
- 2004-12-30 Sold (MLS) $118,000 GSREIN
- 2004-05-01 Listed $120,000 AcadianaMLS
- 2004-05-01 Listed $120,000 GSREIN
Property tax history
+5.2%/yrLatest (2026): $1,372 · -6.5% YoY. Source: county tax records.
Cash-flow waterfall
monthlySold comps — $/sqft
last 12 mo · ≤1 miLoading sold comps…