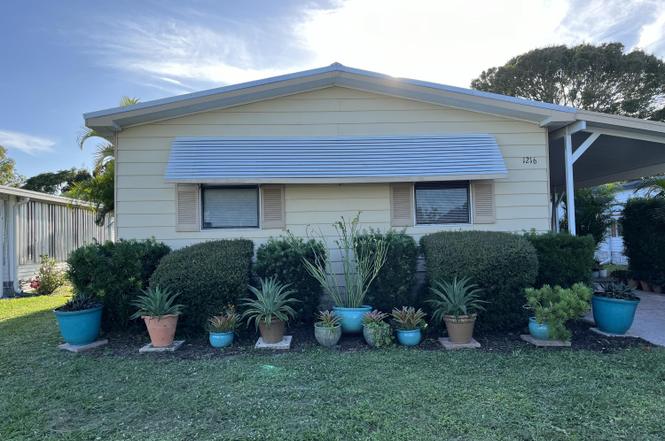
1216 Gardenia Dr · Micco, FL
Flood risk 1/10 · Minimal
- FEMA flood zone
- X (unshaded)
- Chance of flooding over 30 yrs
- 0.0%
- Est. flood insurance / yr
- $507 – $1,088
Fire risk 5/10 · Moderate
- Est. fire insurance / yr
- $947 – $1,759
Heat risk 10/10 · Severe
- Hot days now (above 106°F)
- 7 days/yr
- Hot days in 30 yrs
- 24 days/yr
Wind risk 10/10 · Severe
- Chance of severe wind over 30 yrs
- 99.0%
Air-quality risk 1/10 · Minimal
- Unhealthy air days now
- 0 days/yr
- Unhealthy air days in 30 yrs
- 0 days/yr
Risk factors via First Street. Map © Google.
Why this score? — see what drove the D grade
The composite is a weighted blend of 9 inputs, each scored 0–100. Each bar is that input's sub-score; the figure is the points it added to the 100-point composite (weight × sub-score).
- Cash flow +12.7/30.0
- ARV discount +7.5/15.0
- Schools +4.7/10.0
- 1% rule +4.6/10.0
- DSCR +3.8/10.0
- Livability +3.2/5.0
- Rent growth +2.5/5.0
- Condition / age +2.5/5.0
- Appreciation +0.0/10.0
$182,000
🖨 Deal sheet (PDF) 📄 Offer letter ✓ Due diligence
Listing remarks MLS
Welcome to this charming home in a prime location. Nestled along the tranquil canal front. The enclosed porch offers year round enjoyment. Roof is 2019, Water heater 2016, A/C 2014, New flooring, Updated kitchen, updated plumbing, New appliances, new bath vanity/sink, New vapor barrier. Great location within walking distance to pool, and most amenities. Don't miss out on this gem.
Key facts
- Canal front
- Enclosed porch
- Updated kitchen
Tags
Property features AI
Exterior
- Parking: Carport (1 space)
- Utilities: Public sewer; Electricity connected; Water connected; Sewer connected
- Home design: Manufactured home; North-facing
- Construction: Stucco and vinyl siding exterior; Metal roof
- Exterior features: Front porch; Canal-front waterfront
Interior
- Kitchen: Dishwasher; Electric range; Refrigerator
- Bedrooms: 2 bedrooms
- Flooring: Laminate flooring
- Bathrooms: 2 full bathrooms
- Heating & cooling: Central heating (electric); Central air conditioning (electric)
- Interior features: Ceiling fans; Open floor plan; Split bedroom layout; 5 total rooms
- Laundry & utility: Unfurnished (no built-in washer/dryer listed)
Neighborhood map
What this means for you Summary
Snapshot
- This is a 3-bed/2.0-bath manufactured listed at $182k.
Deal economics
- At list price, monthly cash flow is $-19 ($-229/yr) — negative.
- To cash-flow at today's rent, offer at most $179k (1.8% below list).
- To meet the 1% rule (rent ≥ 1% of price), the offer needs to be $174k (4.2% below list).
- Recommended offer: $166k (9.0% below list) — sets the bar for market timing.
Location & tenants
- Location reads 65/100 on livability (#633 in FL) — a middle-class / working-renter tenant base. Strengths: cost of living A+, housing A+; Watch: employment D, amenities F, commute F.
- Brevard (suburban): math 53% / reading 57% proficiency, ranked #19 of 73 in FL (top 26%) — acceptable for families but not a draw, mixed tenant base, ~2y average lease.
- Zoned schools: Sunrise Elementary School (math 52% / reading 57%, grade C, #892 of 2,144 statewide, top 44%, 759 students, 58% FRL); Southwest Middle School (math 40% / reading 39%, grade F, #373 of 571 statewide, top 66%, 920 students, 58% FRL); Bayside High School (math 27% / reading 40%, grade F, #400 of 667 statewide, top 61%, 1,854 students, 51% FRL).
- Zoned-school proficiency averages 42% at this address vs 55% district-wide (-12 pts) — the specific schools serving this property underperform the Brevard average; the district grade overstates school quality for this exact location.
- Market conditions: 186 active listings in the ZIP; 15 comparable units currently listed for rent nearby; rentals at typical pace (median 25d on market — plan ~3-4 weeks tenant-placement turnaround); 4,602 units permitted in Brevard County in 2024 (702 in 5+ unit buildings).
Forward outlook
- Local home prices are declining (-3.0%/yr); year-one equity from $1k of loan paydown is wiped out by about $5k of value loss. Plan a longer hold.
- Brevard County population projected at +15% by 2050 — modest demand growth; plan on rents tracking national, not racing it.
Negotiation context
- It's been on market 108 days — a 9% lower offer ($166k) is reasonable based on typical stale-listing flexibility.
- 10 sale attempts since 19y ago; this cycle's ask is 11275% above the opening price — seller raised mid-cycle; expect resistance to lowballs.
- Current owner paid $45k; list at $182k implies a 304% gain — meaningful room to come down on a strong offer.
Risks & watch-outs
- Climate carrying-cost: severe wind risk, 99% chance of damaging wind over 30y; moderate wildfire risk; extreme-heat days projected 7→24/yr by 2055 (HVAC capex compounding) — expect insurance premiums to compound above CPI over the hold.
Questions for the listing agent
- What do current leases actually rent for vs. the listed asking? Can we see a recent rent roll and the last 12 months of T-12 income?
- It's been on market 108 days. Have you received any prior offers? Is the seller open to a 9% concession, seller financing, or rate buy-down credit?
- Why hasn't it sold? Are there any deal-killer items the seller is aware of (foundation, flood, title, zoning, code violations)?
- Is there a deadline driving the sale (1031 exchange, divorce, estate, relocation)? That informs how much negotiation room exists.
- Schools are F-rated, which usually means shorter tenancies and higher turnover. Who's the typical renter profile here, and what's been the actual vacancy rate?
- The area grade is low — what's the realistic commute time and amenity access for the typical tenant pool here? Any planned neighborhood developments (good or bad) we should know about?
- What's the average days-on-market for RENTAL listings here right now (not sales)? A rising rental-DOM trend means longer vacancies and softer asking-rent achievability than the comps imply.
- What's the recent tenant-quality profile in this submarket — average credit score on applications, eviction rate, late-payment / NSF rate, and stable-employment percentage? A property-management company in the area should have these aggregated.
- How much new for-sale + rental construction is in the pipeline within 1–3 miles? Heavy new supply typically softens prices + rents 12–24 months out; constrained supply supports both.
Investment metrics
- 1% rule
- 0.96% ✗
- Cap rate
- 6.17%
- Cash-on-cash
- -0.45%
- DSCR
- 0.98
- GRM
- 8.7
CMA / ARV
No comps found within radius.
Projected returns pro-forma
-3.0% appreciation · 3.0% rent growth · sell at horizon
- IRR
- -17.0%
- Equity multiple
- 0.40×
- Total profit
- $-30,593
- Equity at exit
- $27,137
- IRR
- -8.7%
- Equity multiple
- 0.46×
- Total profit
- $-27,746
- Equity at exit
- $15,736
Cash invested: $50,960 (down + closing). Projections, not guarantees.
Landlord ↔ Tenant lean methodology
- Overall (STATE)
- 87 Strongly Landlord-Friendly
- State Florida
- 87 Strongly Landlord-Friendly · R+3
- County
- — inherits STATE
- City
- — inherits STATE
ZIP-level market 32976
- Home prices YoY
- -18.6%
- Active inventory
- 186
- Price-to-rent
- 8.7×
Monthly cashflow live
- Estimated rent
- $1,744 high interval (Pro) →
- Mortgage (P&I)
- −$954
- Tax from tax record
- −$367 /mo · $4,402/yr
- Insurance
- −$76
- HOA
- −$0
- Vacancy / Maint / Mgmt
- −$366
- Net cashflow
- $-19
Break-even live
Sensitivity live
| Price | -10% $84 | -5% $32 | +0% $-19 | +5% $-71 | +10% $-122 |
|---|---|---|---|---|---|
| Rent | -10% $-157 | -5% $-88 | +0% $-19 | +5% $50 | +10% $119 |
| Rate | -1.0pp $73 | -0.5pp $27 | base $-19 | +0.5pp $-66 | +1.0pp $-114 |
UW: 25.0% down · 7.5% · 30yr · 1.5% tax · 5.0% vac · 8.0% maint · 8.0% mgmt
Financing live
Cash to close
- Down payment
- $45,500
- Closing costs
- $5,460
- Reserves months
- —
- Total cash needed
- —
Loan-product check · same deal, 3 products live
Conventional
25% down · 7.5% · 30yr
- Down + closing
- —
- Monthly P&I
- —
- Monthly cashflow
- —
- DSCR
- —
- Eligible?
- —
Personal DTI + credit; lowest rate.
DSCR
20% down · 8.5% · 30yr
- Down + closing
- —
- Monthly P&I
- —
- Monthly cashflow
- —
- DSCR
- —
- Eligible?
- —
No personal income docs; deal must DSCR.
Hard money
10% down · 12.0% · 12mo
- Down + closing
- —
- Monthly P&I
- —
- Monthly cashflow
- —
- DSCR
- —
- Eligible?
- —
Short-term bridge; refi at stabilization.
Rent comps 15 comps
| Address | Beds | Baths | Sqft | Rent | $/sqft | DOM | Units | Dist |
|---|---|---|---|---|---|---|---|---|
| 621 Hyacinth Cir Sebastian, FL | 2.0 | 2.0 | 1324 | $1,850 | $1.40 | 25d | 1 | 0.15mi |
| 904 Red Bud Rd Sebastian, FL | 3.0 | 2.0 | 1278 | $1,500 | $1.17 | 25d | 1 | 0.15mi |
| 706 Hyacinth Cir Sebastian, FL | 2.0 | 2.0 | 1062 | $1,750 | $1.65 | 25d | 1 | 0.31mi |
| 909 Sequoia St Sebastian, FL | 2.0 | 2.0 | 1156 | $1,845 | $1.60 | 25d | 1 | 0.32mi |
| 1207 Marigold Dr Sebastian, FL | 2.0 | 2.0 | 1104 | $1,500 | $1.36 | 25d | 1 | 0.39mi |
| 914 Pecan Cir Sebastian, FL | 2.0 | 1.0 | 1000 | $1,600 | $1.60 | 25d | 1 | 0.45mi |
| 7629 Chasta Rd Sebastian, FL | 2.0 | 2.0 | 958 | $1,600 | $1.67 | 25d | 1 | 0.60mi |
| 7606 Cedar Bark Rd Sebastian, FL | 2.0 | 2.0 | 1273 | $1,800 | $1.41 | 25d | 1 | 0.62mi |
| 7597 Cedar Bark Rd Sebastian, FL | 2.0 | 2.0 | 902 | $1,700 | $1.88 | 25d | 1 | 0.64mi |
| 702 Lark Dr Sebastian, FL | 3.0 | 2.0 | 1296 | $1,775 | $1.37 | 25d | 1 | 0.66mi |
| 415 Plover Dr Sebastian, FL | 3.0 | 2.0 | 1200 | $2,400 | $2.00 | 25d | 1 | 0.67mi |
| 629 W Marlin Cir Unit NA Sebastian, FL | 2.0 | 2.0 | 1104 | $1,400 | $1.27 | 16d | 1 | 0.74mi |
| 1112 Pocatella Dr Sebastian, FL | 2.0 | 2.0 | 1370 | $1,900 | $1.39 | 25d | 1 | 0.80mi |
| 1315 Barefoot Cir Sebastian, FL | 2.0 | 2.0 | 1167 | $2,300 | $1.97 | 25d | 1 | 0.90mi |
| 830 Lychee Dr Sebastian, FL | 2.0 | 2.0 | 1269 | $2,000 | $1.58 | 25d | 1 | 1.11mi |
Listing history 37 events
-
2026-06-22days on market $182,000 Active 108 DOM
-
2026-06-18days on market $182,000 Active 105 DOM
-
2026-06-17days on market $182,000 Active 104 DOM
-
2026-06-16days on market $182,000 Active 103 DOM
-
2026-06-15days on market $182,000 Active 102 DOM
-
2026-06-14days on market $182,000 Active 100 DOM
-
2026-06-10days on market $182,000 Active 97 DOM
-
2026-06-08days on market $182,000 Active 95 DOM
-
2026-06-07days on market $182,000 Active 94 DOM
-
2026-06-05days on market $182,000 Active 91 DOM
-
2026-06-03days on market $182,000 Active 90 DOM
-
2026-06-02days on market $182,000 Active 89 DOM
-
2026-06-01days on market $182,000 Active 88 DOM
-
2026-05-31days on market $182,000 Active 87 DOM
-
2026-05-31days on market $182,000 Active 86 DOM
-
2026-05-22historical $1,600
-
2026-05-02$1,600
-
2026-04-17price $182,000
-
2026-03-31price $182,500
-
2026-03-04$189,000 Active
-
2025-02-11historical $1,600
-
2025-02-06$1,600
-
2025-01-31historical 383-char remark
Show marketing remark (383 chars)
Welcome to this charming home in a prime location. Nestled along the tranquil canal front. The enclosed porch offers year round enjoyment. Roof is 2019, Water heater 2016, A/C 2014, New flooring, Updated kitchen, updated plumbing, New appliances, new bath vanity/sink, New vapor barrier. Great location within walking distance to pool, and most amenities. Don't miss out on this gem.
-
2024-10-14$188,900 Active 383-char remark
Show marketing remark (383 chars)
Welcome to this charming home in a prime location. Nestled along the tranquil canal front. The enclosed porch offers year round enjoyment. Roof is 2019, Water heater 2016, A/C 2014, New flooring, Updated kitchen, updated plumbing, New appliances, new bath vanity/sink, New vapor barrier. Great location within walking distance to pool, and most amenities. Don't miss out on this gem.
-
2024-07-27historical 471-char remark
Show marketing remark (471 chars)
Welcome to this charming home in a prime location. Nestled along the tranquil canal front. The enclosed porch offers year round enjoyment. Roof is 2019, Water heater 2016, A/C 2014, New flooring, updated kitchen(cabinet doors are being custom made)updated plumbing, new bath vanity/sink. New Vapor Barrier. Great location within walking distance to the pool, and most amenities. Don't miss out on this gem! Owner will consider holding mortgage with a decent down payment.
-
2024-05-04$188,900 Active 471-char remark
Show marketing remark (471 chars)
Welcome to this charming home in a prime location. Nestled along the tranquil canal front. The enclosed porch offers year round enjoyment. Roof is 2019, Water heater 2016, A/C 2014, New flooring, updated kitchen(cabinet doors are being custom made)updated plumbing, new bath vanity/sink. New Vapor Barrier. Great location within walking distance to the pool, and most amenities. Don't miss out on this gem! Owner will consider holding mortgage with a decent down payment.
-
2016-08-16historical
-
2013-12-18soldstatus $45,000
-
2013-09-05$47,900
-
2013-04-30historical
-
2013-04-17$49,900
-
2013-03-11soldstatus $25,000
-
2013-02-10$32,900
-
2008-09-09soldstatus $75,000
-
2008-08-25soldstatus $75,000
-
2007-11-01$79,000
-
2007-10-20$89,900
ⓘ Source: listings_history table (triggers on properties + properties_extension) + one-shot
backfill from property_details.listing_events for pre-trigger history.
Tax reassessment forecast FL · Resets to sale price
- Current annual tax
- $4,402 · $367/mo
- Projected year-2 tax
- $4,402 · $367/mo
- Expected delta
- $0/yr ($0/mo · 0.0%)
ⓘ Screening estimate from a state-policy table — verify with the county assessor before closing.
Climate risk First Street
- Flood 1/10 Low FEMA zone X (unshaded) · 0% chance over 30 yrs
- Wildfire 5/10 Major
- Heat 10/10 Extreme 7 d/yr ≥106°F today · 24 d/yr by 30 yrs out
- Wind 10/10 Extreme 99% chance of damaging wind over 30 yrs
- Air quality 1/10 Low 0 unhealthy d/yr today · 0 by 30 yrs out
Nearby sold comps map
Loading sold comps map…
Walkable amenities ~0.75 mi
Loading nearby amenities…
Taxation est. · year 1
- Rental income
- $20,933
- − Mortgage interest
- −$10,195
- − Property taxes
- −$4,402
- − Insurance
- −$910
- − Repairs & maintenance
- −$1,675
- − Management
- −$1,675
- − Depreciation
- −$5,295
- Taxable loss
- −$3,218
- Est. tax savings @ 24.0%
- +$772
- After-tax cash flow
- $544/yr
For passive investors: Depreciation is non-cash, so a rental often shows a tax loss while cash-flowing — sheltering income. Rental losses are passive: they offset passive income freely, and up to $25,000/yr can offset ordinary (W-2) income if you actively participate and your MAGI is under $100k (phasing out to $0 by $150k); unused losses carry forward. On sale, claimed depreciation is recaptured at up to 25%, and gains may owe capital-gains tax (a 1031 exchange can defer both). Figures are a year-1 estimate at your 24.0% rate — not tax advice; consult a CPA.
Schools (NCES district)
- District
- Brevard
- NCES district ID
- 1200150
- Math proficiency
- 53% ▼ -9.00%
- Reading proficiency
- 57% ▼ -4.00%
- Median HH income
- $49,426
- Composite
- 46.86/100
- National rank
- #2370
- State rank
- #19 of 73 in FL
Livability — Micco
- Score
- 65/100
- State rank
- #633
- US rank
- #12408
Category grades
Schools grade is shown separately in the Schools card above.
Census & demographics
- Census place
- Micco, FL
- Population (ZIP)
- 9,237
Population outlook (Brevard County) Hauer SSP2
- Today (2025)
- 623,254 people
- By 2030
- 648,420 · +4.0%
- By 2040
- 690,009 · +10.7%
- By 2050
- 715,669 · +14.8%
- By 2075
- 775,744 · +24.5%
- By 2100
- 776,687 · +24.6%
Race, ethnicity, and origin ACS 2023
- Neighborhood character
- Predominantly White (93%)
- Race & ethnicity
- White 93% Hispanic / Latino 4% Two or more races 1% Asian 1%
- Common ancestry
- Lithuanian 5% Romanian 4% Iranian 2%
- Foreign-born
- 4% · Canada, Jamaica
- Languages at home
- 95% English-only · Spanish 3%
Political lean MEDSL · Brevard
- 2024 margin
- Strong R (+20.8) · D 39.1% · R 59.9% · Other 1.0%
- 2008→2024 swing
- -10.4pp toward R · 2008: -10.4pp · 2024: -20.8pp
- All cycles
- 2024: R+20.8 2020: R+16.4 2016: R+19.8 2012: R+12.7 2008: R+10.4
Not yet ingested
- Civics
- —
Market trends
- HPI YoY
- ▼ -73.57%
- Current HPI
- 321.5196
- Rent YoY
- —
- Metro
- —
- State GDP YoY
- ▲ 3.28%
- F500 in state
- 36
Industry mix (Fortune 500 HQ in FL)
| Industry | F500 HQs | Revenue |
|---|---|---|
| Industrial Technology | 2 | $29B |
|
||
| Insurance | 2 | $17B |
|
||
| Retail | 1 | $60B |
|
||
| Technology Distribution | 1 | $58B |
|
||
| Homebuilding | 1 | $35B |
|
||
| Technology Manufacturing | 1 | $35B |
|
||
Price history
-98.2% since first listed22 events — show timeline
- 2026-05-22 Rental Removed $1,600 SCMLS
- 2026-05-02 Listed for Rent $1,600 SCMLS
- 2026-04-17 Price Changed $182,000 SCMLS
- 2026-03-31 Price Changed $182,500 SCMLS
- 2026-03-04 Listed $189,000 SCMLS
- 2025-02-11 Rental Removed $1,600 SCMLS
- 2025-02-06 Listed for Rent $1,600 SCMLS
- 2025-01-31 Listing Removed — SCMLS
- 2024-10-14 Listed $188,900 SCMLS
- 2024-07-27 Listing Removed — SCMLS
- 2024-05-04 Listed $188,900 SCMLS
- 2016-08-16 Listing Removed — SCMLS
- 2013-12-18 Sold (MLS) $45,000 SCMLS
- 2013-09-05 Listed $47,900 SCMLS
- 2013-04-30 Listing Removed — SCMLS
- 2013-04-17 Listed $49,900 SCMLS
- 2013-03-11 Sold (MLS) $25,000 SCMLS
- 2013-02-10 Listed $32,900 SCMLS
- 2008-09-09 Sold (Public Records) $75,000 Public Records
- 2008-08-25 Sold (MLS) $75,000 SCMLS
- 2007-11-01 Listed $79,000 SCMLS
- 2007-10-20 Listed $89,900 SCMLS
Property tax history
+23.0%/yrLatest (2025): $4,402 · +43.1% YoY. Source: county tax records.
Cash-flow waterfall
monthlySold comps — $/sqft
last 12 mo · ≤1 miLoading sold comps…