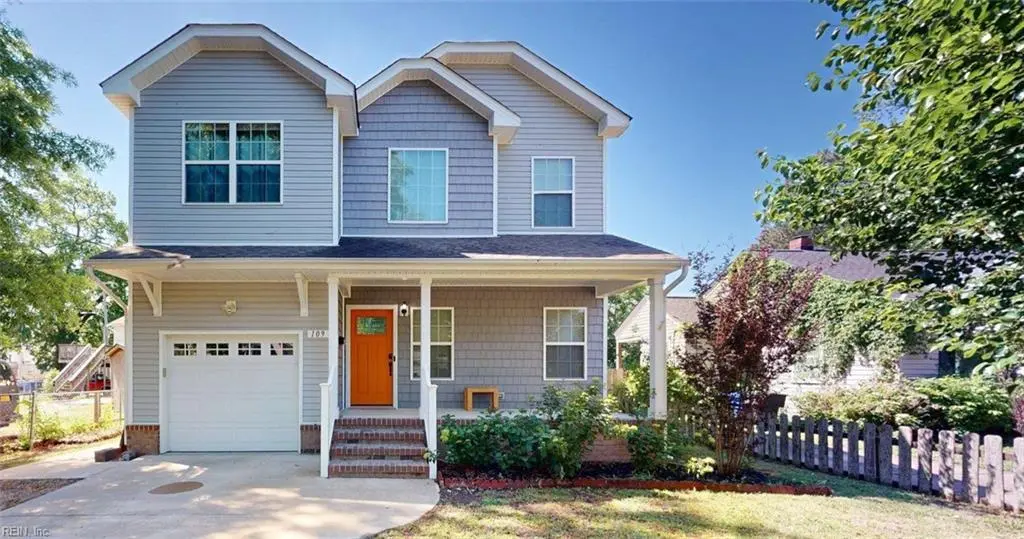
109 Appomattox Ave · Portsmouth, VA
Flood risk 3/10 · Minor
- FEMA flood zone
- X (unshaded)
- Chance of flooding over 30 yrs
- 0.09%
- Est. flood insurance / yr
- $507 – $1,088
Fire risk 1/10 · Minimal
- Est. fire insurance / yr
- $666 – $1,236
Heat risk 9/10 · Severe
- Hot days now (above 106°F)
- 7 days/yr
- Hot days in 30 yrs
- 16 days/yr
Wind risk 8/10 · Major
- Chance of severe wind over 30 yrs
- 80.0%
Air-quality risk 5/10 · Moderate
- Unhealthy air days now
- 6 days/yr
- Unhealthy air days in 30 yrs
- 7 days/yr
Risk factors via First Street. Map © Google.
Why this score? — see what drove the D grade
The composite is a weighted blend of 9 inputs, each scored 0–100. Each bar is that input's sub-score; the figure is the points it added to the 100-point composite (weight × sub-score).
- Appreciation +10.0/10.0
- ARV discount +7.9/15.0
- Cash flow +7.0/30.0
- Schools +3.9/10.0
- Livability +3.7/5.0
- Rent growth +3.5/5.0
- Condition / age +2.5/5.0
- 1% rule +1.6/10.0
- DSCR +1.2/10.0
$369,900
🖨 Deal sheet (PDF) 📄 Offer letter ✓ Due diligence
Listing remarks
Welcome to 109 Appomattox Avenue, a beautifully maintained newer home offering space, functionality, & an easy-flow layout designed for everyday living. Built in 2016, this spacious 4-bedroom, 2.5-bath home features over 2,100 square feet with an open-concept design that feels both comfortable and inviting from the moment you walk in. The main living area offers great natural flow for entertaining or simply enjoying day-to-day life, while thoughtful details throughout the home add warmth and character. The kitchen opens seamlessly into the living and dining spaces, creating a layout today’s buyers are truly looking for. Upstairs, the generous primary suite includes a double vanit
Key facts
- Open-concept design
- Double vanity
- Deck
Tags
Property features AI
Finance
- Other: Lot dimensions approximately 125 x 50 (0.14 acres); Neighborhood: HIGHLAND BILTMORE
- HOA & community: No HOA fees
Exterior
- Parking: Attached 1-car garage; Additional 2 spaces; Driveway parking; Garage approximately 210 sq ft
- Utilities: City/County water; City/County sewer; Electric power
- Home design: Detached transitional-style home; Two stories; Crawl foundation
- Construction: Vinyl siding; Asphalt shingle roof
- Exterior features: Deck; Privacy fence
Interior
- Kitchen: Dishwasher; Disposal; Microwave; Electric range; Refrigerator; Pantry; Breakfast area
- Bedrooms: One bedroom with ensuite
- Flooring: Carpet; Laminate
- Bathrooms: Two full bathrooms; One half bathroom
- Heating & cooling: Electric heating (forced hot air); Heat pump; Central air
- Interior features: Ceiling fan; Scuttle access; Walk-in closet
- Laundry & utility: Washer; Dryer; Utility room; Electric water heater
Neighborhood map
What this means for you Summary
Snapshot
- This is a 4-bed/2.5-bath single-family listed at $370k.
Deal economics
- At list price, monthly cash flow is $-543 ($-7k/yr) — negative.
- To cash-flow at today's rent, offer at most $274k (25.9% below list).
- To meet the 1% rule (rent ≥ 1% of price), the offer needs to be $243k (34.4% below list).
- Recommended offer: $243k (34.4% below list) — sets the bar for 1% rule.
Location & tenants
- Location reads 73/100 on livability (#172 in VA) — a middle-class / working-renter tenant base. Strengths: amenities A+, cost of living A+, housing A+; Watch: employment C-, crime F, commute F.
- Portsmouth City Public School District (urban): math 34% / reading 58% proficiency, ranked #107 of 131 in VA (top 82%) — families likely to look elsewhere, expect single-tenant / working-renter base with shorter leases.
- Zoned schools: Victory Elementary (math 37% / reading 57%, grade D-, #794 of 1,108 statewide, top 74%, 589 students, 117% FRL); Cradock Middle (math 32% / reading 62%, grade D+, #257 of 342 statewide, top 77%, 533 students, 100% FRL); Manor High (math 48% / reading 75%, grade B-, #240 of 319 statewide, top 75%, 1,236 students, 99% FRL) — zoned schools average 105% FRL vs 60% district-wide (45 pts higher); higher-poverty schools than district average — tighter screening recommended.
- Market conditions: Rents rising (+4.0%/yr); 65 active listings in the ZIP; 15 comparable units currently listed for rent nearby; rentals at typical pace (median 26d on market — plan ~3-4 weeks tenant-placement turnaround); 40% of comp listings sitting > 30 days — soft ceiling on asking rent; 300 units permitted in Portsmouth city in 2024 (112 in 5+ unit buildings).
- At $2,428/mo this rent would consume 60% of the median local household income ($49k/yr) (locally 534% of renters already pay >50% of income on rent) — very limited rent-growth headroom before tenants either downsize or default.
Forward outlook
- In year one you build about $40k of equity ($3k loan paydown + $37k appreciation (10.0% local appreciation)).
- By year 2, paydown + projected appreciation supports a ~$64k cash-out refi (75% LTV) — recoverable capital for the next deal without selling this one.
Negotiation context
- Only 10 days on market — expect competitive offers; lowballing is unlikely to land.
- 4 sale attempts since 10y ago with the ask held roughly flat each time — persistent listings suggest the price (not the market) is what's stuck; bring a comps-based counter.
- Current owner paid $290k; 28% above their basis — modest negotiation headroom, anchor on the comps not their cost.
Risks & watch-outs
- Climate carrying-cost: severe wind risk, 80% chance of damaging wind over 30y; extreme-heat days projected 7→16/yr by 2055 (HVAC capex compounding) — expect insurance premiums to compound above CPI over the hold.
Questions for the listing agent
- What do current leases actually rent for vs. the listed asking? Can we see a recent rent roll and the last 12 months of T-12 income?
- Is there a deadline driving the sale (1031 exchange, divorce, estate, relocation)? That informs how much negotiation room exists.
- Schools are B-rated — typically a magnet for longer-tenancy family renters. What's the average tenant stay here, and is there a school-zone premium baked into asking?
- Crime grade is F in this area — have there been break-ins, vandalism, or insurance claims at this property in the last 3 years? What carrier currently insures it and at what premium?
- The area grade is low — what's the realistic commute time and amenity access for the typical tenant pool here? Any planned neighborhood developments (good or bad) we should know about?
- What's the average days-on-market for RENTAL listings here right now (not sales)? A rising rental-DOM trend means longer vacancies and softer asking-rent achievability than the comps imply.
- What's the recent tenant-quality profile in this submarket — average credit score on applications, eviction rate, late-payment / NSF rate, and stable-employment percentage? A property-management company in the area should have these aggregated.
- How much new for-sale + rental construction is in the pipeline within 1–3 miles? Heavy new supply typically softens prices + rents 12–24 months out; constrained supply supports both.
Investment metrics
- 1% rule
- 0.66% ✗
- Cap rate
- 4.53%
- Cash-on-cash
- -6.29%
- DSCR
- 0.72
- GRM
- 12.7
CMA / ARV
- ARV (on-the-fly)
- $373,584
- Comps found
- 12
Show comp detail 12 sales within ~0.75 mi
| Address | Dist | Beds/Ba | Sqft | Sold | Price | $/sf | Match |
|---|---|---|---|---|---|---|---|
| 109 Appomattox Ave | 0.00mi | 4/2.5 | 2,172 (0%) | 1mo | $375,000 | $173 | 99 |
| 316 Wall St | 0.51mi | 4/2.5 | 2,205 (+2%) | 1mo | $350,000 | $159 | 73 |
| 502 Beacon Rd | 0.47mi | 4/2.5 | 2,116 (-3%) | 2mo | $365,000 | $172 | 72 |
| 3906 Deep Creek Blvd | 0.19mi | 4/2.5 | 1,900 (-12%) | 2mo | $288,700 | $152 | 69 |
| 248 Harmony Dr | 0.52mi | 4/2.5 | 2,112 (-3%) | 3mo | $364,000 | $172 | 69 |
| 123 Good Hope Ln | 0.60mi | 4/2.5 | 2,240 (+3%) | 2mo | $380,000 | $170 | 65 |
| 420 Forecastle St | 0.53mi | 5/2.5 (+1) | 2,203 (+1%) | 4mo | $356,000 | $162 | 65 |
| 203 Woodstock St | 0.66mi | 4/3.0 | 2,100 (-3%) | 2mo | $355,000 | $169 | 60 |
| 3405 Woodstock St | 0.61mi | 5/3.0 (+1) | 2,247 (+4%) | 0mo | $398,900 | $178 | 59 |
| 115 Wall St | 0.63mi | 4/2.5 | 2,000 (-8%) | 3mo | $349,900 | $175 | 55 |
| 120 Truxton Ave | 0.65mi | 4/2.5 | 1,983 (-9%) | 1mo | $350,000 | $177 | 55 |
| 209 Truxton Ave | 0.61mi | 4/2.5 | 2,462 (+13%) | 2mo | $337,000 | $137 | 48 |
Match score weights: distance 35% · size 25% · config 20% · recency 20%. Top-matched comps best support the ARV.
Projected returns pro-forma
10.0% appreciation · 3.97% rent growth · sell at horizon
- IRR
- 20.1%
- Equity multiple
- 2.63×
- Total profit
- $169,248
- Equity at exit
- $333,235
- IRR
- 18.5%
- Equity multiple
- 6.12×
- Total profit
- $530,607
- Equity at exit
- $718,634
Cash invested: $103,572 (down + closing). Projections, not guarantees.
Landlord ↔ Tenant lean methodology
- Overall (STATE)
- 55 Moderately Landlord-Leaning
- State Virginia
- 55 Moderately Landlord-Leaning · D+2
- County
- — inherits STATE
- City
- — inherits STATE
ZIP-level market 23702
- Home prices YoY
- 5.2%
- Rents YoY
- 4.0%
- Active inventory
- 65
- Price-to-rent
- 12.7×
Monthly cashflow live
- Estimated rent
- $2,428 high interval (Pro) →
- Mortgage (P&I)
- −$1,940
- Tax from tax record
- −$367 /mo · $4,402/yr
- Insurance
- −$154
- HOA
- −$0
- Vacancy / Maint / Mgmt
- −$510
- Net cashflow
- $-543
Break-even live
Sensitivity live
| Price | -10% $-334 | -5% $-438 | +0% $-543 | +5% $-648 | +10% $-752 |
|---|---|---|---|---|---|
| Rent | -10% $-735 | -5% $-639 | +0% $-543 | +5% $-447 | +10% $-351 |
| Rate | -1.0pp $-357 | -0.5pp $-449 | base $-543 | +0.5pp $-639 | +1.0pp $-736 |
UW: 25.0% down · 7.5% · 30yr · 1.5% tax · 5.0% vac · 8.0% maint · 8.0% mgmt
Financing live
Cash to close
- Down payment
- $92,475
- Closing costs
- $11,097
- Reserves months
- —
- Total cash needed
- —
Loan-product check · same deal, 3 products live
Conventional
25% down · 7.5% · 30yr
- Down + closing
- —
- Monthly P&I
- —
- Monthly cashflow
- —
- DSCR
- —
- Eligible?
- —
Personal DTI + credit; lowest rate.
DSCR
20% down · 8.5% · 30yr
- Down + closing
- —
- Monthly P&I
- —
- Monthly cashflow
- —
- DSCR
- —
- Eligible?
- —
No personal income docs; deal must DSCR.
Hard money
10% down · 12.0% · 12mo
- Down + closing
- —
- Monthly P&I
- —
- Monthly cashflow
- —
- DSCR
- —
- Eligible?
- —
Short-term bridge; refi at stabilization.
Rent comps 15 comps
| Address | Beds | Baths | Sqft | Rent | $/sqft | DOM | Units | Dist |
|---|---|---|---|---|---|---|---|---|
| 35 Fairview Cir S Portsmouth, VA | 4.0 | 1.5 | 1462 | $2,100 | $1.44 | 14d | 1 | 0.22mi |
| 134 Monmouth St Portsmouth, VA | 3.0 | 2.5 | 1440 | $2,450 | $1.70 | 45d | 1 | 0.56mi |
| 213 Monmouth St Portsmouth, VA | 3.0 | 2.5 | 1800 | $2,450 | $1.36 | 46d | 1 | 0.64mi |
| 10 Parkside Pl Portsmouth, VA | 3.0 | 2.0 | 1800 | $2,095 | $1.16 | 19d | 1 | 0.71mi |
| 207 Falcon Ave Portsmouth, VA | 3.0 | 2.5 | 1720 | $3,000 | $1.74 | 45d | 1 | 0.85mi |
| 528 Normandy St Portsmouth, VA | 3.0 | 2.5 | 2262 | $2,800 | $1.24 | 25d | 1 | 0.85mi |
| 2509 Smithfield Rd Portsmouth, VA | 3.0 | 2.5 | 1540 | $2,345 | $1.52 | 23d | 1 | 0.93mi |
| 22 Radford St Portsmouth, VA | 4.0 | 3.0 | 1651 | $2,550 | $1.54 | 5d | 1 | 0.95mi |
| 1409 Wilcox Ave Portsmouth, VA | 3.0 | 2.5 | 1800 | $2,500 | $1.39 | 45d | 1 | 1.19mi |
| 108 Marcy St Portsmouth, VA | 4.0 | 2.5 | 2100 | $2,500 | $1.19 | 45d | 1 | 1.20mi |
| 2117 Battery Park Rd Chesapeake, VA | 5.0 | 3.0 | 2500 | $3,500 | $1.40 | 25d | 1 | 1.38mi |
| 203 Median Cir Portsmouth, VA | 4.0 | 2.5 | 2200 | $2,195 | $1.00 | 25d | 1 | 1.42mi |
| 3401 Brighton St Portsmouth, VA | 3.0 | 2.5 | 1439 | $2,195 | $1.53 | 5d | 1 | 1.42mi |
| 2215 Atlanta Ave Portsmouth, VA | 4.0 | 1.0 | 1628 | $2,150 | $1.32 | 9d | 1 | 1.46mi |
| 521 Weaver Cir Portsmouth, VA | 4.0 | 2.0 | 1890 | $2,125 | $1.12 | 45d | 1 | 1.46mi |
Listing history 14 events
-
2026-05-18status Under Contract
-
2026-05-11historical Active Under Contract
-
2026-05-08$369,900 Active
-
2021-03-05soldstatus $290,000
-
2021-03-05soldstatus $290,000
-
2021-01-26status Under Contract
-
2021-01-18historical Active Under Contract
-
2021-01-14$285,000 Active
-
2017-06-19status Under Contract
-
2017-05-04$235,000 Active
-
2017-02-23price $28,000
-
2017-02-20status Under Contract
-
2016-09-29$65,000 Active
-
2004-02-13soldstatus $64,000
ⓘ Source: listings_history table (triggers on properties + properties_extension) + one-shot
backfill from property_details.listing_events for pre-trigger history.
Tax reassessment forecast VA · Resets to sale price
- Current annual tax
- $4,402 · $367/mo
- Projected year-2 tax
- $4,402 · $367/mo
- Expected delta
- $0/yr ($0/mo · 0.0%)
ⓘ Screening estimate from a state-policy table — verify with the county assessor before closing.
Climate risk First Street
- Flood 3/10 Moderate FEMA zone X (unshaded) · 9% chance over 30 yrs
- Wildfire 1/10 Low
- Heat 9/10 Extreme 7 d/yr ≥106°F today · 16 d/yr by 30 yrs out
- Wind 8/10 Severe 80% chance of damaging wind over 30 yrs
- Air quality 5/10 Major 6 unhealthy d/yr today · 7 by 30 yrs out
Nearby sold comps map
Loading sold comps map…
Walkable amenities ~0.75 mi
Loading nearby amenities…
Taxation est. · year 1
- Rental income
- $29,131
- − Mortgage interest
- −$20,720
- − Property taxes
- −$4,402
- − Insurance
- −$1,850
- − Repairs & maintenance
- −$2,330
- − Management
- −$2,330
- − Depreciation
- −$10,761
- Taxable loss
- −$13,262
- Est. tax savings @ 24.0%
- +$3,183
- After-tax cash flow
- $-3,332/yr
For passive investors: Depreciation is non-cash, so a rental often shows a tax loss while cash-flowing — sheltering income. Rental losses are passive: they offset passive income freely, and up to $25,000/yr can offset ordinary (W-2) income if you actively participate and your MAGI is under $100k (phasing out to $0 by $150k); unused losses carry forward. On sale, claimed depreciation is recaptured at up to 25%, and gains may owe capital-gains tax (a 1031 exchange can defer both). Figures are a year-1 estimate at your 24.0% rate — not tax advice; consult a CPA.
Schools (NCES district)
- District
- Portsmouth City Public School District
- NCES district ID
- 5103000
- Math proficiency
- 34% ▼ -40.00%
- Reading proficiency
- 58% ▼ -12.00%
- Median HH income
- $46,152
- Composite
- 39.01/100
- National rank
- #4071
- State rank
- #107 of 131 in VA
Livability — Portsmouth
- Score
- 73/100
- State rank
- #172
- US rank
- #5381
Category grades
Schools grade is shown separately in the Schools card above.
Census & demographics
- Census place
- Portsmouth, VA
- County
- Portsmouth City · 96,366 people
- City population
- 96,366
- Metro
- Virginia Beach-Norfolk-Newport News, VA-NC
- Population (ZIP)
- 12,485
- Household income
- $48,835
- Rent vs Own
- Severe rent burden
- 534.0
Population outlook (Portsmouth County) Hauer SSP2
- Today (2025)
- 96,730 people
- By 2030
- 96,760 · +0.0%
- By 2040
- 96,573 · -0.2%
- By 2050
- 95,606 · -1.2%
- By 2075
- 93,579 · -3.3%
- By 2100
- 83,756 · -13.4%
Race, ethnicity, and origin ACS 2023
- Neighborhood character
- Diverse neighborhood (Simpson 0.62)
- Race & ethnicity
- Black 50% White 35% Two or more races 9% Hispanic / Latino 8%
- Hispanic origin (detail)
- Mexican 2% Puerto Rican 3%
- Common ancestry
- Lithuanian 1% Italian 1% Slovak 1%
- Foreign-born
- 4% · Canada, South Korea
- Languages at home
- 95% English-only · Spanish 4%
Political lean MEDSL · Portsmouth
- 2024 margin
- Solid D (+38.6) · D 68.6% · R 30.0% · Other 1.4%
- 2008→2024 swing
- -0.7pp no change · 2008: 39.3pp · 2024: 38.6pp
- All cycles
- 2024: D+38.6 2020: D+40.8 2016: D+36.5 2012: D+39.6 2008: D+39.3
Not yet ingested
- Civics
- —
Market trends
- HPI YoY
- ▲ 16.70%
- Current HPI
- 340.0817
- Rent YoY
- ▲ 3.97%
- Metro
- Virginia Beach-Norfolk-Newport News, VA-NC
- State GDP YoY
- ▲ 2.40%
- F500 in state
- 50
Industry mix (Fortune 500 HQ in VA)
| Industry | F500 HQs | Revenue |
|---|---|---|
| Aerospace / Defense | 4 | $236B |
|
||
| Technology / Defense | 3 | $32B |
|
||
| Financial Services | 2 | $176B |
|
||
| Utilities | 2 | $27B |
|
||
| Insurance | 2 | $25B |
|
||
| Technology | 2 | $15B |
|
||
Price history
+478.0% since first listed14 events — show timeline
- 2026-05-18 Pending — REINMLS
- 2026-05-11 Contingent — REINMLS
- 2026-05-08 Listed $369,900 REINMLS
- 2021-03-05 Sold (Public Records) $290,000 Public Records
- 2021-03-05 Sold (Public Records) $290,000 Public Records
- 2021-01-26 Pending — REINMLS
- 2021-01-18 Contingent — REINMLS
- 2021-01-14 Listed $285,000 REINMLS
- 2017-06-19 Pending — REINMLS
- 2017-05-04 Listed $235,000 REINMLS
- 2017-02-23 Price Changed $28,000 REINMLS
- 2017-02-20 Pending — REINMLS
- 2016-09-29 Listed $65,000 REINMLS
- 2004-02-13 Sold (Public Records) $64,000 Public Records
Property tax history
+10.0%/yrLatest (2025): $4,402 · +3.3% YoY. Source: county tax records.
Cash-flow waterfall
monthlySold comps — $/sqft
last 12 mo · ≤1 miLoading sold comps…