 🏗️ New Construction
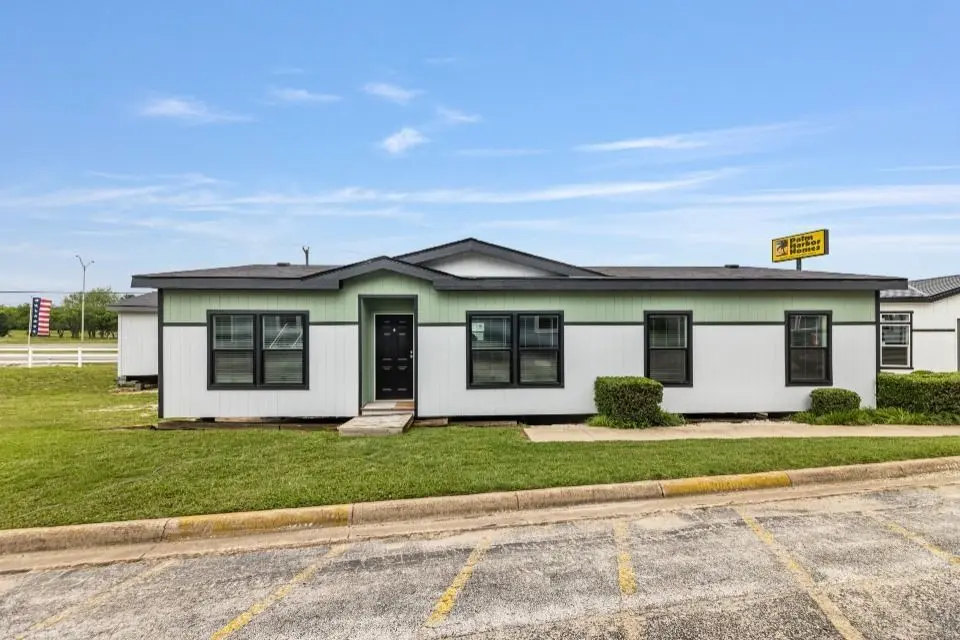
The Homeland 52 Plan · Crosby, TX
Flood risk 1/10 · Minimal
- FEMA flood zone
- X (unshaded)
- Chance of flooding over 30 yrs
- 0.0%
- Est. flood insurance / yr
- $507 – $1,088
Fire risk 4/10 · Minor
- Est. fire insurance / yr
- $1,222 – $2,270
Heat risk 9/10 · Severe
- Hot days now (above 110°F)
- 7 days/yr
- Hot days in 30 yrs
- 22 days/yr
Wind risk 9/10 · Severe
- Chance of severe wind over 30 yrs
- 99.0%
Air-quality risk 2/10 · Minimal
- Unhealthy air days now
- 1 days/yr
- Unhealthy air days in 30 yrs
- 2 days/yr
Risk factors via First Street. Map © Google.
Why this score? — see what drove the B grade
The composite is a weighted blend of 9 inputs, each scored 0–100. Each bar is that input's sub-score; the figure is the points it added to the 100-point composite (weight × sub-score).
- Cash flow +30.0/30.0
- 1% rule +10.0/10.0
- DSCR +10.0/10.0
- ARV discount +7.5/15.0
- Condition / age +4.0/5.0
- Schools +3.5/10.0
- Livability +3.0/5.0
- Rent growth +2.9/5.0
- Appreciation +0.0/10.0
$130,558
🖨 Deal sheet 📄 Offer letter ✓ Due diligence
Listing remarks MLS
Step inside the Homeland52 and discover a home built for comfort, connection, and everyday luxury. With 4 spacious bedrooms and 2 full bathrooms, this open-concept floor plan creates a seamless flow from the welcoming living area to the thoughtfully designed kitchen and dining space. Whether you're entertaining guests or enjoying a quiet night in, the large living room offers plenty of natural light and space to relax, while the chef-inspired kitchen features a center island, stainless steel appliances, and a full pantry for extra storage. The primary suite is a true retreat-boasting a walk-in closet and a luxurious ensuite bath with double sinks, a built-in linen cabinet, and a walk-in shower. Secondary bedrooms are well-sized and perfect for guests, or even a home office. Throughout the home, you'll find upgraded finishes, durable flooring, and energy-efficient features that ensure lasting quality and value. Outside, the Homeland's classic exterior design is accented with clean lines and fresh curb appeal. Ideal for first-time buyers or anyone seeking low-maintenance living without sacrificing style or space, this home offers both comfort and affordability in one smart package.
Key facts
- Walk-in closet
- Full pantry
- Center island
Tags
Neighborhood map
What this means for you Summary
Snapshot
- This is a 4-bed/2.0-bath manufactured listed at $131k. Condition is rated good.
Deal economics
- At list price, monthly cash flow is $793 ($10k/yr) — positive.
- The deal already cash-flows at list — no discount required.
- Meets the 1% rule at list price ($2k rent vs $131k).
- Recommended offer: $115k (12.0% below list) — sets the bar for market timing.
- Cap rate 13.2% vs local median 4.8% in Crosby — top-decile yield for the area; either an underpriced asset or a hidden risk that comps aren't pricing in. Stress-test before assuming the spread holds.
Location & tenants
- Location reads 59/100 on livability (#1,121 in TX) — a working-class tenant base; expect higher turnover. Strengths: cost of living A+, crime A, housing A; Watch: schools D, amenities F, commute F.
- Crosby ISD (rural): math 39% / reading 40% proficiency, ranked #369 of 826 in TX (top 45%) — families likely to look elsewhere, expect single-tenant / working-renter base with shorter leases.
- Market conditions: Rents rising (+1.5%/yr); 1172 active listings in the ZIP; solid renter incomes; 29,883 units permitted in Harris County in 2024 (8,621 in 5+ unit buildings).
Forward outlook
- Local home prices are declining (-3.0%/yr); year-one equity from $947 of loan paydown is wiped out by about $4k of value loss. Plan a longer hold.
- Harris County population projected at +47% by 2050 — long-run rental-demand tailwind backs the buy-and-hold thesis.
- At projected returns (-3.0% appreciation + 1.5% rent growth), your $38k cash investment doubles in ~6 years — after that, you're playing with house money.
Negotiation context
- It's been on market 267 days — a 12% lower offer ($115k) is reasonable based on typical stale-listing flexibility.
Risks & watch-outs
- Climate carrying-cost: severe wind risk, 99% chance of damaging wind over 30y; extreme-heat days projected 7→22/yr by 2055 (HVAC capex compounding) — expect insurance premiums to compound above CPI over the hold.
Questions for the listing agent
- It's been on market 267 days. Have you received any prior offers? Is the seller open to a 12% concession, seller financing, or rate buy-down credit?
- Why hasn't it sold? Are there any deal-killer items the seller is aware of (foundation, flood, title, zoning, code violations)?
- Is there a deadline driving the sale (1031 exchange, divorce, estate, relocation)? That informs how much negotiation room exists.
- Schools are D-rated, which usually means shorter tenancies and higher turnover. Who's the typical renter profile here, and what's been the actual vacancy rate?
- What's the average days-on-market for RENTAL listings here right now (not sales)? A rising rental-DOM trend means longer vacancies and softer asking-rent achievability than the comps imply.
- What's the recent tenant-quality profile in this submarket — average credit score on applications, eviction rate, late-payment / NSF rate, and stable-employment percentage? A property-management company in the area should have these aggregated.
- How much new for-sale + rental construction is in the pipeline within 1–3 miles? Heavy new supply typically softens prices + rents 12–24 months out; constrained supply supports both.
Investment metrics
- 1% rule
- 1.61% ✓
- Cap rate
- 13.24%
- Cash-on-cash
- 24.80%
- DSCR
- 2.10
- GRM
- 5.2
CMA / ARV
- ARV (median comp)
- $136,956
- List price
- $130,558
- Delta
- -4.67%
- Verdict
- FAIR
- Comps
- 1 within 2.0 mi
Projected returns pro-forma
-3.0% appreciation · 1.48% rent growth · sell at horizon
- IRR
- 16.5%
- Equity multiple
- 1.65×
- Total profit
- $25,003
- Equity at exit
- $20,421
- IRR
- 23.9%
- Equity multiple
- 2.92×
- Total profit
- $73,707
- Equity at exit
- $11,841
Cash invested: $38,348 (down + closing). Projections, not guarantees.
Landlord ↔ Tenant lean methodology
- Overall (STATE)
- 87 Strongly Landlord-Friendly
- State Texas
- 87 Strongly Landlord-Friendly · R+5
- County
- — inherits STATE
- City
- — inherits STATE
ZIP-level market 77532
- Home prices YoY
- -28.6%
- Rents YoY
- 1.5%
- Active inventory
- 1172
- Price-to-rent
- 4.9×
Monthly cashflow live
- Estimated rent
- $2,201 medium interval (Pro) →
- Mortgage (P&I)
- −$718
- Tax est. 1.5%
- −$171 /mo · $2,054/yr
- Insurance
- −$57
- HOA
- −$0
- Vacancy / Maint / Mgmt
- −$462
- Net cashflow
- $793
Break-even live
UW: 25.0% down · 7.5% · 30yr · 1.5% tax · 5.0% vac · 8.0% maint · 8.0% mgmt
Financing live
Cash to close
- Down payment
- $34,239
- Closing costs
- $4,109
- Reserves months
- —
- Total cash needed
- —
Loan-product check · same deal, 3 products live
Conventional
25% down · 7.5% · 30yr
- Down + closing
- —
- Monthly P&I
- —
- Monthly cashflow
- —
- DSCR
- —
- Eligible?
- —
Personal DTI + credit; lowest rate.
DSCR
20% down · 8.5% · 30yr
- Down + closing
- —
- Monthly P&I
- —
- Monthly cashflow
- —
- DSCR
- —
- Eligible?
- —
No personal income docs; deal must DSCR.
Hard money
10% down · 12.0% · 12mo
- Down + closing
- —
- Monthly P&I
- —
- Monthly cashflow
- —
- DSCR
- —
- Eligible?
- —
Short-term bridge; refi at stabilization.
Listing history 13 events
-
2026-06-18days on market $130,558 Active 267 DOM
-
2026-06-17days on market $130,558 Active 266 DOM
-
2026-06-16days on market $130,558 Active 265 DOM
-
2026-06-15days on market $130,558 Active 264 DOM
-
2026-06-13days on market $130,558 Active 262 DOM
-
2026-06-09days on market $130,558 Active 258 DOM
-
2026-06-08days on market $130,558 Active 257 DOM
-
2026-06-07days on market $130,558 Active 256 DOM
-
2026-06-04days on market $130,558 Active 253 DOM
-
2026-06-02days on market $130,558 Active 251 DOM
-
2026-06-01days on market $130,558 Active 250 DOM
-
2026-05-31days on market $130,558 Active 249 DOM
-
2025-09-25$130,558 Active 1198-char remark
Show marketing remark (1198 chars)
Step inside the Homeland52 and discover a home built for comfort, connection, and everyday luxury. With 4 spacious bedrooms and 2 full bathrooms, this open-concept floor plan creates a seamless flow from the welcoming living area to the thoughtfully designed kitchen and dining space. Whether you're entertaining guests or enjoying a quiet night in, the large living room offers plenty of natural light and space to relax, while the chef-inspired kitchen features a center island, stainless steel appliances, and a full pantry for extra storage. The primary suite is a true retreat-boasting a walk-in closet and a luxurious ensuite bath with double sinks, a built-in linen cabinet, and a walk-in shower. Secondary bedrooms are well-sized and perfect for guests, or even a home office. Throughout the home, you'll find upgraded finishes, durable flooring, and energy-efficient features that ensure lasting quality and value. Outside, the Homeland's classic exterior design is accented with clean lines and fresh curb appeal. Ideal for first-time buyers or anyone seeking low-maintenance living without sacrificing style or space, this home offers both comfort and affordability in one smart package.
ⓘ Source: listings_history table (triggers on properties + properties_extension) + one-shot
backfill from property_details.listing_events for pre-trigger history.
Climate risk First Street
- Flood 1/10 Low FEMA zone X (unshaded) · 0% chance over 30 yrs
- Wildfire 4/10 Moderate
- Heat 9/10 Extreme 7 d/yr ≥110°F today · 22 d/yr by 30 yrs out
- Wind 9/10 Extreme 99% chance of damaging wind over 30 yrs
- Air quality 2/10 Low 1 unhealthy d/yr today · 2 by 30 yrs out
Nearby sold comps map
Loading sold comps map…
Walkable amenities ~0.75 mi
Loading nearby amenities…
Taxation est. · year 1
- Rental income
- $26,416
- − Mortgage interest
- −$7,672
- − Property taxes
- −$2,054
- − Insurance
- −$685
- − Repairs & maintenance
- −$2,113
- − Management
- −$2,113
- − Depreciation
- −$3,984
- Taxable income
- $7,794
- Est. tax owed @ 24.0%
- −$1,871
- After-tax cash flow
- $7,640/yr
For passive investors: Depreciation is non-cash, so a rental often shows a tax loss while cash-flowing — sheltering income. Rental losses are passive: they offset passive income freely, and up to $25,000/yr can offset ordinary (W-2) income if you actively participate and your MAGI is under $100k (phasing out to $0 by $150k); unused losses carry forward. On sale, claimed depreciation is recaptured at up to 25%, and gains may owe capital-gains tax (a 1031 exchange can defer both). Figures are a year-1 estimate at your 24.0% rate — not tax advice; consult a CPA.
Condition & rehab AI · 6 photos
This manufactured home is in good condition with a good condition score of 80. It has a modern kitchen, two full bathrooms, and a well-maintained exterior. The home is ready for a cosmetic upgrade to enhance its curb appeal and interior aesthetics.
Value-add opportunities
- Both Painting the exterior and interior walls — Fresh paint can enhance curb appeal and interior aesthetics.
- Both Updating the flooring in the bathrooms — Modern flooring can improve both resale and rental value.
- Both Upgrading the kitchen appliances — Newer appliances can attract more buyers and renters.
- Both Adding smart home features — Smart home features can increase both resale and rental value by making the home more convenient and energy-efficient.
Renovation cost estimate screening
Value-add ROI direction
- Both Painting the exterior and interior walls — Fresh paint can enhance curb appeal and interior aesthetics. ↑
- Both Updating the flooring in the bathrooms — Modern flooring can improve both resale and rental value. ↑
- Both Upgrading the kitchen appliances — Newer appliances can attract more buyers and renters. ↑
- Both Adding smart home features — Smart home features can increase both resale and rental value by making the home more convenient and energy-efficient. ↑
ⓘ Cost ranges are severity-bucket heuristics (US national rule-of-thumb). Get contractor quotes + a written scope before underwriting a rehab budget.
Schools (NCES district)
- District
- Crosby ISD
- NCES district ID
- 4815750
- Math proficiency
- 39% ▼ -13.00%
- Reading proficiency
- 40% ▼ -5.00%
- Median HH income
- $61,079
- Composite
- 35.14/100
- National rank
- #5012
- State rank
- #369 of 826 in TX
Livability — Crosby
- Score
- 59/100
- State rank
- #1121
- US rank
- #19783
Category grades
Schools grade is shown separately in the Schools card above.
Census & demographics
- County
- Harris County · 4,702,590 people
- City population
- 33,780
- Metro
- Houston-The Woodlands-Sugar Land, TX
- Population (ZIP)
- 33,780
- Household income
- $92,201
- Rent vs Own
- Severe rent burden
- 382.0
Population outlook (Harris County) Hauer SSP2
- Today (2025)
- 5,571,493 people
- By 2030
- 6,089,821 · +9.3%
- By 2040
- 7,142,806 · +28.2%
- By 2050
- 8,185,864 · +46.9%
- By 2075
- 10,574,329 · +89.8%
- By 2100
- 12,109,958 · +117.4%
Race, ethnicity, and origin ACS 2023
- Neighborhood character
- Diverse neighborhood (Simpson 0.60)
- Race & ethnicity
- White 54% Hispanic / Latino 31% Two or more races 16% Black 9%
- Hispanic origin (detail)
- Mexican 24%
- Common ancestry
- Lithuanian 4% Romanian 3% Italian 2%
- Foreign-born
- 10% · Canada
- Languages at home
- 78% English-only · Spanish 21%
Political lean MEDSL · Harris
- 2024 margin
- Lean D (+5.5) · D 52.0% · R 46.4% · Other 1.6%
- 2008→2024 swing
- +3.9pp toward D · 2008: 1.6pp · 2024: 5.5pp
- All cycles
- 2024: D+5.5 2020: D+13.3 2016: D+12.4 2012: D+0.1 2008: D+1.6
Not yet ingested
- Civics
- —
Market trends
- HPI YoY
- ▼ -105.63%
- Current HPI
- 264.0126
- Rent YoY
- ▲ 1.48%
- Metro
- Houston-The Woodlands-Sugar Land, TX
- State GDP YoY
- ▲ 3.95%
- F500 in state
- 110
Industry mix (Fortune 500 HQ in TX)
| Industry | F500 HQs | Revenue |
|---|---|---|
| Energy | 16 | $1,198B |
|
||
| Technology | 5 | $198B |
|
||
| Engineering / Construction | 4 | $72B |
|
||
| Energy Services | 3 | $60B |
|
||
| Utilities | 3 | $41B |
|
||
| Healthcare | 2 | $330B |
|
||
Price history
1 event — show timeline
- 2025-09-25 Listed $130,558 Zillow
Cash-flow waterfall
monthlySold comps — $/sqft
last 12 mo · ≤1 miLoading sold comps…