676 Dale Dr · Slidell, LA
Flood risk 6/10 · Moderate
- FEMA flood zone
- —
- Chance of flooding over 30 yrs
- 0.58%
- Est. flood insurance / yr
- —
Fire risk 4/10 · Minor
- Est. fire insurance / yr
- $1,269 – $2,357
Heat risk 10/10 · Severe
- Hot days now (above 108°F)
- 7 days/yr
- Hot days in 30 yrs
- 21 days/yr
Wind risk 9/10 · Severe
- Chance of severe wind over 30 yrs
- 99.0%
Air-quality risk 2/10 · Minimal
- Unhealthy air days now
- 1 days/yr
- Unhealthy air days in 30 yrs
- 2 days/yr
Risk factors via First Street. Map © Google.
Why this score? — see what drove the C- grade
The composite is a weighted blend of 9 inputs, each scored 0–100. Each bar is that input's sub-score; the figure is the points it added to the 100-point composite (weight × sub-score).
- Cash flow +19.0/30.0
- ARV discount +9.3/15.0
- DSCR +6.0/10.0
- 1% rule +4.5/10.0
- Schools +4.3/10.0
- Livability +3.5/5.0
- Rent growth +2.9/5.0
- Condition / age +2.5/5.0
- Appreciation +0.0/10.0
$199,900
🖨 Deal sheet 📄 Offer letter ✓ Due diligence
Listing remarks MLS
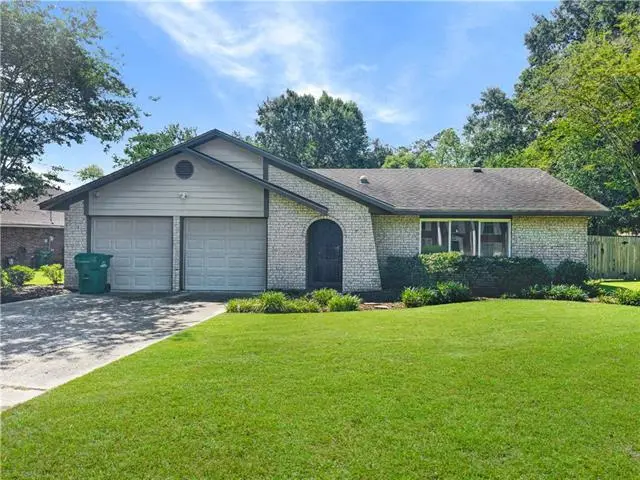
Step inside to this 4 bed/2 bath well maintained home situated on an oversized lot right in the heart of Slidell! It is within walking distance to Slidell High School and competitively priced to sell. Freshly painted and containing no carpet, this house is ready for its next owner(s)! This home features an oversized dining room, stainless steel appliances in the kitchen, updated vanities in the bathrooms, all new copper wiring, a large fenced in backyard and a two car garage. Vacant and ready to show, book your private showing today!
Key facts
- Updated vanities
- New copper wiring
- Oversized lot
Tags
Property features AI
Exterior
- Parking: Garage with two parking spaces
- Utilities: Public water; Public sewer
- Home design: Single-story brick home; Shingle roof; Slab foundation; Very good condition
- Construction: Brick construction; Built with a shingle roof; Slab foundation
- Exterior features: Concrete patio/porch; City lot; Rectangular lot; Lot dimensions approximately 95 x 40 x 128 x 45 x 93
Interior
- Bathrooms: 2 full bathrooms
- Heating & cooling: Central heating; Central air conditioning
- Interior features: Stainless steel appliances
Neighborhood map
What this means for you Summary
Snapshot
- This is a 4-bed/2.0-bath single-family listed at $200k.
Deal economics
- At list price, monthly cash flow is $208 ($2k/yr) — positive.
- The deal already cash-flows at list — no discount required.
- To meet the 1% rule (rent ≥ 1% of price), the offer needs to be $189k (5.4% below list).
- Recommended offer: $189k (5.4% below list) — sets the bar for 1% rule.
- Cap rate 7.5% vs local median 5.9% in Slidell — meaningfully above typical; check what's discounted (condition, days-on-market, listing class) to confirm the premium yield is real.
Location & tenants
- Location reads 70/100 on livability (#57 in LA) — a middle-class / working-renter tenant base. Strengths: cost of living A+, housing A+, health & safety A+; Watch: amenities F, commute F.
- St. Tammany Parish (suburban): math 43% / reading 55% proficiency, ranked #11 of 98 in LA (top 11%) — families likely to look elsewhere, expect single-tenant / working-renter base with shorter leases.
- Market conditions: Rents rising (+1.5%/yr); 489 active listings in the ZIP; 21 comparable units currently listed for rent nearby; rentals at typical pace (median 24d on market — plan ~3-4 weeks tenant-placement turnaround); 1,064 units permitted in St. Tammany Parish in 2024 (0 in 5+ unit buildings).
- This rent runs 31% of the median local income ($73k/yr) — at the standard rent-burdened threshold; future hikes will face affordability resistance.
Forward outlook
- Local home prices are declining (-3.0%/yr); year-one equity from $1k of loan paydown is wiped out by about $6k of value loss. Plan a longer hold.
- St. Tammany County population projected at +27% by 2050 — long-run rental-demand tailwind backs the buy-and-hold thesis.
Negotiation context
- Only 9 days on market — expect competitive offers; lowballing is unlikely to land.
- 18 sale attempts since 22y ago with the ask held roughly flat each time — persistent listings suggest the price (not the market) is what's stuck; bring a comps-based counter.
Risks & watch-outs
- Climate carrying-cost: major flood risk; severe wind risk, 99% chance of damaging wind over 30y; extreme-heat days projected 7→21/yr by 2055 (HVAC capex compounding) — expect insurance premiums to compound above CPI over the hold.
Questions for the listing agent
- Built in 1975 — when were the roof, HVAC, electrical panel, plumbing, and water heater last replaced?
- Is there a deadline driving the sale (1031 exchange, divorce, estate, relocation)? That informs how much negotiation room exists.
- Schools are B-rated — typically a magnet for longer-tenancy family renters. What's the average tenant stay here, and is there a school-zone premium baked into asking?
- What's the average days-on-market for RENTAL listings here right now (not sales)? A rising rental-DOM trend means longer vacancies and softer asking-rent achievability than the comps imply.
- What's the recent tenant-quality profile in this submarket — average credit score on applications, eviction rate, late-payment / NSF rate, and stable-employment percentage? A property-management company in the area should have these aggregated.
- How much new for-sale + rental construction is in the pipeline within 1–3 miles? Heavy new supply typically softens prices + rents 12–24 months out; constrained supply supports both.
Investment metrics
- 1% rule
- 0.95% ✗
- Cap rate
- 7.54%
- Cash-on-cash
- 4.46%
- DSCR
- 1.20
- GRM
- 8.8
CMA / ARV
- ARV (on-the-fly)
- $208,012
- Comps found
- 12
Show comp detail 12 sales within ~0.75 mi
| Address | Dist | Beds/Ba | Sqft | Sold | Price | $/sf | Match |
|---|---|---|---|---|---|---|---|
| 620 Dale Dr | 0.20mi | 3/2.0 (-1) | 1,771 (+1%) | 4mo | $190,000 | $107 | 80 |
| 1510 5th St | 0.63mi | 3/2.0 (-1) | 1,753 (+0%) | 1mo | $230,000 | $131 | 64 |
| 611 Dale Dr | 0.25mi | 4/2.0 | 1,573 (-10%) | 10mo | $170,000 | $108 | 64 |
| 626 Florida Ave | 0.52mi | 3/2.0 (-1) | 1,611 (-8%) | 2mo | $220,000 | $137 | 56 |
| 1555 7th St | 0.65mi | 4/2.0 | 1,839 (+5%) | 7mo | $225,000 | $122 | 56 |
| 132 Melody Ln | 0.66mi | 4/2.0 | 1,886 (+8%) | 1mo | $225,000 | $119 | 55 |
| 110 Fountain Dr | 0.60mi | 4/2.5 | 1,898 (+9%) | 1mo | $185,000 | $97 | 55 |
| 106 Matthews Dr | 0.64mi | 4/2.0 | 1,626 (-7%) | 7mo | $210,000 | $129 | 52 |
| 450 N Magnolia St | 0.60mi | 4/2.0 | 1,509 (-14%) | 1mo | $140,000 | $93 | 49 |
| 758 N Magnolia St | 0.49mi | 3/2.0 (-1) | 1,500 (-14%) | 0mo | $45,000 | $30 | 48 |
| 206 Canberra Ct | 0.54mi | 3/2.0 (-1) | 1,500 (-14%) | 1mo | $130,000 | $87 | 45 |
| 121 Matthews Dr | 0.70mi | 3/2.0 (-1) | 1,581 (-10%) | 12mo | $245,000 | $155 | 37 |
Match score weights: distance 35% · size 25% · config 20% · recency 20%. Top-matched comps best support the ARV.
Projected returns pro-forma
-3.0% appreciation · 1.47% rent growth · sell at horizon
- IRR
- -11.0%
- Equity multiple
- 0.61×
- Total profit
- $-22,052
- Equity at exit
- $29,806
- IRR
- -3.9%
- Equity multiple
- 0.76×
- Total profit
- $-13,689
- Equity at exit
- $17,284
Cash invested: $55,972 (down + closing). Projections, not guarantees.
Landlord ↔ Tenant lean methodology
- Overall (STATE)
- 90 Strongly Landlord-Friendly
- State Louisiana
- 90 Strongly Landlord-Friendly · R+12
- County
- — inherits STATE
- City
- — inherits STATE
ZIP-level market 70458
- Rents YoY
- 1.5%
- Active inventory
- 489
- Price-to-rent
- 8.8×
Monthly cashflow live
- Estimated rent
- $1,891 high interval (Pro) →
- Mortgage (P&I)
- −$1,048
- Tax from tax record
- −$155 /mo · $1,855/yr
- Insurance
- −$83
- HOA
- −$0
- Vacancy / Maint / Mgmt
- −$397
- Net cashflow
- $208
Break-even live
UW: 25.0% down · 7.5% · 30yr · 1.5% tax · 5.0% vac · 8.0% maint · 8.0% mgmt
Financing live
Cash to close
- Down payment
- $49,975
- Closing costs
- $5,997
- Reserves months
- —
- Total cash needed
- —
Loan-product check · same deal, 3 products live
Conventional
25% down · 7.5% · 30yr
- Down + closing
- —
- Monthly P&I
- —
- Monthly cashflow
- —
- DSCR
- —
- Eligible?
- —
Personal DTI + credit; lowest rate.
DSCR
20% down · 8.5% · 30yr
- Down + closing
- —
- Monthly P&I
- —
- Monthly cashflow
- —
- DSCR
- —
- Eligible?
- —
No personal income docs; deal must DSCR.
Hard money
10% down · 12.0% · 12mo
- Down + closing
- —
- Monthly P&I
- —
- Monthly cashflow
- —
- DSCR
- —
- Eligible?
- —
Short-term bridge; refi at stabilization.
Rent comps 21 comps
| Address | Beds | Baths | Sqft | Rent | $/sqft | DOM | Units | Dist |
|---|---|---|---|---|---|---|---|---|
| 106 Kempsey Ct Slidell, LA | 3.0 | 2.0 | 1650 | $1,600 | $0.97 | 21d | 1 | 0.48mi |
| 513 Michigan Ave Slidell, LA | 3.0 | 2.0 | 1250 | $1,575 | $1.26 | 23d | 1 | 0.57mi |
| 129 Fountain Dr Slidell, LA | 4.0 | 2.0 | 1879 | $1,850 | $0.98 | 14d | 1 | 0.60mi |
| 1030 Rue Corton Slidell, LA | 4.0 | 2.0 | 1931 | $2,150 | $1.11 | 43d | 1 | 0.63mi |
| 1540 Queens Dr Slidell, LA | 4.0 | 2.0 | 1900 | $2,300 | $1.21 | 17d | 1 | 0.77mi |
| 221 Martin Ln Slidell, LA | 3.0 | 1.5 | 1353 | $1,800 | $1.33 | 23d | 1 | 0.82mi |
| 1466 Florida Ave Slidell, LA | 3.0 | 2.0 | 1456 | $2,200 | $1.51 | 43d | 1 | 0.90mi |
| 2001 Tenth St Unit B Slidell, LA | 3.0 | 2.0 | 1137 | $1,550 | $1.36 | 17d | 1 | 0.95mi |
| 517 Erlanger Ave Unit A Slidell, LA | 3.0 | 2.0 | 1134 | $1,400 | $1.23 | 43d | 1 | 0.97mi |
| 517 Erlanger Ave Unit A Slidell, LA | 3.0 | 2.0 | 1134 | $1,375 | $1.21 | 14d | 1 | 0.97mi |
| 1540 Wildwood Ln Slidell, LA | 3.0 | 2.0 | 1525 | $2,200 | $1.44 | 23d | 1 | 1.02mi |
| 36409 Jackson Rd Slidell, LA | 4.0 | 2.0 | 1670 | $2,100 | $1.26 | 43d | 1 | 1.03mi |
| 1111 Saint Scholastica St Slidell, LA | 3.0 | 2.0 | 2037 | $2,000 | $0.98 | 23d | 1 | 1.11mi |
| 96 Chamale Cv Slidell, LA | 3.0 | 2.5 | 1432 | $1,500 | $1.05 | 43d | 1 | 1.19mi |
| 542 Driftwood Cir Slidell, LA | 4.0 | 2.0 | 1960 | $2,100 | $1.07 | 3d | 1 | 1.30mi |
| 1731 Mary Dr Slidell, LA | 3.0 | 2.0 | 1200 | $1,650 | $1.38 | 3d | 1 | 1.33mi |
| 1733 Mary Dr Slidell, LA | 3.0 | 2.0 | 1349 | $1,650 | $1.22 | 43d | 1 | 1.34mi |
| 347 Oriole Dr Slidell, LA | 4.0 | 1.5 | 1560 | $1,500 | $0.96 | 43d | 1 | 1.34mi |
| 347 Oriole Dr Slidell, LA | 4.0 | 1.5 | 1560 | $1,500 | $0.96 | 23d | 1 | 1.34mi |
| 120 Christian Ln Slidell, LA | 3.0 | 2.0 | 1375 | $1,875 | $1.36 | 3d | 1 | 1.44mi |
| 120 Christian Ln Slidell, LA | 3.0 | 2.0 | 1375 | $1,875 | $1.36 | 2d | 1 | 1.44mi |
Listing history 7 events
-
2026-06-18days on market $199,900 Active 9 DOM
-
2026-06-17days on market $199,900 Active 8 DOM
-
2026-06-16days on market $199,900 Active 7 DOM
-
2026-06-15days on market $199,900 Active 6 DOM
-
2026-06-13days on market $199,900 Active 4 DOM
-
2026-06-10remarks 539-char remark
-
2026-06-10$199,900 Active 1 DOM
ⓘ Source: listings_history table (triggers on properties + properties_extension) + one-shot
backfill from property_details.listing_events for pre-trigger history.
Tax reassessment forecast LA · Resets to sale price
- Current annual tax
- $1,855 · $155/mo
- Projected year-2 tax
- $1,855 · $155/mo
- Expected delta
- $0/yr ($0/mo · 0.0%)
ⓘ Screening estimate from a state-policy table — verify with the county assessor before closing.
Climate risk First Street
- Flood 6/10 Major 58% chance over 30 yrs
- Wildfire 4/10 Moderate
- Heat 10/10 Extreme 7 d/yr ≥108°F today · 21 d/yr by 30 yrs out
- Wind 9/10 Extreme 99% chance of damaging wind over 30 yrs
- Air quality 2/10 Low 1 unhealthy d/yr today · 2 by 30 yrs out
Nearby sold comps map
Loading sold comps map…
Walkable amenities ~0.75 mi
Loading nearby amenities…
Taxation est. · year 1
- Rental income
- $22,694
- − Mortgage interest
- −$11,198
- − Property taxes
- −$1,855
- − Insurance
- −$1,000
- − Repairs & maintenance
- −$1,816
- − Management
- −$1,816
- − Depreciation
- −$5,815
- Taxable loss
- −$804
- Est. tax savings @ 24.0%
- +$193
- After-tax cash flow
- $2,687/yr
For passive investors: Depreciation is non-cash, so a rental often shows a tax loss while cash-flowing — sheltering income. Rental losses are passive: they offset passive income freely, and up to $25,000/yr can offset ordinary (W-2) income if you actively participate and your MAGI is under $100k (phasing out to $0 by $150k); unused losses carry forward. On sale, claimed depreciation is recaptured at up to 25%, and gains may owe capital-gains tax (a 1031 exchange can defer both). Figures are a year-1 estimate at your 24.0% rate — not tax advice; consult a CPA.
Schools (NCES district)
- District
- St. Tammany Parish
- NCES district ID
- 2201650
- Math proficiency
- 43% ▼ -32.00%
- Reading proficiency
- 55% ▼ -26.00%
- Median HH income
- $61,752
- Composite
- 43.04/100
- National rank
- #3098
- State rank
- #11 of 98 in LA
Livability — Slidell
- Score
- 70/100
- State rank
- #57
- US rank
- #7673
Category grades
Schools grade is shown separately in the Schools card above.
Census & demographics
- Census place
- Slidell, LA
- County
- Saint Tammany Parish · 228,296 people
- Metro
- New Orleans-Metairie, LA
- Population (ZIP)
- 39,034
- Household income
- $72,843
- Rent vs Own
- Severe rent burden
- 1331.0
Population outlook (St. Tammany County) Hauer SSP2
- Today (2025)
- 286,725 people
- By 2030
- 304,175 · +6.1%
- By 2040
- 336,203 · +17.3%
- By 2050
- 364,590 · +27.2%
- By 2075
- 433,362 · +51.1%
- By 2100
- 470,333 · +64.0%
Race, ethnicity, and origin ACS 2023
- Neighborhood character
- Predominantly White (66%)
- Race & ethnicity
- White 66% Black 17% Two or more races 10% Hispanic / Latino 9% Native American 2% Asian 1%
- Hispanic origin (detail)
- Mexican 3% Puerto Rican 1%
- Common ancestry
- Lithuanian 15% Slovak 2% Romanian 1%
- Foreign-born
- 3% · Canada, Vietnam
- Languages at home
- 93% English-only · Spanish 5% Vietnamese 1%
Political lean MEDSL · St. Tammany
- 2024 margin
- Solid R (+43.8) · D 27.3% · R 71.1% · Other 1.6%
- 2008→2024 swing
- +9.6pp toward D · 2008: -53.4pp · 2024: -43.8pp
- All cycles
- 2024: R+43.8 2020: R+44.2 2016: R+50.8 2012: R+52.2 2008: R+53.4
Not yet ingested
- Civics
- —
Market trends
- HPI YoY
- ▼ -173.60%
- Current HPI
- 147.4749
- Rent YoY
- ▲ 1.47%
- Metro
- New Orleans-Metairie, LA
- State GDP YoY
- ▲ 3.29%
- F500 in state
- 10
Industry mix (Fortune 500 HQ in LA)
| Industry | F500 HQs | Revenue |
|---|---|---|
| Telecommunications | 2 | $23B |
|
||
| Utilities | 1 | $12B |
|
||
| Wholesale / Distribution | 1 | $5B |
|
||
| Advertising | 1 | $2B |
|
||
Price history
+66.7% since first listed27 events — show timeline
- 2026-06-09 Listed $199,900 GSREIN
- 2026-06-09 Listed $199,900 AcadianaMLS
- 2024-11-10 Listed $225,000 AcadianaMLS
- 2024-01-22 Price Changed $220,000 GSREIN
- 2023-11-28 Listed $220,000 AcadianaMLS
- 2023-04-05 Price Changed $249,000 GSREIN
- 2023-03-17 Listed $249,000 AcadianaMLS
- 2021-11-22 Sold (MLS) $215,000 GSREIN
- 2021-10-08 Pending — GSREIN
- 2021-10-06 Relisted — GSREIN
- 2021-10-04 Pending — GSREIN
- 2021-10-01 Listed $199,900 GSREIN
- 2021-10-01 Listed $199,900 AcadianaMLS
- 2015-04-28 Sold (Public Records) $120,226 Public Records
- 2014-05-01 Sold (MLS) $125,000 GSREIN
- 2014-02-14 Listed $125,000 AcadianaMLS
- 2014-02-14 Listed $125,000 GSREIN
- 2013-07-02 Listed $123,900 GSREIN
- 2013-07-02 Listed $123,900 AcadianaMLS
- 2012-06-05 Listed $132,900 GSREIN
- 2012-06-05 Listed $132,900 AcadianaMLS
- 2009-04-02 Listed $159,900 GSREIN
- 2009-04-02 Listed $159,900 AcadianaMLS
- 2005-06-16 Sold (Public Records) $118,000 Public Records
- 2005-06-13 Sold (MLS) $118,000 GSREIN
- 2004-04-28 Listed $119,900 AcadianaMLS
- 2004-04-28 Listed $119,900 GSREIN
Property tax history
+1.2%/yrLatest (2025): $1,855 · -7.3% YoY. Source: county tax records.
Cash-flow waterfall
monthlySold comps — $/sqft
last 12 mo · ≤1 miLoading sold comps…