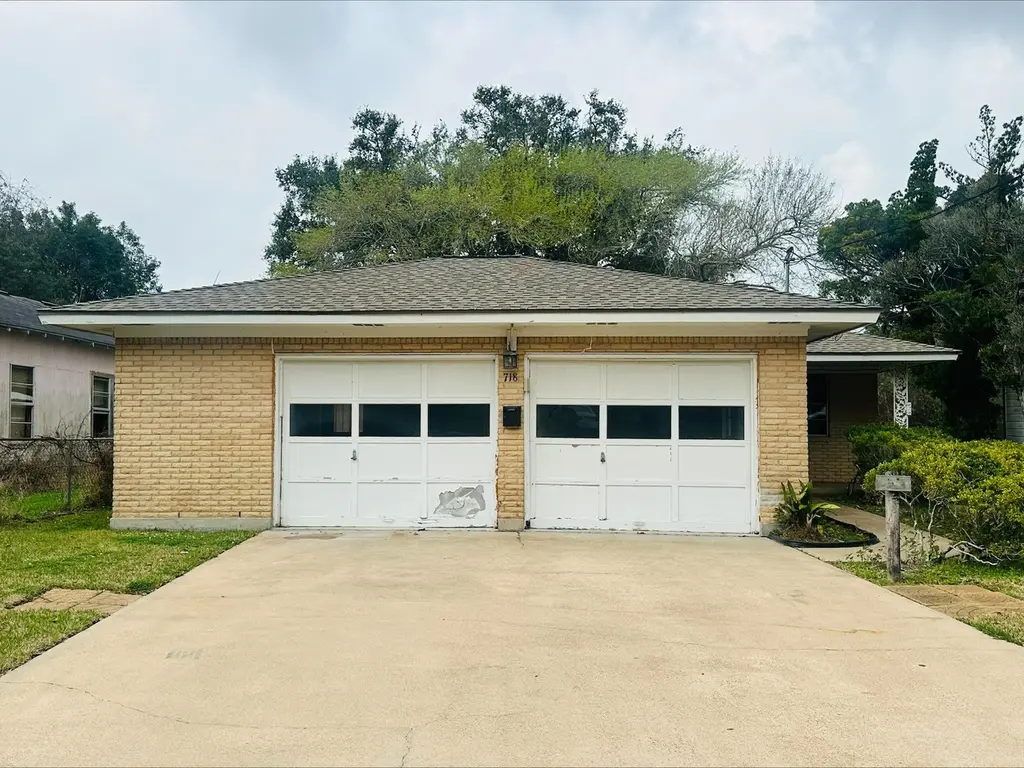
718 Flint St · West Orange, TX
Flood risk 7/10 · Major
- FEMA flood zone
- X (shaded)
- Chance of flooding over 30 yrs
- 0.73%
- Est. flood insurance / yr
- $507 – $1,088
Fire risk 1/10 · Minimal
- Est. fire insurance / yr
- $1,222 – $2,270
Heat risk 9/10 · Severe
- Hot days now (above 109°F)
- 7 days/yr
- Hot days in 30 yrs
- 22 days/yr
Wind risk 9/10 · Severe
- Chance of severe wind over 30 yrs
- 99.0%
Air-quality risk 2/10 · Minimal
- Unhealthy air days now
- 1 days/yr
- Unhealthy air days in 30 yrs
- 1 days/yr
Risk factors via First Street. Map © Google.
Why this score? — see what drove the C grade
The composite is a weighted blend of 9 inputs, each scored 0–100. Each bar is that input's sub-score; the figure is the points it added to the 100-point composite (weight × sub-score).
- Cash flow +19.3/30.0
- ARV discount +9.9/15.0
- DSCR +6.1/10.0
- 1% rule +5.8/10.0
- Appreciation +5.5/10.0
- Rent growth +3.9/5.0
- Livability +3.0/5.0
- Condition / age +2.5/5.0
- Schools +1.6/10.0
$129,900
🖨 Deal sheet 📄 Offer letter ✓ Due diligence
Listing remarks MLS
Well-maintained 3-bedroom, 2-bath home featuring a 2-car garage and a functional layout perfect for everyday living. This home offers both a formal dining room and a breakfast area, providing plenty of space for family meals and entertaining. Conveniently located close to schools, this property is ideal for those seeking a great location with easy access to daily amenities. The large backyard offers ample room for outdoor activities, gardening, or future additions. Property is being sold “As-Is. ” Call today for your personal tour!
Key facts
- Formal dining room
- Large backyard
- Great location
Tags
Neighborhood map
What this means for you Summary
Snapshot
- This is a 3-bed/2.0-bath single-family listed at $130k.
Deal economics
- At list price, monthly cash flow is $77 ($924/yr) — positive.
- The deal already cash-flows at list — no discount required.
- Meets the 1% rule at list price ($1k rent vs $130k).
- Recommended offer: $118k (9.0% below list) — sets the bar for market timing.
Location & tenants
- Location reads 60/100 on livability (#1,075 in TX) — a middle-class / working-renter tenant base. Strengths: cost of living A+, housing A, health & safety A; Watch: crime C-, schools D-, amenities F.
- West Orange-Cove CISD (suburban): math 17% / reading 21% proficiency, ranked #784 of 826 in TX (top 95%) — low school quality limits family demand, transient renter base, plan for 1-2y turnover; 79% free/reduced lunch — lower-income household profile, screen leases tightly.
- Market conditions: Rents rising fast (+5.7%/yr); 337 active listings in the ZIP; 18 comparable units currently listed for rent nearby; rentals lingering (median 44d on market — plan ~5-8 weeks vacancy on turnover, expect pricing pressure); 61% of comp listings sitting > 30 days — soft ceiling on asking rent; 235 units permitted in Orange County in 2024 (50 in 5+ unit buildings).
Forward outlook
- In year one you build about $2k of equity ($898 loan paydown + $1k appreciation (1.0% local appreciation)).
- Orange County population projected at +6% by 2050 — modest demand growth; plan on rents tracking national, not racing it.
- At projected returns (1.0% appreciation + 5.7% rent growth), your $36k cash investment doubles in ~7 years — after that, you're playing with house money.
Negotiation context
- It's been on market 113 days — a 9% lower offer ($118k) is reasonable based on typical stale-listing flexibility.
Risks & watch-outs
- Watch-outs: flood insurance adds $66/mo.
- Climate carrying-cost: major flood risk; severe wind risk, 99% chance of damaging wind over 30y; extreme-heat days projected 7→22/yr by 2055 (HVAC capex compounding) — expect insurance premiums to compound above CPI over the hold.
Questions for the listing agent
- It's been on market 113 days. Have you received any prior offers? Is the seller open to a 9% concession, seller financing, or rate buy-down credit?
- Built in 1962 — when were the roof, HVAC, electrical panel, plumbing, and water heater last replaced?
- What's the actual annual flood-insurance premium (NFIP or private), and is the property in a SFHA with mandatory coverage?
- Why hasn't it sold? Are there any deal-killer items the seller is aware of (foundation, flood, title, zoning, code violations)?
- Is there a deadline driving the sale (1031 exchange, divorce, estate, relocation)? That informs how much negotiation room exists.
- Schools are D-rated, which usually means shorter tenancies and higher turnover. Who's the typical renter profile here, and what's been the actual vacancy rate?
- What's the average days-on-market for RENTAL listings here right now (not sales)? A rising rental-DOM trend means longer vacancies and softer asking-rent achievability than the comps imply.
- What's the recent tenant-quality profile in this submarket — average credit score on applications, eviction rate, late-payment / NSF rate, and stable-employment percentage? A property-management company in the area should have these aggregated.
- How much new for-sale + rental construction is in the pipeline within 1–3 miles? Heavy new supply typically softens prices + rents 12–24 months out; constrained supply supports both.
Investment metrics
- 1% rule
- 1.08% ✓
- Cap rate
- 7.62%
- Cash-on-cash
- 4.73%
- DSCR
- 1.21
- GRM
- 7.7
CMA / ARV
- ARV (median comp)
- $137,376
- List price
- $129,900
- Delta
- -5.44%
- Verdict
- FAIR
- Comps
- 15 within 1.0 mi
Show comp detail 3 sales within ~0.75 mi
| Address | Dist | Beds/Ba | Sqft | Sold | Price | $/sf | Match |
|---|---|---|---|---|---|---|---|
| 714 Sherrill St | 0.30mi | 3/2.0 | 1,504 (-2%) | 9mo | $190,000 | $126 | 75 |
| 1905 Crockett St | 0.27mi | 3/1.0 | 1,572 (+2%) | 14mo | $139,999 | $89 | 68 |
| 1826 Bowie St | 0.34mi | 3/1.5 | 1,434 (-6%) | 19mo | $138,000 | $96 | 56 |
Match score weights: distance 35% · size 25% · config 20% · recency 20%. Top-matched comps best support the ARV.
Projected returns pro-forma
1.01% appreciation · 5.71% rent growth · sell at horizon
- IRR
- 6.1%
- Equity multiple
- 1.31×
- Total profit
- $11,420
- Equity at exit
- $44,413
- IRR
- 12.2%
- Equity multiple
- 2.60×
- Total profit
- $58,150
- Equity at exit
- $59,073
Cash invested: $36,372 (down + closing). Projections, not guarantees.
Landlord ↔ Tenant lean methodology
- Overall (STATE)
- 87 Strongly Landlord-Friendly
- State Texas
- 87 Strongly Landlord-Friendly · R+5
- County
- — inherits STATE
- City
- — inherits STATE
ZIP-level market 77630
- Home prices YoY
- 0.4%
- Rents YoY
- 5.7%
- Active inventory
- 337
- Price-to-rent
- 7.7×
Monthly cashflow live
- Estimated rent
- $1,400 high interval (Pro) →
- Mortgage (P&I)
- −$681
- Tax from tax record
- −$227 /mo · $2,723/yr
- Insurance
- −$54
- Flood insurance flood zone
- −$66 /mo · $798/yr
- HOA
- −$0
- Vacancy / Maint / Mgmt
- −$294
- Net cashflow
- $77
Break-even live
UW: 25.0% down · 7.5% · 30yr · 1.5% tax · 5.0% vac · 8.0% maint · 8.0% mgmt
Financing live
Cash to close
- Down payment
- $32,475
- Closing costs
- $3,897
- Reserves months
- —
- Total cash needed
- —
Loan-product check · same deal, 3 products live
Conventional
25% down · 7.5% · 30yr
- Down + closing
- —
- Monthly P&I
- —
- Monthly cashflow
- —
- DSCR
- —
- Eligible?
- —
Personal DTI + credit; lowest rate.
DSCR
20% down · 8.5% · 30yr
- Down + closing
- —
- Monthly P&I
- —
- Monthly cashflow
- —
- DSCR
- —
- Eligible?
- —
No personal income docs; deal must DSCR.
Hard money
10% down · 12.0% · 12mo
- Down + closing
- —
- Monthly P&I
- —
- Monthly cashflow
- —
- DSCR
- —
- Eligible?
- —
Short-term bridge; refi at stabilization.
Rent comps 18 comps
| Address | Beds | Baths | Sqft | Rent | $/sqft | DOM | Units | Dist |
|---|---|---|---|---|---|---|---|---|
| 406 Dayton St West Orange, TX | 2.0 | 1.0 | 1350 | $1,200 | $0.89 | 44d | 1 | 0.31mi |
| 206 Florence St Orange, TX | 2.0 | 1.0 | 1216 | $1,425 | $1.17 | 44d | 1 | 0.62mi |
| 210 Florence St Orange, TX | 3.0 | 1.0 | 1064 | $1,425 | $1.34 | 44d | 1 | 0.64mi |
| 2602 Tanglewood St West Orange, TX | 4.0 | 2.0 | 1306 | $1,250 | $0.96 | 14d | 1 | 0.66mi |
| 205 Gloria St West Orange, TX | 3.0 | 2.0 | 1225 | $1,300 | $1.06 | 44d | 1 | 0.66mi |
| 2810 Gandy St West Orange, TX | 3.0 | 2.0 | 1613 | $1,700 | $1.05 | 44d | 1 | 0.75mi |
| 309 Quincy St West Orange, TX | 3.0 | 1.5 | 1113 | $1,200 | $1.08 | 14d | 1 | 0.83mi |
| 1543 Alamo St West Orange, TX | 3.0 | 1.0 | 1170 | $1,200 | $1.03 | 14d | 1 | 0.90mi |
| 3000 MacArthur Dr Orange, TX | 3.0 | 1.0–2.0 | 791 | $1,330 | $1.68 | 13d | 12 | 1.11mi |
| 101 Azalea Ave Unit A Orange, TX | 3.0 | 1.0 | 1200 | $2,000 | $1.67 | 44d | 1 | 1.18mi |
| 302 Bridal Wreath Ave Orange, TX | 3.0 | 1.0 | 1182 | $1,195 | $1.01 | 44d | 1 | 1.23mi |
| 1010 N 16th St Orange, TX | 3.0 | 1.5 | 1100 | $1,500 | $1.36 | 44d | 1 | 1.23mi |
| 306 Bridal Wreath Ave Orange, TX | 3.0 | 1.0 | 1529 | $1,195 | $0.78 | 21d | 1 | 1.25mi |
| 1120 28th St Orange, TX | 3.0 | 1.0 | 1308 | $1,500 | $1.15 | 44d | 1 | 1.25mi |
| 403 Bluebonnet Dr Orange, TX | 3.0 | 1.0 | 1196 | $1,300 | $1.09 | 44d | 1 | 1.31mi |
| 1117 18th St Orange, TX | 4.0 | 2.0 | 1716 | $1,500 | $0.87 | 44d | 1 | 1.34mi |
| 107 Dahlia St Orange, TX | 3.0 | 1.0 | 1149 | $1,300 | $1.13 | 14d | 1 | 1.37mi |
| 305 Rhode Island St Orange, TX | 3.0 | 2.0 | 1430 | $1,575 | $1.10 | 13d | 1 | 1.47mi |
Listing history 17 events
-
2026-06-18days on market $129,900 Active 113 DOM
-
2026-06-17days on market $129,900 Active 112 DOM
-
2026-06-16days on market $129,900 Active 111 DOM
-
2026-06-15days on market $129,900 Active 110 DOM
-
2026-06-14days on market $129,900 Active 108 DOM
-
2026-06-13days on market $129,900 Active 107 DOM
-
2026-06-10days on market $129,900 Active 105 DOM
-
2026-06-09days on market $129,900 Active 104 DOM
-
2026-06-08days on market $129,900 Active 103 DOM
-
2026-06-07days on market $129,900 Active 102 DOM
-
2026-06-03days on market $129,900 Active 98 DOM
-
2026-06-02days on market $129,900 Active 97 DOM
-
2026-06-01days on market $129,900 Active 96 DOM
-
2026-05-31days on market $129,900 Active 95 DOM
-
2026-05-30days on market $129,900 Active 94 DOM
-
2026-03-30price $129,900 550-char remark
Show marketing remark (550 chars)
Well-maintained 3-bedroom, 2-bath home featuring a 2-car garage and a functional layout perfect for everyday living. This home offers both a formal dining room and a breakfast area, providing plenty of space for family meals and entertaining. Conveniently located close to schools, this property is ideal for those seeking a great location with easy access to daily amenities. The large backyard offers ample room for outdoor activities, gardening, or future additions. Property is being sold “As-Is. ” Call today for your personal tour!
-
2026-02-25$153,900 Active 550-char remark
Show marketing remark (550 chars)
Well-maintained 3-bedroom, 2-bath home featuring a 2-car garage and a functional layout perfect for everyday living. This home offers both a formal dining room and a breakfast area, providing plenty of space for family meals and entertaining. Conveniently located close to schools, this property is ideal for those seeking a great location with easy access to daily amenities. The large backyard offers ample room for outdoor activities, gardening, or future additions. Property is being sold “As-Is. ” Call today for your personal tour!
ⓘ Source: listings_history table (triggers on properties + properties_extension) + one-shot
backfill from property_details.listing_events for pre-trigger history.
Tax reassessment forecast TX · Resets to sale price
- Current annual tax
- $2,723 · $227/mo
- Projected year-2 tax
- $2,723 · $227/mo
- Expected delta
- $0/yr ($0/mo · 0.0%)
ⓘ Screening estimate from a state-policy table — verify with the county assessor before closing.
Climate risk First Street
- Flood 7/10 Severe FEMA zone X (shaded) · 73% chance over 30 yrs
- Wildfire 1/10 Low
- Heat 9/10 Extreme 7 d/yr ≥109°F today · 22 d/yr by 30 yrs out
- Wind 9/10 Extreme 99% chance of damaging wind over 30 yrs
- Air quality 2/10 Low 1 unhealthy d/yr today · 1 by 30 yrs out
Nearby sold comps map
Loading sold comps map…
Walkable amenities ~0.75 mi
Loading nearby amenities…
Taxation est. · year 1
- Rental income
- $16,796
- − Mortgage interest
- −$7,276
- − Property taxes
- −$2,723
- − Insurance
- −$1,447
- − Repairs & maintenance
- −$1,344
- − Management
- −$1,344
- − Depreciation
- −$3,779
- Taxable loss
- −$1,117
- Est. tax savings @ 24.0%
- +$268
- After-tax cash flow
- $1,192/yr
For passive investors: Depreciation is non-cash, so a rental often shows a tax loss while cash-flowing — sheltering income. Rental losses are passive: they offset passive income freely, and up to $25,000/yr can offset ordinary (W-2) income if you actively participate and your MAGI is under $100k (phasing out to $0 by $150k); unused losses carry forward. On sale, claimed depreciation is recaptured at up to 25%, and gains may owe capital-gains tax (a 1031 exchange can defer both). Figures are a year-1 estimate at your 24.0% rate — not tax advice; consult a CPA.
Schools (NCES district)
- District
- West Orange-Cove CISD
- NCES district ID
- 4845090
- Math proficiency
- 17% ▼ -7.00%
- Reading proficiency
- 21% ▼ -2.00%
- Median HH income
- $37,329
- Composite
- 15.86/100
- National rank
- #9260
- State rank
- #784 of 826 in TX
Livability — West Orange
- Score
- 60/100
- State rank
- #1075
- US rank
- #19069
Category grades
Schools grade is shown separately in the Schools card above.
Census & demographics
- Census place
- West Orange, TX
- County
- Orange County · 87,112 people
- Metro
- Beaumont-Port Arthur, TX
- Population (ZIP)
- 28,983
- Household income
- $64,373
- Rent vs Own
- Severe rent burden
- 1018.0
Population outlook (Orange County) Hauer SSP2
- Today (2025)
- 88,065 people
- By 2030
- 89,591 · +1.7%
- By 2040
- 91,982 · +4.4%
- By 2050
- 93,023 · +5.6%
- By 2075
- 94,871 · +7.7%
- By 2100
- 88,155 · +0.1%
Race, ethnicity, and origin ACS 2023
- Neighborhood character
- Majority White (64%)
- Race & ethnicity
- White 64% Black 21% Hispanic / Latino 11% Two or more races 9%
- Hispanic origin (detail)
- Mexican 7%
- Common ancestry
- Lithuanian 13% Italian 1% Slovak 1%
- Foreign-born
- 5% · Canada
- Languages at home
- 91% English-only · Spanish 7% French/Haitian/Cajun 1% Other Asian/Pacific 1%
Political lean MEDSL · Orange
- 2024 margin
- Solid R (+66.8) · D 16.4% · R 83.1%
- 2008→2024 swing
- -19.6pp toward R · 2008: -47.1pp · 2024: -66.8pp
- All cycles
- 2024: R+66.8 2020: R+63.4 2016: R+61.9 2012: R+54.3 2008: R+47.1
Not yet ingested
- Civics
- —
Market trends
- HPI YoY
- ▲ 1.01%
- Current HPI
- 264.14
- Rent YoY
- ▲ 5.71%
- Metro
- Beaumont-Port Arthur, TX
- State GDP YoY
- ▲ 3.95%
- F500 in state
- 110
Industry mix (Fortune 500 HQ in TX)
| Industry | F500 HQs | Revenue |
|---|---|---|
| Energy | 16 | $1,198B |
|
||
| Technology | 5 | $198B |
|
||
| Engineering / Construction | 4 | $72B |
|
||
| Energy Services | 3 | $60B |
|
||
| Utilities | 3 | $41B |
|
||
| Healthcare | 2 | $330B |
|
||
Price history
-15.6% since first listed2 events — show timeline
- 2026-03-30 Price Changed $129,900 BBOR
- 2026-02-25 Listed $153,900 BBOR
Property tax history
+12.7%/yrLatest (2025): $2,723 · +1.9% YoY. Source: county tax records.
Cash-flow waterfall
monthlySold comps — $/sqft
last 12 mo · ≤1 miLoading sold comps…