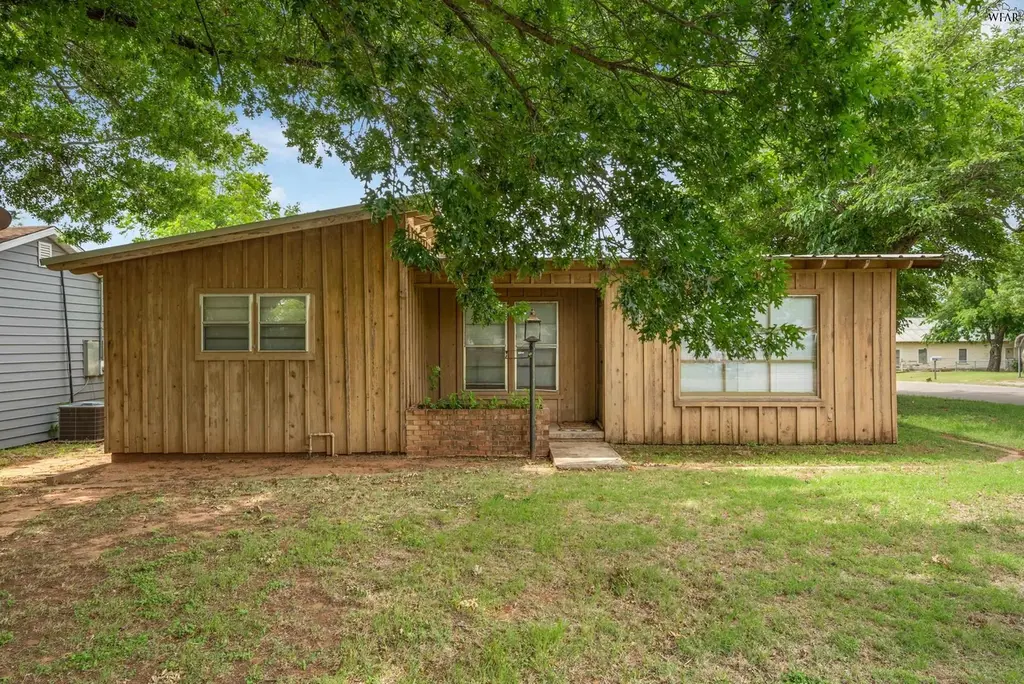
501 E Ruby Ave · Iowa Park, TX
Flood risk 1/10 · Minimal
- FEMA flood zone
- X (unshaded)
- Chance of flooding over 30 yrs
- 0.0%
- Est. flood insurance / yr
- $507 – $1,088
Fire risk 8/10 · Major
- Est. fire insurance / yr
- $1,222 – $2,270
Heat risk 7/10 · Major
- Hot days now (above 110°F)
- 6 days/yr
- Hot days in 30 yrs
- 17 days/yr
Wind risk 4/10 · Minor
- Chance of severe wind over 30 yrs
- 10.0%
Air-quality risk 1/10 · Minimal
- Unhealthy air days now
- 0 days/yr
- Unhealthy air days in 30 yrs
- 0 days/yr
Risk factors via First Street. Map © Google.
Why this score? — see what drove the A grade
The composite is a weighted blend of 9 inputs, each scored 0–100. Each bar is that input's sub-score; the figure is the points it added to the 100-point composite (weight × sub-score).
- Cash flow +30.0/30.0
- ARV discount +15.0/15.0
- 1% rule +10.0/10.0
- DSCR +10.0/10.0
- Appreciation +10.0/10.0
- Schools +4.6/10.0
- Livability +3.6/5.0
- Rent growth +2.5/5.0
- Condition / age +2.5/5.0
$89,900
🖨 Deal sheet 📄 Offer letter ✓ Due diligence
Listing remarks
Investment opportunity on the corner of Ruby & Texowa in Iowa Park! Main home features wood exterior, metal roof, CH/A, hardwood floors, large living/dining area, updated kitchen cabinets, 2 bedrooms, full bath & separate utility room. Detached 2-car garage/shop plus additional office/storage area with restroom. Third structure was previously an apartment with kitchen, living, bed & bath and needs work. Multiple income possibilities! Sold AS-IS. Cash or conventional only.
Key facts
- Built 1940
- Listed 42 days
Property features AI
Exterior
- Utilities: Public water; Public sewer
- Home design: Single-family residence; Residential property; One story; Faces north
- Construction: Wood siding construction
- Exterior features: Corner lot; Composition roof; Metal roof
Interior
- Kitchen: Eat-in kitchen
- Bedrooms: Has basement
- Flooring: Hardwood flooring; Laminate flooring
- Heating & cooling: Central heating (electric); Central air conditioning
- Interior features: Eat-in kitchen; Storm windows
Neighborhood map
What this means for you Summary
Snapshot
- This is a 2-bed/2.0-bath single-family listed at $90k.
Deal economics
- At list price, monthly cash flow is $493 ($6k/yr) — positive.
- The deal already cash-flows at list — no discount required.
- Meets the 1% rule at list price ($2k rent vs $90k).
- Recommended offer: $87k (3.0% below list) — sets the bar for market timing.
Location & tenants
- Location reads 72/100 on livability (#272 in TX) — a middle-class / working-renter tenant base. Strengths: crime A+, cost of living A+, housing A+; Watch: health & safety C-, amenities F, commute F.
- Iowa Park CISD (town): math 57% / reading 49% proficiency, ranked #129 of 826 in TX (top 16%) — acceptable for families but not a draw, mixed tenant base, ~2y average lease.
- Zoned schools: Bradford El (math 58% / reading 51%, grade C, #621 of 4,322 statewide, top 15%, 447 students, 46% FRL); Iowa Park Jjaep (1 students, 0% FRL); Iowa Park H S (math 72% / reading 67%, grade B, #119 of 1,632 statewide, top 9%, 544 students, 34% FRL).
- Market conditions: 63 active listings in the ZIP; 1 comparable units currently listed for rent nearby; 231 units permitted in Wichita County in 2024 (10 in 5+ unit buildings).
Forward outlook
- In year one you build about $10k of equity ($622 loan paydown + $9k appreciation (10.0% local appreciation)).
- Wichita County population projected to shrink 7% by 2050 — rents likely to lag national; underwrite the cash flow, not the appreciation.
- At projected returns (10.0% appreciation + 3.0% rent growth), your $25k cash investment doubles in ~2 years — after that, you're playing with house money.
- By year 4, paydown + projected appreciation supports a ~$34k cash-out refi (75% LTV) — recoverable capital for the next deal without selling this one.
Negotiation context
- It's been on market 43 days — a 3% lower offer ($87k) is reasonable based on typical stale-listing flexibility.
Risks & watch-outs
- Watch-outs: built in 1940 — expect roof / HVAC / electrical / plumbing capex.
- Climate carrying-cost: severe wildfire risk; extreme-heat days projected 6→17/yr by 2055 (HVAC capex compounding) — expect insurance premiums to compound above CPI over the hold.
Questions for the listing agent
- It's been on market 43 days. Have you received any prior offers? Is the seller open to a 3% concession, seller financing, or rate buy-down credit?
- Built in 1940 — when were the roof, HVAC, electrical panel, plumbing, and water heater last replaced?
- Is there a deadline driving the sale (1031 exchange, divorce, estate, relocation)? That informs how much negotiation room exists.
- What's the average days-on-market for RENTAL listings here right now (not sales)? A rising rental-DOM trend means longer vacancies and softer asking-rent achievability than the comps imply.
- What's the recent tenant-quality profile in this submarket — average credit score on applications, eviction rate, late-payment / NSF rate, and stable-employment percentage? A property-management company in the area should have these aggregated.
- How much new for-sale + rental construction is in the pipeline within 1–3 miles? Heavy new supply typically softens prices + rents 12–24 months out; constrained supply supports both.
Investment metrics
- 1% rule
- 1.67% ✓
- Cap rate
- 12.87%
- Cash-on-cash
- 23.49%
- DSCR
- 2.05
- GRM
- 5.0
CMA / ARV
- ARV (median comp)
- $144,768
- List price
- $89,900
- Delta
- -37.90%
- Verdict
- UNDERPRICED
- Comps
- 5 within 1.0 mi
Show comp detail 2 sales within ~0.75 mi
| Address | Dist | Beds/Ba | Sqft | Sold | Price | $/sf | Match |
|---|---|---|---|---|---|---|---|
| 1213 Newman | 0.60mi | 3/2.0 (+1) | 1,130 (-1%) | 12mo | $185,000 | $164 | 55 |
| 127 James Dr | 0.70mi | 3/1.0 (+1) | 1,098 (-4%) | 20mo | $149,999 | $137 | 35 |
Match score weights: distance 35% · size 25% · config 20% · recency 20%. Top-matched comps best support the ARV.
Projected returns pro-forma
10.0% appreciation · 3.0% rent growth · sell at horizon
- IRR
- 41.9%
- Equity multiple
- 4.19×
- Total profit
- $80,411
- Equity at exit
- $80,989
- IRR
- 36.2%
- Equity multiple
- 9.43×
- Total profit
- $212,249
- Equity at exit
- $174,656
Cash invested: $25,172 (down + closing). Projections, not guarantees.
Landlord ↔ Tenant lean methodology
- Overall (STATE)
- 87 Strongly Landlord-Friendly
- State Texas
- 87 Strongly Landlord-Friendly · R+5
- County
- — inherits STATE
- City
- — inherits STATE
ZIP-level market 76367
- Home prices YoY
- 6.7%
- Active inventory
- 63
- Price-to-rent
- 5.0×
Monthly cashflow live
- Estimated rent
- $1,500 medium interval (Pro) →
- Mortgage (P&I)
- −$471
- Tax from tax record
- −$183 /mo · $2,200/yr
- Insurance
- −$37
- HOA
- −$0
- Vacancy / Maint / Mgmt
- −$315
- Net cashflow
- $493
Break-even live
UW: 25.0% down · 7.5% · 30yr · 1.5% tax · 5.0% vac · 8.0% maint · 8.0% mgmt
Financing live
Cash to close
- Down payment
- $22,475
- Closing costs
- $2,697
- Reserves months
- —
- Total cash needed
- —
Loan-product check · same deal, 3 products live
Conventional
25% down · 7.5% · 30yr
- Down + closing
- —
- Monthly P&I
- —
- Monthly cashflow
- —
- DSCR
- —
- Eligible?
- —
Personal DTI + credit; lowest rate.
DSCR
20% down · 8.5% · 30yr
- Down + closing
- —
- Monthly P&I
- —
- Monthly cashflow
- —
- DSCR
- —
- Eligible?
- —
No personal income docs; deal must DSCR.
Hard money
10% down · 12.0% · 12mo
- Down + closing
- —
- Monthly P&I
- —
- Monthly cashflow
- —
- DSCR
- —
- Eligible?
- —
Short-term bridge; refi at stabilization.
Rent comps 1 comps
| Address | Beds | Baths | Sqft | Rent | $/sqft | DOM | Units | Dist |
|---|---|---|---|---|---|---|---|---|
| 706 W Louisa Ave Iowa Park, TX | 3.0 | 1.5 | 1144 | $1,500 | $1.31 | 43d | 1 | 1.31mi |
Listing history 21 events
-
2026-06-19days on market $89,900 Active 43 DOM
-
2026-06-18days on market $89,900 Active 42 DOM
-
2026-06-17price $89,900 Active 41 DOM
-
2026-06-17days on market $99,900 Active 41 DOM
-
2026-06-16days on market $99,900 Active 40 DOM
-
2026-06-15days on market $99,900 Active 39 DOM
-
2026-06-14days on market $99,900 Active 37 DOM
-
2026-06-13days on market $99,900 Active 36 DOM
-
2026-06-10days on market $99,900 Active 34 DOM
-
2026-06-09days on market $99,900 Active 33 DOM
-
2026-06-08days on market $99,900 Active 32 DOM
-
2026-06-07days on market $99,900 Active 31 DOM
-
2026-06-03days on market $99,900 Active 27 DOM
-
2026-06-02days on market $99,900 Active 26 DOM
-
2026-06-01days on market $99,900 Active 25 DOM
-
2026-05-31days on market $99,900 Active 24 DOM
-
2026-05-30days on market $99,900 Active 23 DOM
-
2026-05-06$99,900 Active 494-char remark
-
2024-02-21soldstatus
-
2023-12-01soldstatus
-
2023-11-02soldstatus
ⓘ Source: listings_history table (triggers on properties + properties_extension) + one-shot
backfill from property_details.listing_events for pre-trigger history.
Tax reassessment forecast TX · Resets to sale price
- Current annual tax
- $2,200 · $183/mo
- Projected year-2 tax
- $2,200 · $183/mo
- Expected delta
- $0/yr ($0/mo · 0.0%)
ⓘ Screening estimate from a state-policy table — verify with the county assessor before closing.
Climate risk First Street
- Flood 1/10 Low FEMA zone X (unshaded) · 0% chance over 30 yrs
- Wildfire 8/10 Severe
- Heat 7/10 Severe 6 d/yr ≥110°F today · 17 d/yr by 30 yrs out
- Wind 4/10 Moderate 10% chance of damaging wind over 30 yrs
- Air quality 1/10 Low 0 unhealthy d/yr today · 0 by 30 yrs out
Nearby sold comps map
Loading sold comps map…
Walkable amenities ~0.75 mi
Loading nearby amenities…
Taxation est. · year 1
- Rental income
- $18,000
- − Mortgage interest
- −$5,036
- − Property taxes
- −$2,200
- − Insurance
- −$450
- − Repairs & maintenance
- −$1,440
- − Management
- −$1,440
- − Depreciation
- −$2,615
- Taxable income
- $4,819
- Est. tax owed @ 24.0%
- −$1,157
- After-tax cash flow
- $4,756/yr
For passive investors: Depreciation is non-cash, so a rental often shows a tax loss while cash-flowing — sheltering income. Rental losses are passive: they offset passive income freely, and up to $25,000/yr can offset ordinary (W-2) income if you actively participate and your MAGI is under $100k (phasing out to $0 by $150k); unused losses carry forward. On sale, claimed depreciation is recaptured at up to 25%, and gains may owe capital-gains tax (a 1031 exchange can defer both). Figures are a year-1 estimate at your 24.0% rate — not tax advice; consult a CPA.
Schools (NCES district)
- District
- Iowa Park CISD
- NCES district ID
- 4824260
- Math proficiency
- 57% ▼ -1.00%
- Reading proficiency
- 49% ▼ -4.00%
- Median HH income
- $52,689
- Composite
- 45.57/100
- National rank
- #2597
- State rank
- #129 of 826 in TX
Livability — Iowa Park
- Score
- 72/100
- State rank
- #272
- US rank
- #6350
Category grades
Schools grade is shown separately in the Schools card above.
Census & demographics
- Census place
- Iowa Park, TX
- City population
- 14,013
- Population (ZIP)
- 14,013
Population outlook (Wichita County) Hauer SSP2
- Today (2025)
- 129,638 people
- By 2030
- 128,366 · -1.0%
- By 2040
- 124,466 · -4.0%
- By 2050
- 120,499 · -7.0%
- By 2075
- 113,884 · -12.2%
- By 2100
- 101,818 · -21.5%
Race, ethnicity, and origin ACS 2023
- Neighborhood character
- Predominantly White (70%)
- Race & ethnicity
- White 70% Hispanic / Latino 16% Black 10% Two or more races 8% Asian 1% Native American 1%
- Hispanic origin (detail)
- Mexican 13%
- Common ancestry
- Lithuanian 1% Portuguese 1% Slovak 1%
- Foreign-born
- 4% · Canada, Vietnam
- Languages at home
- 93% English-only · Spanish 6%
Political lean MEDSL · Wichita
- 2024 margin
- Solid R (+44.0) · D 27.5% · R 71.5%
- 2008→2024 swing
- -5.2pp toward R · 2008: -38.9pp · 2024: -44.0pp
- All cycles
- 2024: R+44.0 2020: R+41.1 2016: R+49.7 2012: R+47.1 2008: R+38.9
Not yet ingested
- Civics
- —
Market trends
- HPI YoY
- ▲ 24.29%
- Current HPI
- 387.78
- Rent YoY
- —
- Metro
- —
- State GDP YoY
- ▲ 3.95%
- F500 in state
- 110
Industry mix (Fortune 500 HQ in TX)
| Industry | F500 HQs | Revenue |
|---|---|---|
| Energy | 16 | $1,198B |
|
||
| Technology | 5 | $198B |
|
||
| Engineering / Construction | 4 | $72B |
|
||
| Energy Services | 3 | $60B |
|
||
| Utilities | 3 | $41B |
|
||
| Healthcare | 2 | $330B |
|
||
Price history
-10.0% since first listed5 events — show timeline
- 2026-06-17 Price Changed $89,900 WFAOR
- 2026-05-06 Listed $99,900 WFAOR
- 2024-02-21 Sold (Public Records) — Public Records
- 2023-12-01 Sold (Public Records) — Public Records
- 2023-11-02 Sold (Public Records) — Public Records
Property tax history
+4.0%/yrLatest (2025): $2,200 · -7.8% YoY. Source: county tax records.
Cash-flow waterfall
monthlySold comps — $/sqft
last 12 mo · ≤1 miLoading sold comps…