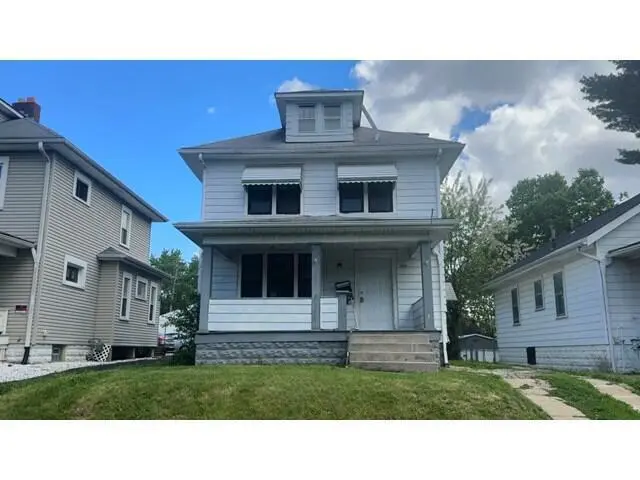
314 N Burgess Ave · Columbus, OH
Flood risk 1/10 · Minimal
- FEMA flood zone
- X (unshaded)
- Chance of flooding over 30 yrs
- 0.0%
- Est. flood insurance / yr
- $473 – $860
Fire risk 1/10 · Minimal
- Est. fire insurance / yr
- $713 – $1,323
Heat risk 4/10 · Minor
- Hot days now (above 100°F)
- 7 days/yr
- Hot days in 30 yrs
- 18 days/yr
Wind risk 2/10 · Minimal
- Chance of severe wind over 30 yrs
- 1.0%
Air-quality risk 3/10 · Minor
- Unhealthy air days now
- 1 days/yr
- Unhealthy air days in 30 yrs
- 4 days/yr
Risk factors via First Street. Map © Google.
Why this score? — see what drove the C- grade
The composite is a weighted blend of 9 inputs, each scored 0–100. Each bar is that input's sub-score; the figure is the points it added to the 100-point composite (weight × sub-score).
- Cash flow +16.9/30.0
- ARV discount +15.0/15.0
- DSCR +5.3/10.0
- 1% rule +4.5/10.0
- Livability +4.0/5.0
- Rent growth +3.6/5.0
- Condition / age +2.5/5.0
- Schools +1.7/10.0
- Appreciation +0.0/10.0
$149,900
🖨 Deal sheet (PDF) 📄 Offer letter ✓ Due diligence
Listing remarks MLS
Absolutely charming w/ stunning natural woodwork and gleaming refinished hardwood floors! Nice-sized kitchen w/ updates + mud room & add'l room off the back! Updated bath w/ built-in storage. Den/office off one of the BRs. Walk-up finishable 3rd flr. ! Sold to settle estate. AGENT WILL SET SHOWINGS!!!
Key facts
- 6,098 sq ft lot
- Garage
- Built 1925
Property features AI
Finance
- Other: Real estate owned (REO) / standard listing conditions
Exterior
- Parking: Detached 1-car garage
- Utilities: Public water; Public sewer
- Home design: Single family residence; Two levels; Built in 1925; No shared/common walls
- Construction: Block foundation
- Exterior features: Deck; Outbuilding
Interior
- Flooring: Wood flooring
- Bathrooms: 1 full bathroom
- Heating & cooling: Forced air heating
- Interior features: Decorative fireplace (one); Full walk-up basement
Neighborhood map
What this means for you Summary
Snapshot
- This is a 3-bed/1.5-bath single-family listed at $150k.
Deal economics
- At list price, monthly cash flow is $98 ($1k/yr) — positive.
- The deal already cash-flows at list — no discount required.
- To meet the 1% rule (rent ≥ 1% of price), the offer needs to be $142k (5.4% below list).
- Recommended offer: $142k (5.4% below list) — sets the bar for 1% rule.
- Cap rate 7.1% vs local median 3.8% in Columbus — top-decile yield for the area; either an underpriced asset or a hidden risk that comps aren't pricing in. Stress-test before assuming the spread holds.
Location & tenants
- Location reads 81/100 on livability (#97 in OH, #1,491 nationally) — a professional / high-income tenant draw. Strengths: commute A+, cost of living A+, housing A+; Watch: employment C-, crime F.
- Columbus City School District (urban): math 15% / reading 26% proficiency, ranked #626 of 656 in OH (top 95%) — low school quality limits family demand, transient renter base, plan for 1-2y turnover; 72% free/reduced lunch — lower-income household profile, screen leases tightly.
- Zoned schools: Indianola Informal K-8 School (math 43% / reading 58%, grade D+, #896 of 1,584 statewide, top 57%, 684 students, 0% FRL); Arts Impact Middle School (Aims) (math 17% / reading 25%, grade F, #608 of 654 statewide, top 93%, 532 students, 0% FRL); West High School (math 2% / reading 17%, grade F, #749 of 781 statewide, top 97%, 837 students, 0% FRL) — zoned schools average 0% FRL vs 72% district-wide (72 pts lower); this property's tenant base skews higher-income than the district average.
- Market conditions: Rents rising fast (+4.5%/yr); 187 active listings in the ZIP; 40 comparable units currently listed for rent nearby; rentals at typical pace (median 22d on market — plan ~3-4 weeks tenant-placement turnaround); 8,139 units permitted in Franklin County in 2024 (5,940 in 5+ unit buildings).
Forward outlook
- Local home prices are declining (-3.0%/yr); year-one equity from $1k of loan paydown is wiped out by about $4k of value loss. Plan a longer hold.
- Franklin County population projected at +34% by 2050 — long-run rental-demand tailwind backs the buy-and-hold thesis.
Negotiation context
- It's been on market 46 days — a 3% lower offer ($145k) is reasonable based on typical stale-listing flexibility.
- 6 sale attempts since 23y ago; this cycle's ask has dropped $10k (6%) from the opening price — seller is motivated, your offer sets the floor, not the list.
- Current owner paid $76k; list at $150k implies a 96% gain — meaningful room to come down on a strong offer.
Risks & watch-outs
- Watch-outs: built in 1925 — expect roof / HVAC / electrical / plumbing capex.
Questions for the listing agent
- It's been on market 46 days. Have you received any prior offers? Is the seller open to a 5% concession, seller financing, or rate buy-down credit?
- Built in 1925 — when were the roof, HVAC, electrical panel, plumbing, and water heater last replaced?
- Is there a deadline driving the sale (1031 exchange, divorce, estate, relocation)? That informs how much negotiation room exists.
- Crime grade is F in this area — have there been break-ins, vandalism, or insurance claims at this property in the last 3 years? What carrier currently insures it and at what premium?
- What's the average days-on-market for RENTAL listings here right now (not sales)? A rising rental-DOM trend means longer vacancies and softer asking-rent achievability than the comps imply.
- What's the recent tenant-quality profile in this submarket — average credit score on applications, eviction rate, late-payment / NSF rate, and stable-employment percentage? A property-management company in the area should have these aggregated.
- How much new for-sale + rental construction is in the pipeline within 1–3 miles? Heavy new supply typically softens prices + rents 12–24 months out; constrained supply supports both.
Investment metrics
- 1% rule
- 0.95% ✗
- Cap rate
- 7.08%
- Cash-on-cash
- 2.81%
- DSCR
- 1.13
- GRM
- 8.8
CMA / ARV
- ARV (median comp)
- $212,231
- List price
- $149,900
- Delta
- -29.37%
- Verdict
- UNDERPRICED
- Comps
- 20 within 1.0 mi
Show comp detail 12 sales within ~0.75 mi
| Address | Dist | Beds/Ba | Sqft | Sold | Price | $/sf | Match |
|---|---|---|---|---|---|---|---|
| 121 N Terrace Ave | 0.29mi | 3/2.0 | 1,447 (-2%) | 1mo | $230,000 | $159 | 80 |
| 200 N Hague Ave | 0.31mi | 3/1.0 | 1,440 (-3%) | 0mo | $155,000 | $108 | 78 |
| 2424 Westwood Dr | 0.20mi | 3/1.5 | 1,596 (+8%) | 1mo | $260,000 | $163 | 78 |
| 247 Eldon Ave | 0.18mi | 4/1.5 (+1) | 1,560 (+5%) | 2mo | $220,000 | $141 | 76 |
| 281 N Burgess Ave | 0.05mi | 4/2.5 (+1) | 1,594 (+7%) | 3mo | $259,900 | $163 | 74 |
| 2741 Ridge Ave | 0.26mi | 3/2.0 | 1,354 (-9%) | 1mo | $241,900 | $179 | 70 |
| 267 N Hague Ave | 0.31mi | 3/1.5 | 1,344 (-9%) | 1mo | $214,900 | $160 | 69 |
| 54 N Burgess Ave | 0.37mi | 3/1.0 | 1,357 (-9%) | 2mo | $114,000 | $84 | 65 |
| 261 N Wayne Ave | 0.27mi | 3/1.5 | 1,288 (-13%) | 1mo | $118,000 | $92 | 65 |
| 75 N Huron Ave | 0.69mi | 3/1.5 | 1,528 (+3%) | 1mo | $177,500 | $116 | 62 |
| 27 S Oakley Ave | 0.60mi | 4/2.0 (+1) | 1,496 (+1%) | 3mo | $215,000 | $144 | 61 |
| 107 Haldy Ave | 0.61mi | 3/2.0 | 1,352 (-9%) | 2mo | $250,000 | $185 | 53 |
Match score weights: distance 35% · size 25% · config 20% · recency 20%. Top-matched comps best support the ARV.
Projected returns pro-forma
-3.0% appreciation · 4.49% rent growth · sell at horizon
- IRR
- -10.2%
- Equity multiple
- 0.62×
- Total profit
- $-15,856
- Equity at exit
- $22,351
- IRR
- 1.1%
- Equity multiple
- 1.08×
- Total profit
- $3,434
- Equity at exit
- $12,961
Cash invested: $41,972 (down + closing). Projections, not guarantees.
Landlord ↔ Tenant lean methodology
- Overall (STATE)
- 73 Landlord-Friendly
- State Ohio
- 73 Landlord-Friendly · R+6
- County
- — inherits STATE
- City
- — inherits STATE
ZIP-level market 43204
- Rents YoY
- 4.5%
- Active inventory
- 187
- Price-to-rent
- 8.8×
Monthly cashflow live
- Estimated rent
- $1,418 high interval (Pro) →
- Mortgage (P&I)
- −$786
- Tax from tax record
- −$173 /mo · $2,076/yr
- Insurance
- −$62
- HOA
- −$0
- Vacancy / Maint / Mgmt
- −$298
- Net cashflow
- $98
Break-even live
Sensitivity live
| Price | -10% $183 | -5% $141 | +0% $98 | +5% $56 | +10% $14 |
|---|---|---|---|---|---|
| Rent | -10% $-14 | -5% $42 | +0% $98 | +5% $154 | +10% $210 |
| Rate | -1.0pp $174 | -0.5pp $136 | base $98 | +0.5pp $60 | +1.0pp $20 |
UW: 25.0% down · 7.5% · 30yr · 1.5% tax · 5.0% vac · 8.0% maint · 8.0% mgmt
Financing live
Cash to close
- Down payment
- $37,475
- Closing costs
- $4,497
- Reserves months
- —
- Total cash needed
- —
Loan-product check · same deal, 3 products live
Conventional
25% down · 7.5% · 30yr
- Down + closing
- —
- Monthly P&I
- —
- Monthly cashflow
- —
- DSCR
- —
- Eligible?
- —
Personal DTI + credit; lowest rate.
DSCR
20% down · 8.5% · 30yr
- Down + closing
- —
- Monthly P&I
- —
- Monthly cashflow
- —
- DSCR
- —
- Eligible?
- —
No personal income docs; deal must DSCR.
Hard money
10% down · 12.0% · 12mo
- Down + closing
- —
- Monthly P&I
- —
- Monthly cashflow
- —
- DSCR
- —
- Eligible?
- —
Short-term bridge; refi at stabilization.
Rent comps 40 comps
| Address | Beds | Baths | Sqft | Rent | $/sqft | DOM | Units | Dist |
|---|---|---|---|---|---|---|---|---|
| 2735 Sutton Ave Columbus, OH | 3.0 | 1.0 | 1099 | $1,175 | $1.07 | 5d | 1 | 0.29mi |
| 2730 Elliott Ave Columbus, OH | 3.0 | 1.0 | 1332 | $1,803 | $1.35 | 45d | 1 | 0.31mi |
| 87-97 N Burgess Ave Unit 93 Columbus, OH | 2.0 | 1.5 | 1050 | $1,250 | $1.19 | 25d | 1 | 0.33mi |
| 87-97 N Burgess Ave Columbus, OH | 2.0 | 1.0 | 950 | $1,250 | $1.32 | 45d | 1 | 0.34mi |
| 133 N Eureka Ave Columbus, OH | 3.0 | 1.0 | 1484 | $1,350 | $0.91 | 14d | 1 | 0.34mi |
| 54 N Ogden Ave Columbus, OH | 3.0 | 1.0 | 1176 | $950 | $0.81 | 3d | 1 | 0.39mi |
| 39 Eldon Ave Unit 1 Columbus, OH | 3.0 | 2.0 | 1043 | $1,500 | $1.44 | 25d | 1 | 0.43mi |
| 174 N Wheatland Ave Columbus, OH | 2.0 | 1.0 | 917 | $1,046 | $1.14 | 4d | 3 | 0.46mi |
| 130 N Roys Ave Columbus, OH | 3.0 | 1.0 | 1380 | $1,595 | $1.16 | 3d | 1 | 0.53mi |
| 27-29 N Terrace Ave Unit 29 Columbus, OH | 3.0 | 1.0 | 1144 | $1,260 | $1.10 | 25d | 1 | 0.53mi |
| 29 S Terrace Ave Columbus, OH | 3.0 | 1.0 | 1144 | $1,260 | $1.10 | 25d | 1 | 0.53mi |
| 43-45 N Chase Ave Unit 43 Columbus, OH | 3.0 | 1.0 | 1200 | $1,400 | $1.17 | 12d | 1 | 0.57mi |
| 43 N Chase Ave Columbus, OH | 3.0 | 1.0 | 1200 | $1,400 | $1.17 | 12d | 1 | 0.57mi |
| 80 S Warren Ave Columbus, OH | 3.0 | 1.0 | 1258 | $1,345 | $1.07 | 45d | 1 | 0.60mi |
| 80 S Warren Ave Columbus, OH | 3.0 | 1.0 | 1258 | $1,345 | $1.07 | 5d | 1 | 0.60mi |
| 43 N Roys Ave Columbus, OH | 3.0 | 1.5 | 1332 | $1,599 | $1.20 | 25d | 1 | 0.62mi |
| 41 S Oakley Ave Columbus, OH | 3.0 | 1.5 | 1428 | $1,550 | $1.09 | 45d | 1 | 0.63mi |
| 92 S Hague Ave Columbus, OH | 3.0 | 2.0 | 1456 | $1,400 | $0.96 | 25d | 1 | 0.65mi |
| 41-43 N Huron Ave Unit 41 Columbus, OH | 3.0 | 1.0 | 1176 | $1,400 | $1.19 | 9d | 1 | 0.73mi |
| 148 S Powell Ave Columbus, OH | 2.0 | 1.0 | 900 | $1,050 | $1.17 | 45d | 1 | 0.75mi |
| 148 S Powell Ave Unit B Columbus, OH | 2.0 | 1.0 | 900 | $1,000 | $1.11 | 9d | 1 | 0.75mi |
| 170 S Highland Ave Columbus, OH | 2.0 | 1.0 | 950 | $895 | $0.94 | 45d | 1 | 0.86mi |
| 252-254 S Wayne Ave Unit 254 Columbus, OH | 3.0 | 1.0 | 1120 | $1,300 | $1.16 | 19d | 1 | 0.89mi |
| 95-97 Whitethorne Ave Columbus, OH | 3.0 | 1.5 | 1260 | $1,375 | $1.09 | 5d | 1 | 0.90mi |
| 95-97 Whitethorne Ave Columbus, OH | 3.0 | 1.5 | 1260 | $1,475 | $1.17 | 21d | 1 | 0.90mi |
| 179 N Sylvan Ave Unit 179 Columbus, OH | 3.0 | 2.0 | 1152 | $2,000 | $1.74 | 19d | 1 | 0.96mi |
| 329 S Wayne Ave Columbus, OH | 3.0 | 1.0 | 1120 | $1,425 | $1.27 | 4d | 1 | 0.98mi |
| 322 S Powell Ave Columbus, OH | 2.0 | 1.0 | 1100 | $950 | $0.86 | 21d | 1 | 0.98mi |
| 257 Clarendon Ave Unit 257,259,261,263 Columbus, OH | 2.0 | 1.0 | 1000 | $1,200 | $1.20 | 45d | 1 | 1.00mi |
| 364 S Chase Ave Unit B Columbus, OH | 2.0 | 1.0 | 1010 | $975 | $0.97 | 45d | 1 | 1.06mi |
| 406 1/2 S Hague Ave Columbus, OH | 2.0 | 1.0 | 918 | $765 | $0.83 | 45d | 1 | 1.08mi |
| 396 S Powell Ave Unit 396 Columbus, OH | 2.0 | 1.0 | 1022 | $925 | $0.91 | 45d | 1 | 1.08mi |
| 427 S Ogden Ave Unit 427 Columbus, OH | 2.0 | 1.0 | 980 | $1,350 | $1.38 | 9d | 1 | 1.09mi |
| 255 Belvidere Ave Columbus, OH | 2.0 | 1.0 | 1144 | $1,195 | $1.04 | 17d | 1 | 1.12mi |
| 2883-2889 Wicklow Rd Columbus, OH | 2.0 | 1.0 | 1200 | $1,099 | $0.92 | 45d | 1 | 1.14mi |
| 475 S Ogden Ave Columbus, OH | 2.0 | 1.0 | 888 | $1,100 | $1.24 | 25d | 1 | 1.16mi |
| 721 Grandview Crossing Way Columbus, OH | 2.0 | 1.0–2.0 | 701 | $2,068 | $2.95 | 4d | 8 | 1.20mi |
| 190 Nashoba Ave Columbus, OH | 2.0 | 1.0 | 1030 | $1,450 | $1.41 | 21d | 1 | 1.21mi |
| 190 Nashoba Ave Columbus, OH | 2.0 | 1.0 | 1030 | $1,450 | $1.41 | 13d | 1 | 1.21mi |
| 1212 Lake Shore Dr Columbus, OH | 2.0 | 2.0 | 1044 | $2,200 | $2.11 | 12d | 1 | 1.22mi |
Listing history 28 events
-
2026-06-21days on market $149,900 Active 46 DOM
-
2026-06-18days on market $149,900 Active 43 DOM
-
2026-06-17days on market $149,900 Active 42 DOM
-
2026-06-16days on market $149,900 Active 41 DOM
-
2026-06-15days on market $149,900 Active 40 DOM
-
2026-06-13days on market $149,900 Active 38 DOM
-
2026-06-13days on market $149,900 Active 37 DOM
-
2026-06-09pricedays on market $149,900 Active 34 DOM
-
2026-06-08days on market $159,900 Active 33 DOM
-
2026-06-07days on market $159,900 Active 32 DOM
-
2026-06-05days on market $159,900 Active 29 DOM
-
2026-06-03days on market $159,900 Active 28 DOM
-
2026-06-02days on market $159,900 Active 27 DOM
-
2026-06-01days on market $159,900 Active 26 DOM
-
2026-05-31days on market $159,900 Active 25 DOM
-
2026-05-06$159,900 Active 211-char remark
-
2024-06-15historical $1,500
-
2024-05-08$1,500
-
2008-03-30historical
-
2007-06-13$89,900
-
2003-07-30soldstatus $76,500
-
2003-07-25soldstatus $76,500
Show marketing remark (308 chars)
Absolutely charming w/ stunning natural woodwork and gleaming refinished hardwood floors! Nice-sized kitchen w/ updates + mud room & add'l room off the back! Updated bath w/ built-in storage. Den/office off one of the BRs. Walk-up finishable 3rd flr. ! Sold to settle estate. AGENT WILL SET SHOWINGS!!!
-
2003-07-13historical
Show marketing remark (308 chars)
Absolutely charming w/ stunning natural woodwork and gleaming refinished hardwood floors! Nice-sized kitchen w/ updates + mud room & add'l room off the back! Updated bath w/ built-in storage. Den/office off one of the BRs. Walk-up finishable 3rd flr. ! Sold to settle estate. AGENT WILL SET SHOWINGS!!!
-
2003-06-23$79,900
Show marketing remark (308 chars)
Absolutely charming w/ stunning natural woodwork and gleaming refinished hardwood floors! Nice-sized kitchen w/ updates + mud room & add'l room off the back! Updated bath w/ built-in storage. Den/office off one of the BRs. Walk-up finishable 3rd flr. ! Sold to settle estate. AGENT WILL SET SHOWINGS!!!
-
2003-06-18historical
-
2003-05-15historical
-
2003-05-15$79,900
-
2003-02-14$74,900
ⓘ Source: listings_history table (triggers on properties + properties_extension) + one-shot
backfill from property_details.listing_events for pre-trigger history.
Tax reassessment forecast OH · Partial reset (capped growth)
- Current annual tax
- $2,076 · $173/mo
- Projected year-2 tax
- $2,207 · $184/mo
- Expected delta
- +$131/yr (+$11/mo · 6.3%)
ⓘ Screening estimate from a state-policy table — verify with the county assessor before closing.
Climate risk First Street
- Flood 1/10 Low FEMA zone X (unshaded) · 0% chance over 30 yrs
- Wildfire 1/10 Low
- Heat 4/10 Moderate 7 d/yr ≥100°F today · 18 d/yr by 30 yrs out
- Wind 2/10 Low 100% chance of damaging wind over 30 yrs
- Air quality 3/10 Moderate 1 unhealthy d/yr today · 4 by 30 yrs out
Nearby sold comps map
Loading sold comps map…
Walkable amenities ~0.75 mi
Loading nearby amenities…
Taxation est. · year 1
- Rental income
- $17,011
- − Mortgage interest
- −$8,397
- − Property taxes
- −$2,076
- − Insurance
- −$750
- − Repairs & maintenance
- −$1,361
- − Management
- −$1,361
- − Depreciation
- −$4,361
- Taxable loss
- −$1,293
- Est. tax savings @ 24.0%
- +$310
- After-tax cash flow
- $1,491/yr
For passive investors: Depreciation is non-cash, so a rental often shows a tax loss while cash-flowing — sheltering income. Rental losses are passive: they offset passive income freely, and up to $25,000/yr can offset ordinary (W-2) income if you actively participate and your MAGI is under $100k (phasing out to $0 by $150k); unused losses carry forward. On sale, claimed depreciation is recaptured at up to 25%, and gains may owe capital-gains tax (a 1031 exchange can defer both). Figures are a year-1 estimate at your 24.0% rate — not tax advice; consult a CPA.
Schools (NCES district)
- District
- Columbus City School District
- NCES district ID
- 3904380
- Math proficiency
- 15% ▼ -17.00%
- Reading proficiency
- 26% ▼ -12.00%
- Median HH income
- $38,483
- Composite
- 17.19/100
- National rank
- #9105
- State rank
- #626 of 656 in OH
Livability — Columbus
- Score
- 81/100
- State rank
- #97
- US rank
- #1491
Category grades
Schools grade is shown separately in the Schools card above.
Census & demographics
- Census place
- Columbus, OH
- County
- Franklin County · 1,351,780 people
- City population
- 612,189
- Metro
- Columbus, OH
- Population (ZIP)
- 42,962
- Household income
- $59,266
- Rent vs Own
- Severe rent burden
- 2290.0
Population outlook (Franklin County) Hauer SSP2
- Today (2025)
- 1,456,139 people
- By 2030
- 1,556,890 · +6.9%
- By 2040
- 1,757,349 · +20.7%
- By 2050
- 1,950,539 · +34.0%
- By 2075
- 2,376,171 · +63.2%
- By 2100
- 2,636,796 · +81.1%
Race, ethnicity, and origin ACS 2023
- Neighborhood character
- Diverse neighborhood (Simpson 0.58)
- Race & ethnicity
- White 61% Hispanic / Latino 16% Black 13% Two or more races 12% Asian 3%
- Hispanic origin (detail)
- Mexican 9%
- Common ancestry
- Lithuanian 1% Slovak 1% Romanian 1%
- Foreign-born
- 13% · Canada
- Languages at home
- 81% English-only · Spanish 13% Arabic 2% Other Asian/Pacific 1%
Political lean MEDSL · Franklin
- 2024 margin
- Strong D (+28.4) · D 63.7% · R 35.3% · Other 1.0%
- 2008→2024 swing
- +7.7pp toward D · 2008: 20.7pp · 2024: 28.4pp
- All cycles
- 2024: D+28.4 2020: D+31.4 2016: D+25.9 2012: D+21.7 2008: D+20.7
Not yet ingested
- Civics
- —
Market trends
- HPI YoY
- ▼ -220.67%
- Current HPI
- 265.7711
- Rent YoY
- ▲ 4.49%
- Metro
- Columbus, OH
- State GDP YoY
- ▲ 1.98%
- F500 in state
- 48
Industry mix (Fortune 500 HQ in OH)
| Industry | F500 HQs | Revenue |
|---|---|---|
| Insurance | 3 | $145B |
|
||
| Industrial Machinery | 3 | $49B |
|
||
| Financial Services | 3 | $24B |
|
||
| Consumer Goods | 2 | $93B |
|
||
| Aerospace / Defense | 2 | $47B |
|
||
| Utilities | 2 | $33B |
|
||
Price history
+100.1% since first listed14 events — show timeline
- 2026-06-09 Price Changed $149,900 CBRMLS
- 2026-05-06 Listed $159,900 CBRMLS
- 2024-06-15 Rental Removed $1,500 APPFOLIO
- 2024-05-08 Listed for Rent $1,500 APPFOLIO
- 2008-03-30 Listing Removed — CBRMLS
- 2007-06-13 Listed $89,900 CBRMLS
- 2003-07-30 Sold (Public Records) $76,500 Public Records
- 2003-07-25 Sold (MLS) $76,500 CBRMLS
- 2003-07-13 Listing Removed — CBRMLS
- 2003-06-23 Listed $79,900 CBRMLS
- 2003-06-18 Listing Removed — CBRMLS
- 2003-05-15 Listed $79,900 CBRMLS
- 2003-05-15 Listing Removed — CBRMLS
- 2003-02-14 Listed $74,900 CBRMLS
Property tax history
+5.5%/yrLatest (2024): $2,076 · +3.9% YoY. Source: county tax records.
Cash-flow waterfall
monthlySold comps — $/sqft
last 12 mo · ≤1 miLoading sold comps…