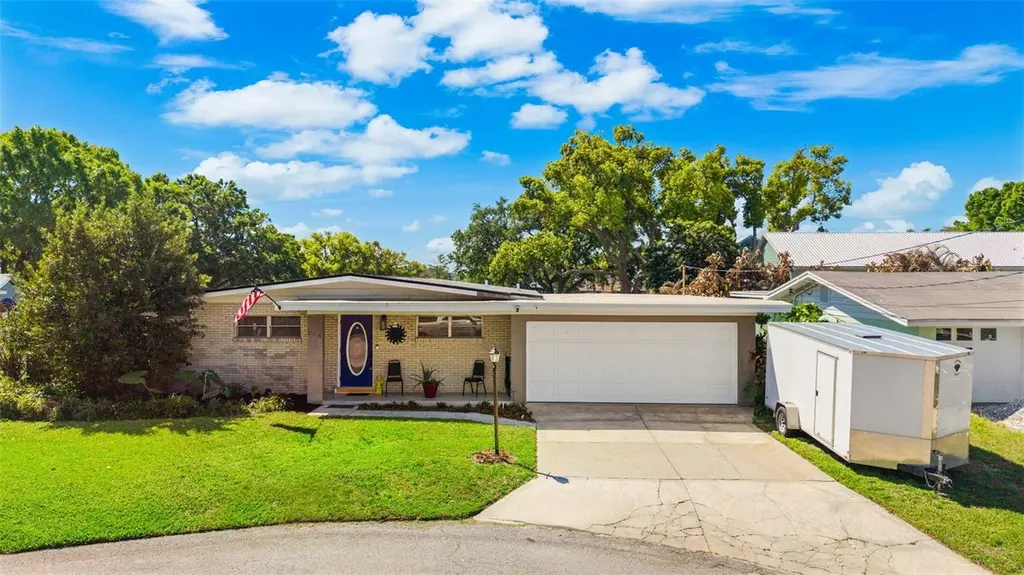
936 Avenue T SE · Cypress Gardens, FL
Flood risk 1/10 · Minimal
- FEMA flood zone
- X (unshaded)
- Chance of flooding over 30 yrs
- 0.0%
- Est. flood insurance / yr
- $507 – $1,088
Fire risk 3/10 · Minor
- Est. fire insurance / yr
- $947 – $1,759
Heat risk 8/10 · Major
- Hot days now (above 107°F)
- 7 days/yr
- Hot days in 30 yrs
- 23 days/yr
Wind risk 10/10 · Severe
- Chance of severe wind over 30 yrs
- 99.0%
Air-quality risk 2/10 · Minimal
- Unhealthy air days now
- 0 days/yr
- Unhealthy air days in 30 yrs
- 2 days/yr
Risk factors via First Street. Map © Google.
Why this score? — see what drove the D+ grade
The composite is a weighted blend of 9 inputs, each scored 0–100. Each bar is that input's sub-score; the figure is the points it added to the 100-point composite (weight × sub-score).
- Cash flow +15.0/30.0
- ARV discount +7.5/15.0
- 1% rule +5.0/10.0
- DSCR +5.0/10.0
- Livability +4.0/5.0
- Schools +3.5/10.0
- Rent growth +3.1/5.0
- Condition / age +2.5/5.0
- Appreciation +0.0/10.0
$18,000
🖨 Deal sheet 📄 Offer letter ✓ Due diligence
Listing remarks
Short Sale. Welcome to this beautiful 3-bedroom, 2-bathroom block home perfectly positioned at the end of a quiet cul-de-sac in Winter Haven's sought-after Cypress Gardens neighborhood. With 1,400 square feet of interior living space and a layout designed for both comfort and connection, this home checks every box. Step inside and you're immediately greeted by a bright, open floor plan where the living room, dining area, and kitchen flow together seamlessly ideal for everyday living and effortless entertaining. The kitchen is generously sized, featuring an abundance of cabinetry and two lazy Susan's that maximize every inch of storage. Natural light floods the home through an impressive arr
Key facts
- Screened-in patio
- Bar area
- Built-in grill
Tags
Property features AI
Finance
- Other: Property type: Residential — Single Family Residence; Lot size roughly 0.2 acres (about 795 sq meters); Building total area listed as 2,907 sq ft (per public records)
- HOA & community: Street lights in community; No HOA association indicated
Exterior
- Parking: Attached 2-car garage
- Utilities: Public water; Septic tank; Cable available; Electricity available and connected; Sewer available and connected; Water available
- Home design: Single family residence; Residential property; One story; Front of house faces north; Entry on cul-de-sac
- Construction: Block construction; Shingle roof; Slab foundation; Built area approximately 1,410 sq ft (living area)
- Exterior features: Outdoor grill; Sliding doors; Asphalt road access; Lot approximately 0.2 acres
Interior
- Kitchen: Range; Refrigerator
- Bedrooms: 3 bedrooms
- Flooring: Ceramic tile
- Bathrooms: 2 full bathrooms
- Heating & cooling: Central heating (electric); Central air conditioning
- Interior features: Ceiling fans; Dry bar; Kitchen open to family room; Solid wood cabinets
- Laundry & utility: Washer hookup; Dryer hookup (electric); Laundry room; Laundry closet; Laundry in garage
Neighborhood map
What this means for you Summary
Snapshot
- This is a 3-bed/2.0-bath single-family listed at $18k.
Deal economics
- At list price, monthly cash flow is $2k ($19k/yr) — positive.
- The deal already cash-flows at list — no discount required.
- Meets the 1% rule at list price ($2k rent vs $18k).
- Recommended offer: $17k (3.0% below list) — sets the bar for market timing.
Location & tenants
- Location reads 80/100 on livability (#110 in FL, #1,693 nationally) — a professional / high-income tenant draw. Strengths: cost of living A+, housing A+, health & safety A+; Watch: schools F, commute F.
- Polk (suburban): math 39% / reading 43% proficiency, ranked #62 of 73 in FL (top 85%) — families likely to look elsewhere, expect single-tenant / working-renter base with shorter leases.
- Market conditions: Rents rising (+2.5%/yr); 341 active listings in the ZIP; 16 comparable units currently listed for rent nearby; rentals at typical pace (median 14d on market — plan ~3-4 weeks tenant-placement turnaround); 10,384 units permitted in Polk County in 2024 (1,716 in 5+ unit buildings).
- At $2,159/mo this rent would consume 46% of the median local household income ($56k/yr) (locally 1412% of renters already pay >50% of income on rent) — very limited rent-growth headroom before tenants either downsize or default.
Forward outlook
- Local home prices are declining (-3.0%/yr); year-one equity from $124 of loan paydown is wiped out by about $540 of value loss. Plan a longer hold.
- Polk County population projected at +33% by 2050 — long-run rental-demand tailwind backs the buy-and-hold thesis.
- At projected returns (-3.0% appreciation + 2.5% rent growth), your $5k cash investment doubles in ~1 year — after that, you're playing with house money.
Negotiation context
- It's been on market 55 days — a 3% lower offer ($17k) is reasonable based on typical stale-listing flexibility.
Risks & watch-outs
- Climate carrying-cost: severe wind risk, 99% chance of damaging wind over 30y; extreme-heat days projected 7→23/yr by 2055 (HVAC capex compounding) — expect insurance premiums to compound above CPI over the hold.
Questions for the listing agent
- It's been on market 55 days. Have you received any prior offers? Is the seller open to a 3% concession, seller financing, or rate buy-down credit?
- Built in 1960 — when were the roof, HVAC, electrical panel, plumbing, and water heater last replaced?
- Is there a deadline driving the sale (1031 exchange, divorce, estate, relocation)? That informs how much negotiation room exists.
- Schools are F-rated, which usually means shorter tenancies and higher turnover. Who's the typical renter profile here, and what's been the actual vacancy rate?
- The area grade is low — what's the realistic commute time and amenity access for the typical tenant pool here? Any planned neighborhood developments (good or bad) we should know about?
- What's the average days-on-market for RENTAL listings here right now (not sales)? A rising rental-DOM trend means longer vacancies and softer asking-rent achievability than the comps imply.
- What's the recent tenant-quality profile in this submarket — average credit score on applications, eviction rate, late-payment / NSF rate, and stable-employment percentage? A property-management company in the area should have these aggregated.
- How much new for-sale + rental construction is in the pipeline within 1–3 miles? Heavy new supply typically softens prices + rents 12–24 months out; constrained supply supports both.
Investment metrics
- 1% rule
- 12.00% ✓
- Cap rate
- 111.71%
- Cash-on-cash
- 376.50%
- DSCR
- 17.75
- GRM
- 0.7
CMA / ARV
No comps found within radius.
Projected returns pro-forma
-3.0% appreciation · 2.47% rent growth · sell at horizon
- IRR
- —
- Equity multiple
- 20.18×
- Total profit
- $96,684
- Equity at exit
- $2,684
- IRR
- —
- Equity multiple
- 42.54×
- Total profit
- $209,358
- Equity at exit
- $1,556
Cash invested: $5,040 (down + closing). Projections, not guarantees.
Landlord ↔ Tenant lean methodology
- Overall (STATE)
- 87 Strongly Landlord-Friendly
- State Florida
- 87 Strongly Landlord-Friendly · R+3
- County
- — inherits STATE
- City
- — inherits STATE
ZIP-level market 33880
- Home prices YoY
- -16.2%
- Rents YoY
- 2.5%
- Active inventory
- 341
- Price-to-rent
- 0.7×
Monthly cashflow live
- Estimated rent
- $2,159 high interval (Pro) →
- Mortgage (P&I)
- −$94
- Tax est. 1.5%
- −$22 /mo · $270/yr
- Insurance
- −$8
- HOA
- −$0
- Vacancy / Maint / Mgmt
- −$453
- Net cashflow
- $1,581
Break-even live
UW: 25.0% down · 7.5% · 30yr · 1.5% tax · 5.0% vac · 8.0% maint · 8.0% mgmt
Financing live
Cash to close
- Down payment
- $4,500
- Closing costs
- $540
- Reserves months
- —
- Total cash needed
- —
Loan-product check · same deal, 3 products live
Conventional
25% down · 7.5% · 30yr
- Down + closing
- —
- Monthly P&I
- —
- Monthly cashflow
- —
- DSCR
- —
- Eligible?
- —
Personal DTI + credit; lowest rate.
DSCR
20% down · 8.5% · 30yr
- Down + closing
- —
- Monthly P&I
- —
- Monthly cashflow
- —
- DSCR
- —
- Eligible?
- —
No personal income docs; deal must DSCR.
Hard money
10% down · 12.0% · 12mo
- Down + closing
- —
- Monthly P&I
- —
- Monthly cashflow
- —
- DSCR
- —
- Eligible?
- —
Short-term bridge; refi at stabilization.
Rent comps 16 comps
| Address | Beds | Baths | Sqft | Rent | $/sqft | DOM | Units | Dist |
|---|---|---|---|---|---|---|---|---|
| 919 S AVE SE Unit 1325030P Eloise, FL | 3.0 | 2.0 | 1722 | $2,954 | $1.72 | 2d | 1 | 0.06mi |
| 2249 9th St SE Winter Haven, FL | 3.0 | 2.0 | 1520 | $1,449 | $0.95 | 19d | 1 | 0.40mi |
| 123 Tremont Dr Winter Haven, FL | 4.0 | 3.0 | 1260 | $2,350 | $1.87 | 23d | 1 | 0.71mi |
| 227 W Lake Ina Dr Winter Haven, FL | 3.0 | 2.0 | 1764 | $2,500 | $1.42 | 23d | 1 | 0.72mi |
| 2005 N Lake Eloise Dr Winter Haven, FL | 3.0 | 2.0 | 1513 | $1,950 | $1.29 | 3d | 1 | 0.76mi |
| 2312 Isle Royale Ct SE Winter Haven, FL | 2.0 | 2.5 | 1280 | $1,499 | $1.17 | 3d | 1 | 0.85mi |
| 513 Avenue J SE Winter Haven, FL | 2.0 | 1.0 | 875 | $1,350 | $1.54 | 14d | 1 | 0.87mi |
| 2374 Isle Royale Ct SE Winter Haven, FL | 2.0 | 1.5 | 1320 | $1,700 | $1.29 | 23d | 1 | 0.88mi |
| 2001 San Marcos Dr SE #11 Winter Haven, FL | 2.0 | 2.0 | 960 | $1,325 | $1.38 | 14d | 1 | 0.95mi |
| 200 Avenue K SE Winter Haven, FL | 1.0–3.0 | 1.0–2.0 | 1095 | $1,735 | $1.58 | 2d | 45 | 0.97mi |
| 611 Avenue G SE Winter Haven, FL | 2.0 | 1.0 | 875 | $1,299 | $1.48 | 3d | 1 | 1.00mi |
| 403 Avenue J SE Winter Haven, FL | 2.0 | 1.0 | 1000 | $1,550 | $1.55 | 23d | 1 | 1.01mi |
| 609 Avenue G SE Winter Haven, FL | 2.0 | 1.0 | 875 | $1,399 | $1.60 | 23d | 1 | 1.01mi |
| 601 2nd St SE Winter Haven, FL | 3.0 | 1.0 | 1072 | $1,195 | $1.11 | 3d | 1 | 1.28mi |
| 332 Avenue D SE Winter Haven, FL | 2.0 | 2.0 | 1090 | $1,800 | $1.65 | 3d | 1 | 1.30mi |
| 106 Avenue D SW Winter Haven, FL | 2.0 | 1.0 | 920 | $1,600 | $1.74 | 3d | 1 | 1.46mi |
Listing history 8 events
-
2026-05-18status Pending
-
2026-05-18price $18,000
-
2026-05-18price $105,900
-
2026-05-06price $280,000
-
2026-04-06price $195,000
-
2026-03-23$250,000 Active
-
2023-12-05soldstatus $245,000
-
1996-06-18soldstatus $135,000
ⓘ Source: listings_history table (triggers on properties + properties_extension) + one-shot
backfill from property_details.listing_events for pre-trigger history.
Climate risk First Street
- Flood 1/10 Low FEMA zone X (unshaded) · 0% chance over 30 yrs
- Wildfire 3/10 Moderate
- Heat 8/10 Severe 7 d/yr ≥107°F today · 23 d/yr by 30 yrs out
- Wind 10/10 Extreme 99% chance of damaging wind over 30 yrs
- Air quality 2/10 Low 0 unhealthy d/yr today · 2 by 30 yrs out
Nearby sold comps map
Loading sold comps map…
Walkable amenities ~0.75 mi
Loading nearby amenities…
Taxation est. · year 1
- Rental income
- $25,909
- − Mortgage interest
- −$1,008
- − Property taxes
- −$270
- − Insurance
- −$90
- − Repairs & maintenance
- −$2,073
- − Management
- −$2,073
- − Depreciation
- −$524
- Taxable income
- $19,872
- Est. tax owed @ 24.0%
- −$4,769
- After-tax cash flow
- $14,206/yr
For passive investors: Depreciation is non-cash, so a rental often shows a tax loss while cash-flowing — sheltering income. Rental losses are passive: they offset passive income freely, and up to $25,000/yr can offset ordinary (W-2) income if you actively participate and your MAGI is under $100k (phasing out to $0 by $150k); unused losses carry forward. On sale, claimed depreciation is recaptured at up to 25%, and gains may owe capital-gains tax (a 1031 exchange can defer both). Figures are a year-1 estimate at your 24.0% rate — not tax advice; consult a CPA.
Schools (NCES district)
- District
- Polk
- NCES district ID
- 1201590
- Math proficiency
- 39% ▼ -11.00%
- Reading proficiency
- 43% ▼ -4.00%
- Median HH income
- $43,979
- Composite
- 34.74/100
- National rank
- #5132
- State rank
- #62 of 73 in FL
Livability — Cypress Gardens
- Score
- 80/100
- State rank
- #110
- US rank
- #1693
Category grades
Schools grade is shown separately in the Schools card above.
Census & demographics
- Census place
- Cypress Gardens, FL
- County
- Polk County · 740,051 people
- Metro
- Lakeland-Winter Haven, FL
- Population (ZIP)
- 43,371
- Household income
- $56,390
- Rent vs Own
- Severe rent burden
- 1412.0
Population outlook (Polk County) Hauer SSP2
- Today (2025)
- 752,975 people
- By 2030
- 804,621 · +6.9%
- By 2040
- 906,117 · +20.3%
- By 2050
- 1,000,476 · +32.9%
- By 2075
- 1,197,520 · +59.0%
- By 2100
- 1,271,518 · +68.9%
Race, ethnicity, and origin ACS 2023
- Neighborhood character
- Diverse neighborhood (Simpson 0.65)
- Race & ethnicity
- White 49% Hispanic / Latino 27% Black 17% Two or more races 14% Asian 1%
- Hispanic origin (detail)
- Mexican 11% Puerto Rican 10% Cuban 2%
- Common ancestry
- Hispanic 2% Lithuanian 1% Italian 1%
- Foreign-born
- 9% · Canada, Jamaica
- Languages at home
- 74% English-only · Spanish 21% French/Haitian/Cajun 4%
Political lean MEDSL · Polk
- 2024 margin
- Strong R (+20.7) · D 39.2% · R 59.9%
- 2008→2024 swing
- -14.6pp toward R · 2008: -6.1pp · 2024: -20.7pp
- All cycles
- 2024: R+20.7 2020: R+14.4 2016: R+14.1 2012: R+6.8 2008: R+6.1
Not yet ingested
- Civics
- —
Market trends
- HPI YoY
- ▼ -61.41%
- Current HPI
- 317.8788
- Rent YoY
- ▲ 2.47%
- Metro
- Lakeland-Winter Haven, FL
- State GDP YoY
- ▲ 3.28%
- F500 in state
- 36
Industry mix (Fortune 500 HQ in FL)
| Industry | F500 HQs | Revenue |
|---|---|---|
| Industrial Technology | 2 | $29B |
|
||
| Insurance | 2 | $17B |
|
||
| Retail | 1 | $60B |
|
||
| Technology Distribution | 1 | $58B |
|
||
| Homebuilding | 1 | $35B |
|
||
| Technology Manufacturing | 1 | $35B |
|
||
Price history
-86.7% since first listed8 events — show timeline
- 2026-05-18 Pending — Stellar MLS as Distributed by MLS Grid
- 2026-05-18 Price Changed $18,000 Stellar MLS as Distributed by MLS Grid
- 2026-05-18 Price Changed $105,900 Stellar MLS as Distributed by MLS Grid
- 2026-05-06 Price Changed $280,000 Stellar MLS as Distributed by MLS Grid
- 2026-04-06 Price Changed $195,000 Stellar MLS as Distributed by MLS Grid
- 2026-03-23 Listed $250,000 Stellar MLS as Distributed by MLS Grid
- 2023-12-05 Sold (Public Records) $245,000 Public Records
- 1996-06-18 Sold (Public Records) $135,000 Public Records
Property tax history
+9.2%/yrLatest (2025): $3,545 · -2.2% YoY. Source: county tax records.
Cash-flow waterfall
monthlySold comps — $/sqft
last 12 mo · ≤1 miLoading sold comps…