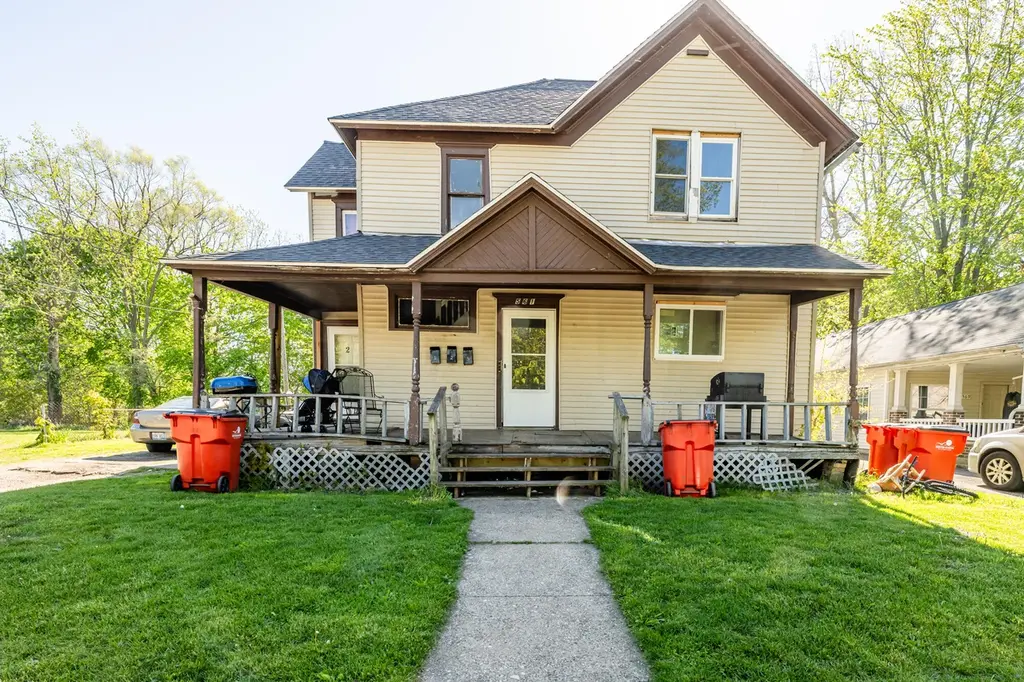
561 Heck Ct · Benton Harbor, MI
Flood risk 1/10 · Minimal
- FEMA flood zone
- X (unshaded)
- Chance of flooding over 30 yrs
- 0.0%
- Est. flood insurance / yr
- $473 – $860
Fire risk 1/10 · Minimal
- Est. fire insurance / yr
- $784 – $1,456
Heat risk 2/10 · Minimal
- Hot days now (above 100°F)
- 7 days/yr
- Hot days in 30 yrs
- 14 days/yr
Wind risk 2/10 · Minimal
- Chance of severe wind over 30 yrs
- —
Air-quality risk 3/10 · Minor
- Unhealthy air days now
- 2 days/yr
- Unhealthy air days in 30 yrs
- 3 days/yr
Risk factors via First Street. Map © Google.
Why this score? — see what drove the C grade
The composite is a weighted blend of 9 inputs, each scored 0–100. Each bar is that input's sub-score; the figure is the points it added to the 100-point composite (weight × sub-score).
- Cash flow +30.0/30.0
- 1% rule +10.0/10.0
- DSCR +10.0/10.0
- Livability +2.8/5.0
- Rent growth +2.5/5.0
- Condition / age +2.5/5.0
- Schools +0.8/10.0
- ARV discount +0.0/15.0
- Appreciation +0.0/10.0
$86,999
🖨 Deal sheet (PDF) 📄 Offer letter ✓ Due diligence
Listing remarks MLS
Investment opportunity in the City of Benton Harbor! This 3-unit multifamily property at 561 Heck Ct is already generating $1,850/month in rental income with long-term tenants in place on month-to-month leases, offering immediate cash flow and future flexibility for investors. Major mechanical updates have already been completed, including a newer roof that is just over 1 year old and three separate furnaces all under 5 years old. Conveniently located near local amenities and positioned for continued rental demand, this property is a solid addition to any investment portfolio--whether you're looking to expand your holdings or get started in multifamily investing. Call for your private showing today!
Key facts
- Rental demand
- Newer roof
- Multifamily property
Tags
Property features AI
Finance
- Financial info: Rental income: Unit rents listed as $650, $650 and $550
Exterior
- Parking: Total of 4 parking spaces; Other parking features (unspecified)
- Utilities: Public water; Public sewer; Electricity connected; Natural gas connected
- Home design: Multi-family residential income property; Two-story building (units on main and upper levels); Subdivision: CHASES; Cross street near Britain and Pipestone
- Construction: Vinyl siding; Wood siding; Composition roof
- Exterior features: Level lot; Paved road access; Publicly maintained road
Interior
- Bedrooms: Main-level 1-bedroom unit; Upper-level 2-bedroom unit; Main-level additional unit (studio/bedroom not specified)
- Bathrooms: One bathroom in each unit
- Heating & cooling: Forced air heating; Natural gas heating
- Interior features: Partial basement
- Laundry & utility: No laundry on-site (none listed)
Neighborhood map
What this means for you Summary
Snapshot
- This is a 4-bed/3.0-bath single-family listed at $87k.
Deal economics
- At list price, monthly cash flow is $622 ($7k/yr) — positive.
- The deal already cash-flows at list — no discount required.
- Meets the 1% rule at list price ($2k rent vs $87k).
- Recommended offer: $86k (1.5% below list) — sets the bar for market timing.
- Cap rate 14.9% vs local median 8.3% in Benton Harbor — top-decile yield for the area; either an underpriced asset or a hidden risk that comps aren't pricing in. Stress-test before assuming the spread holds.
Location & tenants
- Location reads 55/100 on livability (#671 in MI) — a working-class tenant base; expect higher turnover. Strengths: cost of living A+, housing A+, health & safety A-; Watch: crime F, amenities F, commute F.
- Benton Harbor Area Schools (urban): math 4% / reading 7% proficiency, ranked #732 of 760 in MI (top 96%) — low school quality limits family demand, transient renter base, plan for 1-2y turnover; 89% free/reduced lunch — lower-income household profile, screen leases tightly.
- Zoned schools: Fair Plain Middle School (math 0% / reading 4%, grade F, #493 of 493 statewide, top 100%, 288 students, 97% FRL); Fair Plain Middle School (math 0% / reading 4%, grade F, #493 of 493 statewide, top 100%, 288 students, 97% FRL); Benton Harbor High School (math 5% / reading 5%, grade F, #704 of 713 statewide, top 100%, 495 students, 97% FRL).
- Market conditions: 184 active listings in the ZIP; 397 units permitted in Berrien County in 2024 (40 in 5+ unit buildings).
Forward outlook
- Local home prices are declining (-3.0%/yr); year-one equity from $601 of loan paydown is wiped out by about $3k of value loss. Plan a longer hold.
- Berrien County population projected at -16% by 2050 — secular population decline; favor cash flow + early exit over multi-decade hold.
- At projected returns (-3.0% appreciation + 3.0% rent growth), your $24k cash investment doubles in ~4 years — after that, you're playing with house money.
Negotiation context
- It's been on market 29 days — a 2% lower offer ($86k) is reasonable based on typical stale-listing flexibility.
- 13 sale attempts since 13y ago with the ask held roughly flat each time — persistent listings suggest the price (not the market) is what's stuck; bring a comps-based counter.
- Current owner paid $60k; 45% above their basis — modest negotiation headroom, anchor on the comps not their cost.
Risks & watch-outs
- Watch-outs: built in 1912 — expect roof / HVAC / electrical / plumbing capex.
Questions for the listing agent
- Built in 1912 — when were the roof, HVAC, electrical panel, plumbing, and water heater last replaced?
- Is there a deadline driving the sale (1031 exchange, divorce, estate, relocation)? That informs how much negotiation room exists.
- Schools are F-rated, which usually means shorter tenancies and higher turnover. Who's the typical renter profile here, and what's been the actual vacancy rate?
- Crime grade is F in this area — have there been break-ins, vandalism, or insurance claims at this property in the last 3 years? What carrier currently insures it and at what premium?
- What's the average days-on-market for RENTAL listings here right now (not sales)? A rising rental-DOM trend means longer vacancies and softer asking-rent achievability than the comps imply.
- What's the recent tenant-quality profile in this submarket — average credit score on applications, eviction rate, late-payment / NSF rate, and stable-employment percentage? A property-management company in the area should have these aggregated.
- How much new for-sale + rental construction is in the pipeline within 1–3 miles? Heavy new supply typically softens prices + rents 12–24 months out; constrained supply supports both.
Investment metrics
- 1% rule
- 1.74% ✓
- Cap rate
- 14.88%
- Cash-on-cash
- 30.65%
- DSCR
- 2.36
- GRM
- 4.8
CMA / ARV
- ARV (median comp)
- $62,787
- List price
- $86,999
- Delta
- 59.27%
- Verdict
- OVERPRICED
- Comps
- 5 within 1.0 mi
Show comp detail 3 sales within ~0.75 mi
| Address | Dist | Beds/Ba | Sqft | Sold | Price | $/sf | Match |
|---|---|---|---|---|---|---|---|
| 576 Colfax Ave | 0.59mi | 4/2.5 | 2,470 (-3%) | 7mo | $295,000 | $119 | 58 |
| 749 Pipestone St | 0.24mi | 3/2.0 (-1) | 2,288 (-11%) | 13mo | $237,114 | $104 | 51 |
| 600 Territorial Rd | 0.74mi | 4/1.5 | 2,239 (-12%) | 18mo | $115,000 | $51 | 24 |
Match score weights: distance 35% · size 25% · config 20% · recency 20%. Top-matched comps best support the ARV.
Projected returns pro-forma
-3.0% appreciation · 3.0% rent growth · sell at horizon
- IRR
- 25.4%
- Equity multiple
- 2.05×
- Total profit
- $25,541
- Equity at exit
- $12,972
- IRR
- 33.1%
- Equity multiple
- 4.01×
- Total profit
- $73,300
- Equity at exit
- $7,522
Cash invested: $24,360 (down + closing). Projections, not guarantees.
Landlord ↔ Tenant lean methodology
- Overall (STATE)
- 62 Landlord-Friendly
- State Michigan
- 62 Landlord-Friendly · EVEN
- County
- — inherits STATE
- City
- — inherits STATE
ZIP-level market 49022
- Active inventory
- 184
- Price-to-rent
- 4.8×
Monthly cashflow live
- Estimated rent
- $1,515 medium interval (Pro) →
- Mortgage (P&I)
- −$456
- Tax from tax record
- −$82 /mo · $987/yr
- Insurance
- −$36
- HOA
- −$0
- Vacancy / Maint / Mgmt
- −$318
- Net cashflow
- $622
Break-even live
Sensitivity live
| Price | -10% $672 | -5% $647 | +0% $622 | +5% $598 | +10% $573 |
|---|---|---|---|---|---|
| Rent | -10% $503 | -5% $562 | +0% $622 | +5% $682 | +10% $742 |
| Rate | -1.0pp $666 | -0.5pp $644 | base $622 | +0.5pp $600 | +1.0pp $577 |
UW: 25.0% down · 7.5% · 30yr · 1.5% tax · 5.0% vac · 8.0% maint · 8.0% mgmt
Financing live
Cash to close
- Down payment
- $21,750
- Closing costs
- $2,610
- Reserves months
- —
- Total cash needed
- —
Loan-product check · same deal, 3 products live
Conventional
25% down · 7.5% · 30yr
- Down + closing
- —
- Monthly P&I
- —
- Monthly cashflow
- —
- DSCR
- —
- Eligible?
- —
Personal DTI + credit; lowest rate.
DSCR
20% down · 8.5% · 30yr
- Down + closing
- —
- Monthly P&I
- —
- Monthly cashflow
- —
- DSCR
- —
- Eligible?
- —
No personal income docs; deal must DSCR.
Hard money
10% down · 12.0% · 12mo
- Down + closing
- —
- Monthly P&I
- —
- Monthly cashflow
- —
- DSCR
- —
- Eligible?
- —
Short-term bridge; refi at stabilization.
Listing history 47 events
-
2026-06-22days on market $86,999 Active 29 DOM
-
2026-06-19days on market $86,999 Active 27 DOM
-
2026-06-18days on market $86,999 Active 26 DOM
-
2026-06-17days on market $86,999 Active 25 DOM
-
2026-06-16days on market $86,999 Active 24 DOM
-
2026-06-15price $86,999 Active 23 DOM
Show marketing remark (708 chars)
Investment opportunity in the City of Benton Harbor! This 3-unit multifamily property at 561 Heck Ct is already generating $1,850/month in rental income with long-term tenants in place on month-to-month leases, offering immediate cash flow and future flexibility for investors. Major mechanical updates have already been completed, including a newer roof that is just over 1 year old and three separate furnaces all under 5 years old. Conveniently located near local amenities and positioned for continued rental demand, this property is a solid addition to any investment portfolio--whether you're looking to expand your holdings or get started in multifamily investing. Call for your private showing today!
-
2026-06-15days on market $89,999 Active 23 DOM
Show marketing remark (708 chars)
Investment opportunity in the City of Benton Harbor! This 3-unit multifamily property at 561 Heck Ct is already generating $1,850/month in rental income with long-term tenants in place on month-to-month leases, offering immediate cash flow and future flexibility for investors. Major mechanical updates have already been completed, including a newer roof that is just over 1 year old and three separate furnaces all under 5 years old. Conveniently located near local amenities and positioned for continued rental demand, this property is a solid addition to any investment portfolio--whether you're looking to expand your holdings or get started in multifamily investing. Call for your private showing today!
-
2026-06-14days on market $89,999 Active 21 DOM
-
2026-06-13days on market $89,999 Active 20 DOM
-
2026-06-10days on market $89,999 Active 18 DOM
-
2026-06-09days on market $89,999 Active 17 DOM
-
2026-06-08days on market $89,999 Active 16 DOM
-
2026-06-07days on market $89,999 Active 15 DOM
-
2026-06-03days on market $89,999 Active 11 DOM
-
2026-06-02days on market $89,999 Active 10 DOM
-
2026-06-01days on market $89,999 Active 9 DOM
-
2026-05-31days on market $89,999 Active 8 DOM
-
2026-05-30days on market $89,999 Active 7 DOM
-
2026-05-14price $94,999 520-char remark
-
2026-05-14price $94,999 520-char remark
-
2026-03-05status Active 520-char remark
-
2026-03-05status Active 520-char remark
-
2026-02-12historical Accepting Backup Offers 520-char remark
-
2026-02-12historical Active Under Contract 520-char remark
-
2026-01-16price $99,999 520-char remark
-
2026-01-15price $99,999 520-char remark
-
2026-01-07$109,999 Active 520-char remark
-
2026-01-07$109,999 Active 520-char remark
-
2026-01-05historical
-
2026-01-05historical
-
2025-12-15price $109,999
-
2025-12-14price $109,999
-
2025-12-10$119,999 Active
-
2025-12-10$119,999 Active
-
2024-10-16soldstatus $59,900
-
2024-10-11soldstatus $59,900 Sold
-
2024-10-11soldstatus $59,900 Closed
-
2024-10-03historical Accepting Backup Offers
-
2024-10-03historical Accepting Backup Offers
-
2024-09-27$67,900 Active
-
2024-09-27$67,900 Active
-
2015-03-11soldstatus $12,900
-
2015-03-11soldstatus $12,900
-
2015-02-05$12,900
-
2015-02-05$12,900
-
2014-09-17historical
-
2013-11-07$17,820
ⓘ Source: listings_history table (triggers on properties + properties_extension) + one-shot
backfill from property_details.listing_events for pre-trigger history.
Tax reassessment forecast MI · Partial reset (capped growth)
- Current annual tax
- $987 · $82/mo
- Projected year-2 tax
- $1,163 · $97/mo
- Expected delta
- +$176/yr (+$15/mo · 17.9%)
ⓘ Screening estimate from a state-policy table — verify with the county assessor before closing.
Climate risk First Street
- Flood 1/10 Low FEMA zone X (unshaded) · 0% chance over 30 yrs
- Wildfire 1/10 Low
- Heat 2/10 Low 7 d/yr ≥100°F today · 14 d/yr by 30 yrs out
- Wind 2/10 Low
- Air quality 3/10 Moderate 2 unhealthy d/yr today · 3 by 30 yrs out
Nearby sold comps map
Loading sold comps map…
Walkable amenities ~0.75 mi
Loading nearby amenities…
Taxation est. · year 1
- Rental income
- $18,182
- − Mortgage interest
- −$4,873
- − Property taxes
- −$987
- − Insurance
- −$435
- − Repairs & maintenance
- −$1,455
- − Management
- −$1,455
- − Depreciation
- −$2,531
- Taxable income
- $6,447
- Est. tax owed @ 24.0%
- −$1,547
- After-tax cash flow
- $5,920/yr
For passive investors: Depreciation is non-cash, so a rental often shows a tax loss while cash-flowing — sheltering income. Rental losses are passive: they offset passive income freely, and up to $25,000/yr can offset ordinary (W-2) income if you actively participate and your MAGI is under $100k (phasing out to $0 by $150k); unused losses carry forward. On sale, claimed depreciation is recaptured at up to 25%, and gains may owe capital-gains tax (a 1031 exchange can defer both). Figures are a year-1 estimate at your 24.0% rate — not tax advice; consult a CPA.
Schools (NCES district)
- District
- Benton Harbor Area Schools
- NCES district ID
- 2604830
- Math proficiency
- 4% ▬ 0.00%
- Reading proficiency
- 7% ▬ 0.00%
- Median HH income
- $27,038
- Composite
- 7.53/100
- National rank
- #14787
- State rank
- #732 of 760 in MI
Livability — Benton Harbor
- Score
- 55/100
- State rank
- #671
- US rank
- #23724
Category grades
Schools grade is shown separately in the Schools card above.
Census & demographics
- Census place
- Benton Harbor, MI
- Population (ZIP)
- 29,796
Population outlook (Berrien County) Hauer SSP2
- Today (2025)
- 149,273 people
- By 2030
- 145,211 · -2.7%
- By 2040
- 135,435 · -9.3%
- By 2050
- 125,543 · -15.9%
- By 2075
- 103,986 · -30.3%
- By 2100
- 82,256 · -44.9%
Race, ethnicity, and origin ACS 2023
- Neighborhood character
- Diverse neighborhood (Simpson 0.61)
- Race & ethnicity
- Black 50% White 37% Hispanic / Latino 7% Two or more races 6% Native American 2%
- Hispanic origin (detail)
- Mexican 6%
- Common ancestry
- Romanian 1% Lithuanian 1% Slovak 1%
- Foreign-born
- 3% · Canada
- Languages at home
- 94% English-only · Spanish 5%
Political lean MEDSL · Berrien
- 2024 margin
- Lean R (+7.9) · D 45.4% · R 53.2% · Other 1.4%
- 2008→2024 swing
- -13.3pp toward R · 2008: 5.5pp · 2024: -7.9pp
- All cycles
- 2024: R+7.9 2020: R+7.4 2016: R+12.7 2012: R+6.6 2008: D+5.5
Not yet ingested
- Civics
- —
Market trends
- HPI YoY
- ▼ -309.81%
- Current HPI
- 209.9723
- Rent YoY
- —
- Metro
- —
- State GDP YoY
- ▲ 1.37%
- F500 in state
- 28
Industry mix (Fortune 500 HQ in MI)
| Industry | F500 HQs | Revenue |
|---|---|---|
| Automotive Parts | 3 | $48B |
|
||
| Automotive | 2 | $372B |
|
||
| Chemicals | 1 | $45B |
|
||
| Automotive Retail | 1 | $29B |
|
||
| Healthcare / Medical Devices | 1 | $23B |
|
||
| Automotive Technology | 1 | $20B |
|
||
Price history
+388.2% since first listed35 events — show timeline
- 2026-06-15 Price Changed $86,999 MiRealSource-MiMLS
- 2026-06-15 Price Changed $86,999 REALCOMP
- 2026-05-23 Listed $89,999 REALCOMP
- 2026-05-23 Listed $89,999 MiRealSource-MiMLS
- 2026-05-22 Listing Removed — MiRealSource-MiMLS
- 2026-05-22 Listing Removed — REALCOMP
- 2026-05-14 Price Changed $94,999 MiRealSource-MiMLS
- 2026-05-14 Price Changed $94,999 REALCOMP
- 2026-03-05 Relisted — REALCOMP
- 2026-03-05 Relisted — MiRealSource-MiMLS
- 2026-02-12 Contingent — MiRealSource-MiMLS
- 2026-02-12 Contingent — REALCOMP
- 2026-01-16 Price Changed $99,999 MiRealSource-MiMLS
- 2026-01-15 Price Changed $99,999 REALCOMP
- 2026-01-07 Listed $109,999 MiRealSource-MiMLS
- 2026-01-07 Listed $109,999 REALCOMP
- 2026-01-05 Listing Removed — MiRealSource-MiMLS
- 2026-01-05 Listing Removed — REALCOMP
- 2025-12-15 Price Changed $109,999 MiRealSource-MiMLS
- 2025-12-14 Price Changed $109,999 REALCOMP
- 2025-12-10 Listed $119,999 REALCOMP
- 2025-12-10 Listed $119,999 MiRealSource-MiMLS
- 2024-10-16 Sold (Public Records) $59,900 Public Records
- 2024-10-11 Sold (MLS) $59,900 MiRealSource-MiMLS
- 2024-10-11 Sold (MLS) $59,900 REALCOMP
- 2024-10-03 Contingent — REALCOMP
- 2024-10-03 Contingent — MiRealSource-MiMLS
- 2024-09-27 Listed $67,900 MiRealSource-MiMLS
- 2024-09-27 Listed $67,900 REALCOMP
- 2015-03-11 Sold (MLS) $12,900 SW Michigan MLS
- 2015-03-11 Sold (MLS) $12,900 REALCOMP
- 2015-02-05 Listed $12,900 SW Michigan MLS
- 2015-02-05 Listed $12,900 REALCOMP
- 2014-09-17 Listing Removed — SW Michigan MLS
- 2013-11-07 Listed $17,820 SW Michigan MLS
Property tax history
+12.4%/yrLatest (2024): $987 · -61.4% YoY. Source: county tax records.
Cash-flow waterfall
monthlySold comps — $/sqft
last 12 mo · ≤1 miLoading sold comps…