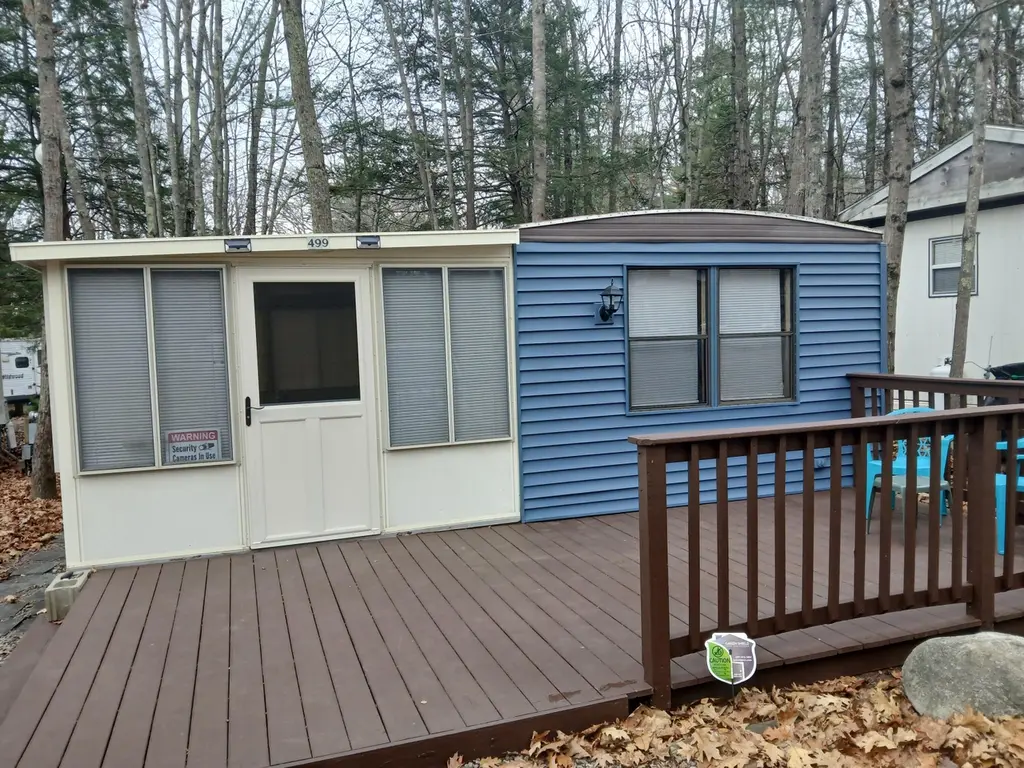
7 Oregon Ave #499 · Old Orchard Beach, ME
Flood risk 1/10 · Minimal
- FEMA flood zone
- C
- Chance of flooding over 30 yrs
- 0.0%
- Est. flood insurance / yr
- $591 – $1,051
Fire risk 2/10 · Minimal
- Est. fire insurance / yr
- $669 – $1,243
Heat risk 4/10 · Minor
- Hot days now (above 89°F)
- 7 days/yr
- Hot days in 30 yrs
- 17 days/yr
Wind risk 6/10 · Moderate
- Chance of severe wind over 30 yrs
- 65.0%
Air-quality risk 2/10 · Minimal
- Unhealthy air days now
- 1 days/yr
- Unhealthy air days in 30 yrs
- 1 days/yr
Risk factors via First Street. Map © Google.
Why this score? — see what drove the D+ grade
The composite is a weighted blend of 9 inputs, each scored 0–100. Each bar is that input's sub-score; the figure is the points it added to the 100-point composite (weight × sub-score).
- Cash flow +15.0/30.0
- ARV discount +7.5/15.0
- Schools +6.7/10.0
- 1% rule +5.0/10.0
- DSCR +5.0/10.0
- Rent growth +3.7/5.0
- Livability +3.4/5.0
- Condition / age +2.5/5.0
- Appreciation +0.0/10.0
$24,900
🖨 Deal sheet (PDF) 📄 Offer letter ✓ Due diligence
Listing remarks
New Price includes 2026 seasonal fee!! Here's your perfect affordable seasonal retreat in Old Orchard Beach! 1989 Quailridge Cobra Park Model updated in 2024 with 2 bedrooms / 1 bath - plenty of space for everyone! Close to town, the beach, the pier and shopping! Pinehirst Campground offers tons of amenities including a clubhouse, pools, basketball & tennis courts for fun all summer long! Seasonal, May 1st to October 31st, large Florida room, deck with water views of the pond.
Key facts
- Parking
- Pool
- Built 1989
Property features AI
Finance
- Other: Located on/near a cul-de-sac, wooded setting, near golf course, near public beach, near turnpike/interstate, and near town; Road surface: gravel and dirt; Zoning: R-4; In-ground pool
- Financial info: Land lease in place
- HOA & community: Association with annual fee; Clubhouse
Exterior
- Parking: 1–4 parking spaces on gravel
- Utilities: Public sewer; Public and seasonal water; Gas water heater; Electric with circuit breakers
- Home design: Mobile home; Built in 1989; Flat metal roof
- Construction: Vinyl siding; Mobile construction
- Exterior features: Deck; Tennis court(s); Shed(s); Pond view
Interior
- Kitchen: Refrigerator; Microwave; Dishwasher; Cooktop
- Bedrooms: Bedroom 1 on the first floor; Bedroom 2 on the first floor
- Flooring: Linoleum
- Bathrooms: One full bathroom
- Heating & cooling: Space heater
- Interior features: Five total rooms; Partially furnished; First-floor bedroom
Neighborhood map
What this means for you Summary
Snapshot
- This is a 2-bed/1.0-bath single-family listed at $25k.
Deal economics
- At list price, monthly cash flow is $780 ($9k/yr) — positive.
- The deal already cash-flows at list — no discount required.
- Meets the 1% rule at list price ($2k rent vs $25k).
- Recommended offer: $24k (3.0% below list) — sets the bar for market timing.
- Cap rate 43.9% vs local median 2.0% in Old Orchard Beach — top-decile yield for the area; either an underpriced asset or a hidden risk that comps aren't pricing in. Stress-test before assuming the spread holds.
Location & tenants
- Location reads 68/100 on livability (#88 in ME) — a middle-class / working-renter tenant base. Strengths: crime A+, housing A+, cost of living B+; Watch: amenities F, commute F, health & safety F.
- RSU 23 (suburban): math 78% / reading 80% proficiency, ranked #87 of 112 in ME (top 78%) — strong family-tenant draw, lease renewals of 3-5y typical.
- Zoned schools: Jameson Elementary School (184 students, 41% FRL); Loranger Memorial School (math 77% / reading 78%, grade A+, #73 of 85 statewide, top 87%, 279 students, 42% FRL); Old Orchard Beach High School (math 95% / reading 95%, grade A+, #12 of 108 statewide, top 15%, 203 students, 35% FRL) — zoned schools at 39% FRL track the district average.
- Market conditions: Rents rising fast (+4.9%/yr); 175 active listings in the ZIP; 1,386 units permitted in York County in 2024 (338 in 5+ unit buildings).
- This rent runs 39% of the median local income ($60k/yr) — at the standard rent-burdened threshold; future hikes will face affordability resistance.
Forward outlook
- Local home prices are declining (-3.0%/yr); year-one equity from $172 of loan paydown is wiped out by about $747 of value loss. Plan a longer hold.
- At projected returns (-3.0% appreciation + 4.9% rent growth), your $7k cash investment doubles in ~1 year — after that, you're playing with house money.
Negotiation context
- It's been on market 55 days — a 3% lower offer ($24k) is reasonable based on typical stale-listing flexibility.
- 2 sale attempts; this cycle's ask has dropped $14k (36%) from the opening price — seller is motivated, your offer sets the floor, not the list.
Risks & watch-outs
- Watch-outs: HOA is 30% of rent.
- Climate carrying-cost: major wind risk, 65% chance of damaging wind over 30y — expect insurance premiums to compound above CPI over the hold.
Questions for the listing agent
- It's been on market 55 days. Have you received any prior offers? Is the seller open to a 3% concession, seller financing, or rate buy-down credit?
- What does the HOA fee cover, when was the last increase, and are there any pending special assessments or reserve-fund shortfalls?
- Is there a deadline driving the sale (1031 exchange, divorce, estate, relocation)? That informs how much negotiation room exists.
- Schools are D-rated, which usually means shorter tenancies and higher turnover. Who's the typical renter profile here, and what's been the actual vacancy rate?
- The area grade is low — what's the realistic commute time and amenity access for the typical tenant pool here? Any planned neighborhood developments (good or bad) we should know about?
- What's the average days-on-market for RENTAL listings here right now (not sales)? A rising rental-DOM trend means longer vacancies and softer asking-rent achievability than the comps imply.
- What's the recent tenant-quality profile in this submarket — average credit score on applications, eviction rate, late-payment / NSF rate, and stable-employment percentage? A property-management company in the area should have these aggregated.
- How much new for-sale + rental construction is in the pipeline within 1–3 miles? Heavy new supply typically softens prices + rents 12–24 months out; constrained supply supports both.
Investment metrics
- 1% rule
- 7.75% ✓
- Cap rate
- 43.87%
- Cash-on-cash
- 134.21%
- DSCR
- 6.97
- GRM
- 1.1
CMA / ARV
- ARV (median comp)
- $68,128
- List price
- $24,900
- Delta
- -63.45%
- Verdict
- UNDERPRICED
- Comps
- 7 within 1.0 mi
Show comp detail 1 sale within ~0.75 mi
| Address | Dist | Beds/Ba | Sqft | Sold | Price | $/sf | Match |
|---|---|---|---|---|---|---|---|
| 1 Ryefield Dr | 0.49mi | 1/1.0 (-1) | 672 (-4%) | 15mo | $370,000 | $551 | 53 |
Match score weights: distance 35% · size 25% · config 20% · recency 20%. Top-matched comps best support the ARV.
Projected returns pro-forma
-3.0% appreciation · 4.93% rent growth · sell at horizon
- IRR
- —
- Equity multiple
- 8.15×
- Total profit
- $49,831
- Equity at exit
- $3,713
- IRR
- —
- Equity multiple
- 18.96×
- Total profit
- $125,199
- Equity at exit
- $2,153
Cash invested: $6,972 (down + closing). Projections, not guarantees.
Landlord ↔ Tenant lean methodology
- Overall (STATE)
- 41 Moderately Tenant-Leaning
- State Maine
- 41 Moderately Tenant-Leaning · D+2
- County
- — inherits STATE
- City
- — inherits STATE
ZIP-level market 04064
- Home prices YoY
- -11.6%
- Rents YoY
- 4.9%
- Active inventory
- 175
- Price-to-rent
- 1.1×
Monthly cashflow live
- Estimated rent
- $1,930 medium interval (Pro) →
- Mortgage (P&I)
- −$131
- Tax est. 1.5%
- −$31 /mo · $374/yr
- Insurance
- −$10
- HOA
- −$573
- Vacancy / Maint / Mgmt
- −$405
- Net cashflow
- $780
Break-even live
Sensitivity live
| Price | -10% $797 | -5% $788 | +0% $780 | +5% $771 | +10% $763 |
|---|---|---|---|---|---|
| Rent | -10% $627 | -5% $704 | +0% $780 | +5% $856 | +10% $932 |
| Rate | -1.0pp $792 | -0.5pp $786 | base $780 | +0.5pp $773 | +1.0pp $767 |
UW: 25.0% down · 7.5% · 30yr · 1.5% tax · 5.0% vac · 8.0% maint · 8.0% mgmt
Financing live
Cash to close
- Down payment
- $6,225
- Closing costs
- $747
- Reserves months
- —
- Total cash needed
- —
Loan-product check · same deal, 3 products live
Conventional
25% down · 7.5% · 30yr
- Down + closing
- —
- Monthly P&I
- —
- Monthly cashflow
- —
- DSCR
- —
- Eligible?
- —
Personal DTI + credit; lowest rate.
DSCR
20% down · 8.5% · 30yr
- Down + closing
- —
- Monthly P&I
- —
- Monthly cashflow
- —
- DSCR
- —
- Eligible?
- —
No personal income docs; deal must DSCR.
Hard money
10% down · 12.0% · 12mo
- Down + closing
- —
- Monthly P&I
- —
- Monthly cashflow
- —
- DSCR
- —
- Eligible?
- —
Short-term bridge; refi at stabilization.
HOA detail
- Monthly dues
- $573 · $6,876/yr
- Likely covers
- waterpool
Listing history 19 events
-
2026-06-21days on market $24,900 Active 55 DOM
-
2026-06-18days on market $24,900 Active 52 DOM
-
2026-06-17pricedays on market $24,900 Active 51 DOM
-
2026-06-16days on market $29,000 Active 50 DOM
-
2026-06-15days on market $29,000 Active 49 DOM
-
2026-06-14days on market $29,000 Active 47 DOM
-
2026-06-10days on market $29,000 Active 44 DOM
-
2026-06-09days on market $29,000 Active 43 DOM
-
2026-06-08days on market $29,000 Active 42 DOM
-
2026-06-07days on market $29,000 Active 41 DOM
-
2026-06-03days on market $29,000 Active 37 DOM
-
2026-06-02days on market $29,000 Active 36 DOM
-
2026-06-01days on market $29,000 Active 35 DOM
-
2026-05-31days on market $29,000 Active 34 DOM
-
2026-05-30days on market $29,000 Active 33 DOM
-
2026-05-15price $36,000 477-char remark
-
2026-04-27$39,000 Active 477-char remark
-
2025-08-19price $39,000
-
2025-08-06price $44,900
ⓘ Source: listings_history table (triggers on properties + properties_extension) + one-shot
backfill from property_details.listing_events for pre-trigger history.
Climate risk First Street
- Flood 1/10 Low FEMA zone C · 0% chance over 30 yrs
- Wildfire 2/10 Low
- Heat 4/10 Moderate 7 d/yr ≥89°F today · 17 d/yr by 30 yrs out
- Wind 6/10 Major 65% chance of damaging wind over 30 yrs
- Air quality 2/10 Low 1 unhealthy d/yr today · 1 by 30 yrs out
Nearby sold comps map
Loading sold comps map…
Walkable amenities ~0.75 mi
Loading nearby amenities…
Taxation est. · year 1
- Rental income
- $23,162
- − Mortgage interest
- −$1,395
- − Property taxes
- −$374
- − Insurance
- −$124
- − Repairs & maintenance
- −$1,853
- − Management
- −$1,853
- − HOA
- −$6,876
- − Depreciation
- −$724
- Taxable income
- $9,963
- Est. tax owed @ 24.0%
- −$2,391
- After-tax cash flow
- $6,966/yr
For passive investors: Depreciation is non-cash, so a rental often shows a tax loss while cash-flowing — sheltering income. Rental losses are passive: they offset passive income freely, and up to $25,000/yr can offset ordinary (W-2) income if you actively participate and your MAGI is under $100k (phasing out to $0 by $150k); unused losses carry forward. On sale, claimed depreciation is recaptured at up to 25%, and gains may owe capital-gains tax (a 1031 exchange can defer both). Figures are a year-1 estimate at your 24.0% rate — not tax advice; consult a CPA.
Schools (NCES district)
- District
- RSU 23
- NCES district ID
- 2314784
- Math proficiency
- 78% ▲ 51.00%
- Reading proficiency
- 80% ▲ 27.00%
- Median HH income
- $49,630
- Composite
- 66.79/100
- National rank
- #406
- State rank
- #87 of 112 in ME
Livability — Old Orchard Beach
- Score
- 68/100
- State rank
- #88
- US rank
- #9943
Category grades
Schools grade is shown separately in the Schools card above.
Census & demographics
- Census place
- Old Orchard Beach, ME
- County
- York County · 80,026 people
- City population
- 8,632
- Metro
- Portland-South Portland, ME
- Population (ZIP)
- 8,632
- Household income
- $59,887
- Rent vs Own
- Severe rent burden
- 441.0
Population outlook (York County) Hauer SSP2
- Today (2025)
- 209,961 people
- By 2030
- 212,816 · +1.4%
- By 2040
- 214,360 · +2.1%
- By 2050
- 210,350 · +0.2%
- By 2075
- 201,686 · -3.9%
- By 2100
- 183,392 · -12.7%
Race, ethnicity, and origin ACS 2023
- Neighborhood character
- Predominantly White (90%)
- Race & ethnicity
- White 90% Two or more races 6% Hispanic / Latino 3% Black 1% Native American 1%
- Common ancestry
- Lithuanian 9% Slovak 7% Romanian 3%
- Foreign-born
- 6% · Canada
- Languages at home
- 91% English-only · French/Haitian/Cajun 6% Russian/Polish/Slavic 1% Other Indo-European 1%
Political lean MEDSL · York
- 2024 margin
- D (+10.5) · D 54.3% · R 43.8% · Other 1.9%
- 2008→2024 swing
- -10.1pp toward R · 2008: 20.5pp · 2024: 10.5pp
- All cycles
- 2024: D+10.5 2020: D+12.6 2016: D+4.8 2012: D+16.4 2008: D+20.5
Not yet ingested
- Civics
- —
Market trends
- HPI YoY
- ▼ -64.32%
- Current HPI
- 489.543
- Rent YoY
- ▲ 4.93%
- Metro
- Portland-South Portland, ME
- State GDP YoY
- —
- F500 in state
- 0
Price history
-49.1% since first listed8 events — show timeline
- 2026-06-17 Price Changed $24,900 MREIS
- 2026-05-26 Price Changed $29,000 MREIS
- 2026-05-15 Price Changed $36,000 MREIS
- 2026-04-27 Listed $39,000 MREIS
- 2025-10-22 Delisted — MREIS
- 2025-08-19 Price Changed $39,000 MREIS
- 2025-08-06 Price Changed $44,900 MREIS
- 2025-07-08 Listed $48,900 MREIS
Cash-flow waterfall
monthlySold comps — $/sqft
last 12 mo · ≤1 miLoading sold comps…