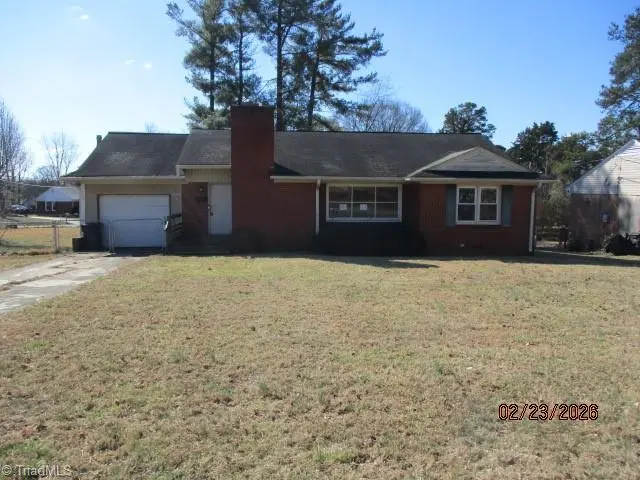
319 Western Blvd · Lexington, NC
Flood risk 1/10 · Minimal
- FEMA flood zone
- X (unshaded)
- Chance of flooding over 30 yrs
- 0.0%
- Est. flood insurance / yr
- $507 – $1,088
Fire risk 1/10 · Minimal
- Est. fire insurance / yr
- $906 – $1,684
Heat risk 6/10 · Moderate
- Hot days now (above 103°F)
- 7 days/yr
- Hot days in 30 yrs
- 17 days/yr
Wind risk 4/10 · Minor
- Chance of severe wind over 30 yrs
- 11.0%
Air-quality risk 2/10 · Minimal
- Unhealthy air days now
- 1 days/yr
- Unhealthy air days in 30 yrs
- 2 days/yr
Risk factors via First Street. Map © Google.
Why this score? — see what drove the C grade
The composite is a weighted blend of 9 inputs, each scored 0–100. Each bar is that input's sub-score; the figure is the points it added to the 100-point composite (weight × sub-score).
- Cash flow +19.2/30.0
- ARV discount +15.0/15.0
- DSCR +6.1/10.0
- 1% rule +4.4/10.0
- Livability +3.6/5.0
- Rent growth +3.3/5.0
- Schools +2.8/10.0
- Condition / age +2.5/5.0
- Appreciation +0.0/10.0
$169,000
🖨 Deal sheet 📄 Offer letter ✓ Due diligence
Listing remarks MLS
Great location for this 2 bedroom, 1 bath brick veneer home within minutes of Hwy. 64 W. and Business 85. Large living room with fireplace, kitchen & dining combination. One car-carport. This price includes an additional building lot beside of home - use for additional home or large play area. Beautiful neighborhood pool within walking distance of home.
Key facts
- Fenced perimeter
- Outbuilding
- Hallway closets
Tags
Property features AI
Finance
- HOA & community: No homeowners association; Subdivision: Western Heights
Exterior
- Parking: Attached garage (1-car); Driveway parking
- Security: Smoke detector(s); Carbon monoxide detector(s)
- Utilities: Public water; Public sewer; Natural gas for heating and water heater
- Home design: Residential stick/site-built house; One-story; Built in 1957; Existing structure
- Construction: Brick and frame construction; Crawl space foundation
- Exterior features: Fenced yard; Satellite dish; Storage structure on property; Public-maintained road
Interior
- Kitchen: Dishwasher; Free-standing range
- Bedrooms: Bedrooms on the main level
- Flooring: Carpet; Vinyl; Wood
- Bathrooms: 1 full bathroom
- Heating & cooling: Forced air heating (natural gas); Central air
- Interior features: Primary bedroom located on the main level; Attic access only; Ceiling fan(s); Deadbolt(s); See remarks
- Laundry & utility: Washer hookup; Dryer connection on main level; Gas water heater
Neighborhood map
What this means for you Summary
Snapshot
- This is a 2-bed/1.0-bath single-family listed at $169k.
Deal economics
- At list price, monthly cash flow is $183 ($2k/yr) — positive.
- The deal already cash-flows at list — no discount required.
- To meet the 1% rule (rent ≥ 1% of price), the offer needs to be $159k (5.6% below list).
- Recommended offer: $159k (6.0% below list) — sets the bar for market timing.
- Cap rate 7.6% vs local median 3.5% in Lexington — top-decile yield for the area; either an underpriced asset or a hidden risk that comps aren't pricing in. Stress-test before assuming the spread holds.
Location & tenants
- Location reads 72/100 on livability (#89 in NC) — a middle-class / working-renter tenant base. Strengths: commute A+, cost of living A+, health & safety A+; Watch: schools D, crime F, amenities D-.
- Lexington City Schools (suburban): math 32% / reading 38% proficiency, ranked #136 of 178 in NC (top 76%) — families likely to look elsewhere, expect single-tenant / working-renter base with shorter leases; 78% free/reduced lunch — lower-income household profile, screen leases tightly.
- Market conditions: Rents rising (+3.4%/yr); 351 active listings in the ZIP; 5 comparable units currently listed for rent nearby; rentals at typical pace (median 19d on market — plan ~3-4 weeks tenant-placement turnaround); 990 units permitted in Davidson County in 2024 (54 in 5+ unit buildings).
Forward outlook
- Local home prices are declining (-3.0%/yr); year-one equity from $1k of loan paydown is wiped out by about $5k of value loss. Plan a longer hold.
- Davidson County population projected to shrink 6% by 2050 — rents likely to lag national; underwrite the cash flow, not the appreciation.
Negotiation context
- It's been on market 76 days — a 6% lower offer ($159k) is reasonable based on typical stale-listing flexibility.
- 2 sale attempts since 9y ago; this cycle's ask has dropped $23k (12%) from the opening price — seller is motivated, your offer sets the floor, not the list.
- Current owner paid $120k; 40% above their basis — modest negotiation headroom, anchor on the comps not their cost.
Risks & watch-outs
- Watch-outs: built in 1957 — expect roof / HVAC / electrical / plumbing capex.
- Climate carrying-cost: extreme-heat days projected 7→17/yr by 2055 (HVAC capex compounding) — expect insurance premiums to compound above CPI over the hold.
Questions for the listing agent
- It's been on market 76 days. Have you received any prior offers? Is the seller open to a 6% concession, seller financing, or rate buy-down credit?
- Built in 1957 — when were the roof, HVAC, electrical panel, plumbing, and water heater last replaced?
- Why hasn't it sold? Are there any deal-killer items the seller is aware of (foundation, flood, title, zoning, code violations)?
- Is there a deadline driving the sale (1031 exchange, divorce, estate, relocation)? That informs how much negotiation room exists.
- Schools are D-rated, which usually means shorter tenancies and higher turnover. Who's the typical renter profile here, and what's been the actual vacancy rate?
- Crime grade is F in this area — have there been break-ins, vandalism, or insurance claims at this property in the last 3 years? What carrier currently insures it and at what premium?
- What's the average days-on-market for RENTAL listings here right now (not sales)? A rising rental-DOM trend means longer vacancies and softer asking-rent achievability than the comps imply.
- What's the recent tenant-quality profile in this submarket — average credit score on applications, eviction rate, late-payment / NSF rate, and stable-employment percentage? A property-management company in the area should have these aggregated.
- How much new for-sale + rental construction is in the pipeline within 1–3 miles? Heavy new supply typically softens prices + rents 12–24 months out; constrained supply supports both.
Investment metrics
- 1% rule
- 0.94% ✗
- Cap rate
- 7.60%
- Cash-on-cash
- 4.65%
- DSCR
- 1.21
- GRM
- 8.8
CMA / ARV
- ARV (on-the-fly)
- $241,850
- Comps found
- 12
Show comp detail 12 sales within ~0.75 mi
| Address | Dist | Beds/Ba | Sqft | Sold | Price | $/sf | Match |
|---|---|---|---|---|---|---|---|
| 323 Western Blvd | 0.03mi | 3/1.0 (+1) | 1,337 (-3%) | 4mo | $142,000 | $106 | 85 |
| 205 Avondale Dr | 0.08mi | 3/1.0 (+1) | 1,475 (+7%) | 8mo | $257,500 | $175 | 73 |
| 402 Idlewild Dr | 0.26mi | 3/2.0 (+1) | 1,356 (-2%) | 12mo | $190,000 | $140 | 66 |
| 200 Westdale Ave | 0.42mi | 3/1.0 (+1) | 1,360 (-2%) | 11mo | $230,000 | $169 | 63 |
| 704 Archdale Dr | 0.64mi | 3/2.0 (+1) | 1,334 (-4%) | 1mo | $285,000 | $214 | 55 |
| 718 W 4th Ave | 0.55mi | 3/2.0 (+1) | 1,332 (-4%) | 7mo | $215,900 | $162 | 54 |
| 110 Tannin Way | 0.66mi | 3/2.0 (+1) | 1,333 (-4%) | 8mo | $269,900 | $202 | 47 |
| 701 Archdale Dr | 0.64mi | 3/2.0 (+1) | 1,490 (+8%) | 13mo | $264,999 | $178 | 37 |
| 701 Archdale Dr | 0.64mi | 3/2.0 (+1) | 1,490 (+8%) | 13mo | $264,999 | $178 | 37 |
| 703 Archdale Dr | 0.65mi | 3/2.0 (+1) | 1,536 (+11%) | 14mo | $269,999 | $176 | 31 |
| 113 Habersham Ct | 0.67mi | 3/2.5 (+1) | 1,585 (+15%) | 7mo | $264,000 | $167 | 28 |
| 407 Westside Dr | 0.71mi | 3/2.0 (+1) | 1,196 (-14%) | 12mo | $185,000 | $155 | 25 |
Match score weights: distance 35% · size 25% · config 20% · recency 20%. Top-matched comps best support the ARV.
Projected returns pro-forma
-3.0% appreciation · 3.37% rent growth · sell at horizon
- IRR
- -8.7%
- Equity multiple
- 0.68×
- Total profit
- $-15,135
- Equity at exit
- $25,198
- IRR
- 1.2%
- Equity multiple
- 1.09×
- Total profit
- $4,202
- Equity at exit
- $14,612
Cash invested: $47,320 (down + closing). Projections, not guarantees.
Landlord ↔ Tenant lean methodology
- Overall (STATE)
- 85 Strongly Landlord-Friendly
- State North Carolina
- 85 Strongly Landlord-Friendly · R+3
- County
- — inherits STATE
- City
- — inherits STATE
ZIP-level market 27295
- Home prices YoY
- -15.2%
- Rents YoY
- 3.4%
- Active inventory
- 351
- Price-to-rent
- 8.8×
Monthly cashflow live
- Estimated rent
- $1,595 high interval (Pro) →
- Mortgage (P&I)
- −$886
- Tax from tax record
- −$120 /mo · $1,437/yr
- Insurance
- −$70
- HOA
- −$0
- Vacancy / Maint / Mgmt
- −$335
- Net cashflow
- $183
Break-even live
UW: 25.0% down · 7.5% · 30yr · 1.5% tax · 5.0% vac · 8.0% maint · 8.0% mgmt
Financing live
Cash to close
- Down payment
- $42,250
- Closing costs
- $5,070
- Reserves months
- —
- Total cash needed
- —
Loan-product check · same deal, 3 products live
Conventional
25% down · 7.5% · 30yr
- Down + closing
- —
- Monthly P&I
- —
- Monthly cashflow
- —
- DSCR
- —
- Eligible?
- —
Personal DTI + credit; lowest rate.
DSCR
20% down · 8.5% · 30yr
- Down + closing
- —
- Monthly P&I
- —
- Monthly cashflow
- —
- DSCR
- —
- Eligible?
- —
No personal income docs; deal must DSCR.
Hard money
10% down · 12.0% · 12mo
- Down + closing
- —
- Monthly P&I
- —
- Monthly cashflow
- —
- DSCR
- —
- Eligible?
- —
Short-term bridge; refi at stabilization.
Rent comps 5 comps
| Address | Beds | Baths | Sqft | Rent | $/sqft | DOM | Units | Dist |
|---|---|---|---|---|---|---|---|---|
| 206 Crane Creek Way Lexington, NC | 3.0 | 2.5 | 1588 | $1,650 | $1.04 | 23d | 1 | 0.60mi |
| 500 Rylee Ln Lexington, NC | 3.0 | 2.0 | 1200 | $1,550 | $1.29 | 14d | 1 | 0.67mi |
| 152 Iroquois Trl Lexington, NC | 3.0 | 2.5 | 1828 | $2,010 | $1.10 | 14d | 1 | 0.76mi |
| 420 Salem St Unit H Lexington, NC | 2.0 | 1.5 | 1100 | $875 | $0.80 | 19d | 1 | 1.20mi |
| 301 Williamson St Unit B Lexington, NC | 2.0 | 1.0 | 896 | $1,000 | $1.12 | 23d | 1 | 1.39mi |
Listing history 19 events
-
2026-06-02status $169,000 Pending 76 DOM
-
2026-06-01days on market $169,000 Active 76 DOM
-
2026-05-31days on market $169,000 Active 75 DOM
-
2026-05-31days on market $169,000 Active 74 DOM
-
2026-05-20price $169,000
-
2026-04-20price $179,000
-
2026-03-16$192,000 Active
-
2026-01-05soldstatus $120,289
-
2018-05-15soldstatus $80,000 Sold 363-char remark
Show marketing remark (363 chars)
Great location for this 2 bedroom, 1 bath brick veneer home within minutes of Hwy. 64 W. and Business 85. Large living room with fireplace, kitchen & dining combination. One car-carport. This price includes an additional building lot beside of home - use for additional home or large play area. Beautiful neighborhood pool within walking distance of home.
-
2018-05-15soldstatus $80,000
Show marketing remark (363 chars)
Great location for this 2 bedroom, 1 bath brick veneer home within minutes of Hwy. 64 W. and Business 85. Large living room with fireplace, kitchen & dining combination. One car-carport. This price includes an additional building lot beside of home - use for additional home or large play area. Beautiful neighborhood pool within walking distance of home.
-
2018-05-11status Pending 363-char remark
Show marketing remark (363 chars)
Great location for this 2 bedroom, 1 bath brick veneer home within minutes of Hwy. 64 W. and Business 85. Large living room with fireplace, kitchen & dining combination. One car-carport. This price includes an additional building lot beside of home - use for additional home or large play area. Beautiful neighborhood pool within walking distance of home.
-
2018-04-12historical Due Diligence Period 363-char remark
Show marketing remark (363 chars)
Great location for this 2 bedroom, 1 bath brick veneer home within minutes of Hwy. 64 W. and Business 85. Large living room with fireplace, kitchen & dining combination. One car-carport. This price includes an additional building lot beside of home - use for additional home or large play area. Beautiful neighborhood pool within walking distance of home.
-
2018-03-23price $82,000 363-char remark
Show marketing remark (363 chars)
Great location for this 2 bedroom, 1 bath brick veneer home within minutes of Hwy. 64 W. and Business 85. Large living room with fireplace, kitchen & dining combination. One car-carport. This price includes an additional building lot beside of home - use for additional home or large play area. Beautiful neighborhood pool within walking distance of home.
-
2017-10-17price $89,000 363-char remark
Show marketing remark (363 chars)
Great location for this 2 bedroom, 1 bath brick veneer home within minutes of Hwy. 64 W. and Business 85. Large living room with fireplace, kitchen & dining combination. One car-carport. This price includes an additional building lot beside of home - use for additional home or large play area. Beautiful neighborhood pool within walking distance of home.
-
2017-09-15price $92,500 363-char remark
Show marketing remark (363 chars)
Great location for this 2 bedroom, 1 bath brick veneer home within minutes of Hwy. 64 W. and Business 85. Large living room with fireplace, kitchen & dining combination. One car-carport. This price includes an additional building lot beside of home - use for additional home or large play area. Beautiful neighborhood pool within walking distance of home.
-
2017-07-14$99,500 Active 363-char remark
Show marketing remark (363 chars)
Great location for this 2 bedroom, 1 bath brick veneer home within minutes of Hwy. 64 W. and Business 85. Large living room with fireplace, kitchen & dining combination. One car-carport. This price includes an additional building lot beside of home - use for additional home or large play area. Beautiful neighborhood pool within walking distance of home.
-
2015-09-14price $89,500
-
2004-09-30soldstatus $90,500
-
2004-09-30soldstatus $90,500
ⓘ Source: listings_history table (triggers on properties + properties_extension) + one-shot
backfill from property_details.listing_events for pre-trigger history.
Tax reassessment forecast NC · Resets to sale price
- Current annual tax
- $1,437 · $120/mo
- Projected year-2 tax
- $1,437 · $120/mo
- Expected delta
- $0/yr ($0/mo · 0.0%)
ⓘ Screening estimate from a state-policy table — verify with the county assessor before closing.
Climate risk First Street
- Flood 1/10 Low FEMA zone X (unshaded) · 0% chance over 30 yrs
- Wildfire 1/10 Low
- Heat 6/10 Major 7 d/yr ≥103°F today · 17 d/yr by 30 yrs out
- Wind 4/10 Moderate 11% chance of damaging wind over 30 yrs
- Air quality 2/10 Low 1 unhealthy d/yr today · 2 by 30 yrs out
Nearby sold comps map
Loading sold comps map…
Walkable amenities ~0.75 mi
Loading nearby amenities…
Taxation est. · year 1
- Rental income
- $19,137
- − Mortgage interest
- −$9,467
- − Property taxes
- −$1,437
- − Insurance
- −$845
- − Repairs & maintenance
- −$1,531
- − Management
- −$1,531
- − Depreciation
- −$4,916
- Taxable loss
- −$589
- Est. tax savings @ 24.0%
- +$141
- After-tax cash flow
- $2,343/yr
For passive investors: Depreciation is non-cash, so a rental often shows a tax loss while cash-flowing — sheltering income. Rental losses are passive: they offset passive income freely, and up to $25,000/yr can offset ordinary (W-2) income if you actively participate and your MAGI is under $100k (phasing out to $0 by $150k); unused losses carry forward. On sale, claimed depreciation is recaptured at up to 25%, and gains may owe capital-gains tax (a 1031 exchange can defer both). Figures are a year-1 estimate at your 24.0% rate — not tax advice; consult a CPA.
Schools (NCES district)
- District
- Lexington City Schools
- NCES district ID
- 3702640
- Math proficiency
- 32% ▲ 3.00%
- Reading proficiency
- 38% ▲ 6.00%
- Median HH income
- $27,758
- Composite
- 28.2/100
- National rank
- #6807
- State rank
- #136 of 178 in NC
Livability — Lexington
- Score
- 72/100
- State rank
- #89
- US rank
- #6051
Category grades
Schools grade is shown separately in the Schools card above.
Census & demographics
- Census place
- Lexington, NC
- County
- Davidson County · 129,088 people
- City population
- 79,578
- Metro
- Winston-Salem, NC
- Population (ZIP)
- 39,267
- Household income
- $63,961
- Rent vs Own
- Severe rent burden
- 733.0
Population outlook (Davidson County) Hauer SSP2
- Today (2025)
- 167,156 people
- By 2030
- 167,216 · +0.0%
- By 2040
- 164,524 · -1.6%
- By 2050
- 157,229 · -5.9%
- By 2075
- 138,084 · -17.4%
- By 2100
- 112,729 · -32.6%
Race, ethnicity, and origin ACS 2023
- Neighborhood character
- Predominantly White (82%)
- Race & ethnicity
- White 82% Hispanic / Latino 6% Black 6% Two or more races 4% Asian 3%
- Hispanic origin (detail)
- Mexican 4%
- Common ancestry
- Serbian 2% Slovak 2% Italian 2%
- Foreign-born
- 5% · Canada, Jamaica
- Languages at home
- 93% English-only · Spanish 5% Other Asian/Pacific 1%
Political lean MEDSL · Davidson
- 2024 margin
- Solid R (+47.1) · D 25.9% · R 73.0% · Other 1.1%
- 2008→2024 swing
- -13.5pp toward R · 2008: -33.5pp · 2024: -47.1pp
- All cycles
- 2024: R+47.1 2020: R+47.5 2016: R+49.4 2012: R+40.9 2008: R+33.5
Not yet ingested
- Civics
- —
Market trends
- HPI YoY
- ▼ -46.39%
- Current HPI
- 258.6557
- Rent YoY
- ▲ 3.37%
- Metro
- Winston-Salem, NC
- State GDP YoY
- ▲ 3.28%
- F500 in state
- 26
Industry mix (Fortune 500 HQ in NC)
| Industry | F500 HQs | Revenue |
|---|---|---|
| Financial Services | 2 | $213B |
|
||
| Retail | 2 | $95B |
|
||
| Industrial Conglomerate | 1 | $38B |
|
||
| Metals / Steel | 1 | $35B |
|
||
| Utilities | 1 | $30B |
|
||
| Industrial Machinery | 1 | $19B |
|
||
Price history
+86.7% since first listed15 events — show timeline
- 2026-05-20 Price Changed $169,000 Triad MLS
- 2026-04-20 Price Changed $179,000 Triad MLS
- 2026-03-16 Listed $192,000 Triad MLS
- 2026-01-05 Sold (Public Records) $120,289 Public Records
- 2018-05-15 Sold (Public Records) $80,000 Public Records
- 2018-05-15 Sold (MLS) $80,000 Triad MLS
- 2018-05-11 Pending — Triad MLS
- 2018-04-12 Contingent — Triad MLS
- 2018-03-23 Price Changed $82,000 Triad MLS
- 2017-10-17 Price Changed $89,000 Triad MLS
- 2017-09-15 Price Changed $92,500 Triad MLS
- 2017-07-14 Listed $99,500 Triad MLS
- 2015-09-14 Price Changed $89,500 Triad MLS
- 2004-09-30 Sold (Public Records) $90,500 Public Records
- 2004-09-30 Sold (Public Records) $90,500 Public Records
Property tax history
+3.1%/yrLatest (2025): $1,437 · +0.0% YoY. Source: county tax records.
Cash-flow waterfall
monthlySold comps — $/sqft
last 12 mo · ≤1 miLoading sold comps…