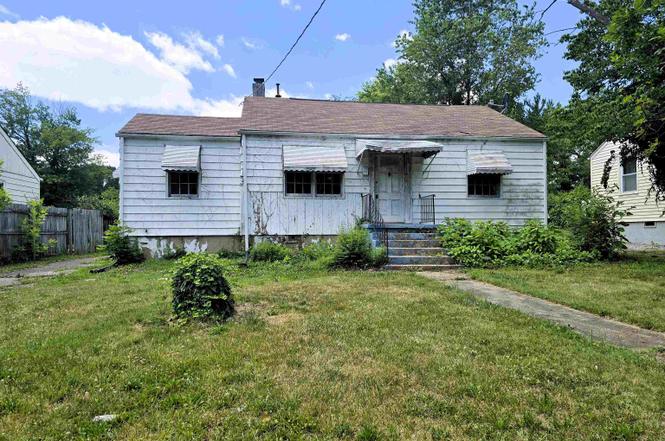
1430 Forest Park Blvd NW · Roanoke, VA
Flood risk 1/10 · Minimal
- FEMA flood zone
- X (unshaded)
- Chance of flooding over 30 yrs
- 0.0%
- Est. flood insurance / yr
- $507 – $1,088
Fire risk 1/10 · Minimal
- Est. fire insurance / yr
- $666 – $1,236
Heat risk 5/10 · Moderate
- Hot days now (above 101°F)
- 7 days/yr
- Hot days in 30 yrs
- 18 days/yr
Wind risk 2/10 · Minimal
- Chance of severe wind over 30 yrs
- 1.0%
Air-quality risk 1/10 · Minimal
- Unhealthy air days now
- 0 days/yr
- Unhealthy air days in 30 yrs
- 0 days/yr
Risk factors via First Street. Map © Google.
Why this score? — see what drove the B+ grade
The composite is a weighted blend of 9 inputs, each scored 0–100. Each bar is that input's sub-score; the figure is the points it added to the 100-point composite (weight × sub-score).
- Cash flow +30.0/30.0
- ARV discount +15.0/15.0
- 1% rule +10.0/10.0
- DSCR +10.0/10.0
- Schools +4.1/10.0
- Rent growth +3.9/5.0
- Livability +3.7/5.0
- Condition / age +2.5/5.0
- Appreciation +0.0/10.0
$80,000
🖨 Deal sheet 📄 Offer letter ✓ Due diligence
Listing remarks MLS
Nice 3 BR home w/ detached garage and large, level fenced yard. Refinished hardwood floors, new heating and cooling systems, electrical upgrade, fresh paint, new gutters and downspouts, eat-in kitchen, laundry/mudroom and attic for storage space.
Key facts
- 0.31 acre lot
- Garage
- Built 1949
Property features AI
Finance
- Other: Property listed as residential single-family
- Financial info: Tax amount reported (information available but not included per instructions)
- HOA & community: Information not provided
Exterior
- Parking: Detached concrete garage with 1 garage space
- Security: Information not provided
- Utilities: Public water; Public sewer
- Home design: Single-family detached residence; One story
- Construction: Above-grade finished area reported (1,061); Construction details not provided
- Exterior features: Fenced yard
Interior
- Kitchen: Appliances not separately listed
- Bedrooms: Information not provided
- Flooring: Information not provided
- Bathrooms: 1 full bathroom
- Heating & cooling: No heating system specified
- Interior features: Electric water heater; Total of 5 rooms
- Laundry & utility: Washer/dryer details not provided
Neighborhood map
What this means for you Summary
Snapshot
- This is a 3-bed/1.0-bath single-family listed at $80k.
Deal economics
- At list price, monthly cash flow is $617 ($7k/yr) — positive.
- The deal already cash-flows at list — no discount required.
- Meets the 1% rule at list price ($1k rent vs $80k).
- Cap rate 15.6% vs local median 4.2% in Roanoke — top-decile yield for the area; either an underpriced asset or a hidden risk that comps aren't pricing in. Stress-test before assuming the spread holds.
Location & tenants
- Location reads 73/100 on livability (#163 in VA) — a middle-class / working-renter tenant base. Strengths: cost of living A+, health & safety A+, housing A; Watch: amenities C-, employment D, crime F.
- Roanoke City Public School District (urban): math 40% / reading 58% proficiency, ranked #102 of 131 in VA (top 78%) — families likely to look elsewhere, expect single-tenant / working-renter base with shorter leases; 67% free/reduced lunch — lower-income household profile, screen leases tightly.
- Zoned schools: Westside Elementary (math 10% / reading 28%, grade F, #1,093 of 1,108 statewide, top 99%, 640 students, 98% FRL); William Fleming High (math 66% / reading 68%, grade B, #185 of 319 statewide, top 61%, 1,911 students, 96% FRL) — zoned schools average 97% FRL vs 67% district-wide (30 pts higher); higher-poverty schools than district average — tighter screening recommended.
- Market conditions: Rents rising fast (+5.7%/yr); 151 active listings in the ZIP; 18 comparable units currently listed for rent nearby; rentals at typical pace (median 21d on market — plan ~3-4 weeks tenant-placement turnaround); 44% of comp listings sitting > 30 days — soft ceiling on asking rent; 113 units permitted in Roanoke city in 2024 (0 in 5+ unit buildings).
- This rent runs 36% of the median local income ($47k/yr) — at the standard rent-burdened threshold; future hikes will face affordability resistance.
Forward outlook
- Local home prices are declining (-3.0%/yr); year-one equity from $553 of loan paydown is wiped out by about $2k of value loss. Plan a longer hold.
- Roanoke County population projected at +11% by 2050 — modest demand growth; plan on rents tracking national, not racing it.
- At projected returns (-3.0% appreciation + 5.7% rent growth), your $22k cash investment doubles in ~4 years — after that, you're playing with house money.
Negotiation context
- Only 1 days on market — expect competitive offers; lowballing is unlikely to land.
- 8 sale attempts since 25y ago with the ask held roughly flat each time — persistent listings suggest the price (not the market) is what's stuck; bring a comps-based counter.
- Current owner paid $65k; 23% above their basis — modest negotiation headroom, anchor on the comps not their cost.
Risks & watch-outs
- Watch-outs: built in 1949 — expect roof / HVAC / electrical / plumbing capex.
- Climate carrying-cost: extreme-heat days projected 7→18/yr by 2055 (HVAC capex compounding) — expect insurance premiums to compound above CPI over the hold.
Questions for the listing agent
- Built in 1949 — when were the roof, HVAC, electrical panel, plumbing, and water heater last replaced?
- Is there a deadline driving the sale (1031 exchange, divorce, estate, relocation)? That informs how much negotiation room exists.
- Schools are A-rated — typically a magnet for longer-tenancy family renters. What's the average tenant stay here, and is there a school-zone premium baked into asking?
- Crime grade is F in this area — have there been break-ins, vandalism, or insurance claims at this property in the last 3 years? What carrier currently insures it and at what premium?
- What's the average days-on-market for RENTAL listings here right now (not sales)? A rising rental-DOM trend means longer vacancies and softer asking-rent achievability than the comps imply.
- What's the recent tenant-quality profile in this submarket — average credit score on applications, eviction rate, late-payment / NSF rate, and stable-employment percentage? A property-management company in the area should have these aggregated.
- How much new for-sale + rental construction is in the pipeline within 1–3 miles? Heavy new supply typically softens prices + rents 12–24 months out; constrained supply supports both.
Investment metrics
- 1% rule
- 1.79% ✓
- Cap rate
- 15.55%
- Cash-on-cash
- 33.06%
- DSCR
- 2.47
- GRM
- 4.6
CMA / ARV
- ARV (on-the-fly)
- $137,930
- Comps found
- 11
Show comp detail 11 sales within ~0.75 mi
| Address | Dist | Beds/Ba | Sqft | Sold | Price | $/sf | Match |
|---|---|---|---|---|---|---|---|
| 1301 Greenlane Rd NW | 0.24mi | 3/1.0 | 1,019 (-4%) | 17mo | $100,000 | $98 | 68 |
| 3052 Ferncliff Ave NW | 0.57mi | 3/1.0 | 1,060 (-0%) | 10mo | $225,000 | $212 | 65 |
| 825 30th St NW | 0.59mi | 3/1.0 | 1,055 (-1%) | 8mo | $172,000 | $163 | 65 |
| 2764 Clifton St NW | 0.22mi | 2/2.0 (-1) | 1,058 (-0%) | 19mo | $70,000 | $66 | 64 |
| 1513 Aspen St NW | 0.35mi | 3/1.0 | 1,143 (+8%) | 8mo | $198,950 | $174 | 64 |
| 2415 Delaware Ave NW | 0.56mi | 3/1.0 | 1,028 (-3%) | 5mo | $144,950 | $141 | 64 |
| 1415 Fresno St NW | 0.14mi | 2/1.0 (-1) | 914 (-14%) | 6mo | $114,000 | $125 | 61 |
| 2623 New York Ave NW | 0.47mi | 2/1.0 (-1) | 1,008 (-5%) | 5mo | $86,250 | $86 | 60 |
| 1502 Fresno St NW | 0.28mi | 2/1.0 (-1) | 936 (-12%) | 7mo | $223,000 | $238 | 56 |
| 2919 Melrose Ave NW | 0.51mi | 2/1.0 (-1) | 1,009 (-5%) | 16mo | $80,000 | $79 | 50 |
| 1418 22nd St St NW | 0.68mi | 3/1.0 | 925 (-13%) | 2mo | $120,700 | $130 | 45 |
Match score weights: distance 35% · size 25% · config 20% · recency 20%. Top-matched comps best support the ARV.
Projected returns pro-forma
-3.0% appreciation · 5.71% rent growth · sell at horizon
- IRR
- 31.2%
- Equity multiple
- 2.36×
- Total profit
- $30,361
- Equity at exit
- $11,928
- IRR
- 39.8%
- Equity multiple
- 5.22×
- Total profit
- $94,484
- Equity at exit
- $6,917
Cash invested: $22,400 (down + closing). Projections, not guarantees.
Landlord ↔ Tenant lean methodology
- Overall (STATE)
- 55 Moderately Landlord-Leaning
- State Virginia
- 55 Moderately Landlord-Leaning · D+2
- County
- — inherits STATE
- City
- — inherits STATE
ZIP-level market 24017
- Home prices YoY
- -28.3%
- Rents YoY
- 5.7%
- Active inventory
- 151
- Price-to-rent
- 4.6×
Monthly cashflow live
- Estimated rent
- $1,435 high interval (Pro) →
- Mortgage (P&I)
- −$420
- Tax from tax record
- −$64 /mo · $764/yr
- Insurance
- −$33
- HOA
- −$0
- Vacancy / Maint / Mgmt
- −$301
- Net cashflow
- $617
Break-even live
UW: 25.0% down · 7.5% · 30yr · 1.5% tax · 5.0% vac · 8.0% maint · 8.0% mgmt
Financing live
Cash to close
- Down payment
- $20,000
- Closing costs
- $2,400
- Reserves months
- —
- Total cash needed
- —
Loan-product check · same deal, 3 products live
Conventional
25% down · 7.5% · 30yr
- Down + closing
- —
- Monthly P&I
- —
- Monthly cashflow
- —
- DSCR
- —
- Eligible?
- —
Personal DTI + credit; lowest rate.
DSCR
20% down · 8.5% · 30yr
- Down + closing
- —
- Monthly P&I
- —
- Monthly cashflow
- —
- DSCR
- —
- Eligible?
- —
No personal income docs; deal must DSCR.
Hard money
10% down · 12.0% · 12mo
- Down + closing
- —
- Monthly P&I
- —
- Monthly cashflow
- —
- DSCR
- —
- Eligible?
- —
Short-term bridge; refi at stabilization.
Rent comps 18 comps
| Address | Beds | Baths | Sqft | Rent | $/sqft | DOM | Units | Dist |
|---|---|---|---|---|---|---|---|---|
| 1331 Dudley St NW Roanoke, VA | 2.0 | 1.0 | 700 | $1,500 | $2.14 | 13d | 1 | 0.29mi |
| 2608 Florida Ave NW Roanoke, VA | 3.0 | 1.0 | 1394 | $1,600 | $1.15 | 20d | 1 | 0.43mi |
| 2731 Cove Rd NW Roanoke, VA | 3.0 | 2.5 | 1427 | $1,523 | $1.07 | 43d | 1 | 0.49mi |
| 3340 Hershberger Rd NW Roanoke, VA | 2.0 | 1.0 | 924 | $1,050 | $1.14 | 43d | 1 | 0.51mi |
| 2744 Melrose Ave NW Roanoke, VA | 1.0–2.0 | 1.0–1.5 | 936 | $1,045 | $1.12 | 13d | 7 | 0.56mi |
| 733 29th St NW Roanoke, VA | 2.0–3.0 | 2.0 | 1022 | $1,625 | $1.59 | 13d | 4 | 0.72mi |
| 3533 Ferncliff Ave NW Roanoke, VA | 1.0–3.0 | 1.0 | 980 | $1,426 | $1.46 | 13d | 11 | 0.88mi |
| 2801 Hershberger Rd NW Roanoke, VA | 1.0–2.0 | 1.0–2.0 | 956 | $1,965 | $2.06 | 13d | 14 | 0.97mi |
| 1920 Melrose Ave NW Roanoke, VA | 2.0 | 1.0 | 768 | $950 | $1.24 | 43d | 1 | 1.06mi |
| 2215 Montauk Rd NW Roanoke, VA | 1.0–2.0 | 1.0–1.5 | 653 | $1,425 | $2.18 | 13d | 5 | 1.16mi |
| 3802 Panorama Ave NW #12 Roanoke, VA | 3.0 | 1.0 | 1100 | $995 | $0.90 | 43d | 1 | 1.22mi |
| 3802 Panorama Ave NW #2 Roanoke, VA | 2.0 | 1.0 | 900 | $995 | $1.11 | 43d | 1 | 1.22mi |
| 3802 Panorama Ave NW #6 Roanoke, VA | 2.0 | 1.0 | 900 | $1,050 | $1.17 | 43d | 1 | 1.22mi |
| 1533 Rugby Blvd NW Roanoke, VA | 3.0 | 1.0 | 1500 | $1,475 | $0.98 | 43d | 1 | 1.22mi |
| 1531 Syracuse Ave NW Roanoke, VA | 3.0 | 1.0 | 1488 | $1,675 | $1.13 | 43d | 1 | 1.22mi |
| 4310 Tyree Rd NW Roanoke, VA | 3.0 | 1.0 | 913 | $1,650 | $1.81 | 13d | 1 | 1.32mi |
| 2318 Highland Farm Rd NW Roanoke, VA | 2.0–3.0 | 1.0–1.5 | 1208 | $1,450 | $1.20 | 13d | 4 | 1.40mi |
| 1716 Empress Dr NW Roanoke, VA | 1.0–2.0 | 1.0 | 671 | $1,040 | $1.55 | 13d | 1 | 1.44mi |
Listing history 5 events
-
2026-06-18days on market $80,000 Active 1 DOM
-
2026-06-18days on market $80,000 Active 3 DOM
-
2026-06-17days on market $80,000 Active 2 DOM
-
2026-06-16remarks 135-char remark
-
2026-06-16$80,000 Active 1 DOM
ⓘ Source: listings_history table (triggers on properties + properties_extension) + one-shot
backfill from property_details.listing_events for pre-trigger history.
Tax reassessment forecast VA · Resets to sale price
- Current annual tax
- $764 · $64/mo
- Projected year-2 tax
- $764 · $64/mo
- Expected delta
- $0/yr ($0/mo · 0.0%)
ⓘ Screening estimate from a state-policy table — verify with the county assessor before closing.
Climate risk First Street
- Flood 1/10 Low FEMA zone X (unshaded) · 0% chance over 30 yrs
- Wildfire 1/10 Low
- Heat 5/10 Major 7 d/yr ≥101°F today · 18 d/yr by 30 yrs out
- Wind 2/10 Low 100% chance of damaging wind over 30 yrs
- Air quality 1/10 Low 0 unhealthy d/yr today · 0 by 30 yrs out
Nearby sold comps map
Loading sold comps map…
Walkable amenities ~0.75 mi
Loading nearby amenities…
Taxation est. · year 1
- Rental income
- $17,221
- − Mortgage interest
- −$4,481
- − Property taxes
- −$764
- − Insurance
- −$400
- − Repairs & maintenance
- −$1,378
- − Management
- −$1,378
- − Depreciation
- −$2,327
- Taxable income
- $6,493
- Est. tax owed @ 24.0%
- −$1,558
- After-tax cash flow
- $5,848/yr
For passive investors: Depreciation is non-cash, so a rental often shows a tax loss while cash-flowing — sheltering income. Rental losses are passive: they offset passive income freely, and up to $25,000/yr can offset ordinary (W-2) income if you actively participate and your MAGI is under $100k (phasing out to $0 by $150k); unused losses carry forward. On sale, claimed depreciation is recaptured at up to 25%, and gains may owe capital-gains tax (a 1031 exchange can defer both). Figures are a year-1 estimate at your 24.0% rate — not tax advice; consult a CPA.
Schools (NCES district)
- District
- Roanoke City Public School District
- NCES district ID
- 5103300
- Math proficiency
- 40% ▼ -38.00%
- Reading proficiency
- 58% ▼ -12.00%
- Median HH income
- $38,592
- Composite
- 40.8/100
- National rank
- #3639
- State rank
- #102 of 131 in VA
Livability — Roanoke
- Score
- 73/100
- State rank
- #163
- US rank
- #5055
Category grades
Schools grade is shown separately in the Schools card above.
Census & demographics
- Census place
- Roanoke, VA
- County
- Roanoke City · 101,625 people
- City population
- 168,930
- Metro
- Roanoke, VA
- Population (ZIP)
- 23,678
- Household income
- $47,360
- Rent vs Own
- Severe rent burden
- 913.0
Population outlook (Roanoke County) Hauer SSP2
- Today (2025)
- 106,094 people
- By 2030
- 108,927 · +2.7%
- By 2040
- 114,104 · +7.5%
- By 2050
- 118,032 · +11.3%
- By 2075
- 123,363 · +16.3%
- By 2100
- 116,827 · +10.1%
Race, ethnicity, and origin ACS 2023
- Neighborhood character
- Diverse neighborhood (Simpson 0.58)
- Race & ethnicity
- Black 59% White 25% Hispanic / Latino 9% Asian 4% Two or more races 4%
- Hispanic origin (detail)
- Mexican 2% Cuban 1%
- Common ancestry
- Slovak 1% Romanian 1% Lithuanian 1%
- Foreign-born
- 9% · Canada, China, Vietnam
- Languages at home
- 87% English-only · Spanish 8% Other Indo-European 3% German/W. Germanic 1%
Political lean MEDSL · Roanoke
- 2024 margin
- Strong D (+23.6) · D 61.1% · R 37.5% · Other 1.4%
- 2008→2024 swing
- +0.2pp no change · 2008: 23.4pp · 2024: 23.6pp
- All cycles
- 2024: D+23.6 2020: D+25.8 2016: D+17.6 2012: D+21.5 2008: D+23.4
Not yet ingested
- Civics
- —
Market trends
- HPI YoY
- ▼ -78.29%
- Current HPI
- 198.5991
- Rent YoY
- ▲ 5.71%
- Metro
- Roanoke, VA
- State GDP YoY
- ▲ 2.40%
- F500 in state
- 50
Industry mix (Fortune 500 HQ in VA)
| Industry | F500 HQs | Revenue |
|---|---|---|
| Aerospace / Defense | 4 | $236B |
|
||
| Technology / Defense | 3 | $32B |
|
||
| Financial Services | 2 | $176B |
|
||
| Utilities | 2 | $27B |
|
||
| Insurance | 2 | $25B |
|
||
| Technology | 2 | $15B |
|
||
Price history
+384.8% since first listed19 events — show timeline
- 2026-06-16 Listed $80,000 NRVMLS
- 2009-07-28 Sold (Public Records) $65,000 Public Records
- 2009-07-27 Sold (MLS) $65,000 MLSRV
- 2009-06-22 Listed $72,500 MLSRV
- 2009-04-17 Sold (MLS) $36,000 MLSRV
- 2009-03-10 Listed $45,000 MLSRV
- 2008-04-08 Listing Removed — MLSRV
- 2007-10-16 Listed $79,950 MLSRV
- 2007-07-09 Listing Removed — MLSRV
- 2007-03-26 Listed $74,950 MLSRV
- 2007-01-12 Sold (MLS) $52,900 MLSRV
- 2006-12-27 Sold (Public Records) $52,900 Public Records
- 2006-12-19 Listed $58,900 MLSRV
- 2006-12-01 Listing Removed — MLSRV
- 2006-09-25 Listed $58,900 MLSRV
- 2002-02-12 Listing Removed — MLSRV
- 2001-09-15 Listed $40,000 MLSRV
- 1997-07-28 Sold (Public Records) $49,000 Public Records
- 1996-10-09 Sold (Public Records) $16,500 Public Records
Property tax history
+1.5%/yrLatest (2025): $764 · -22.9% YoY. Source: county tax records.
Cash-flow waterfall
monthlySold comps — $/sqft
last 12 mo · ≤1 miLoading sold comps…