 🏷️ Likely Rental
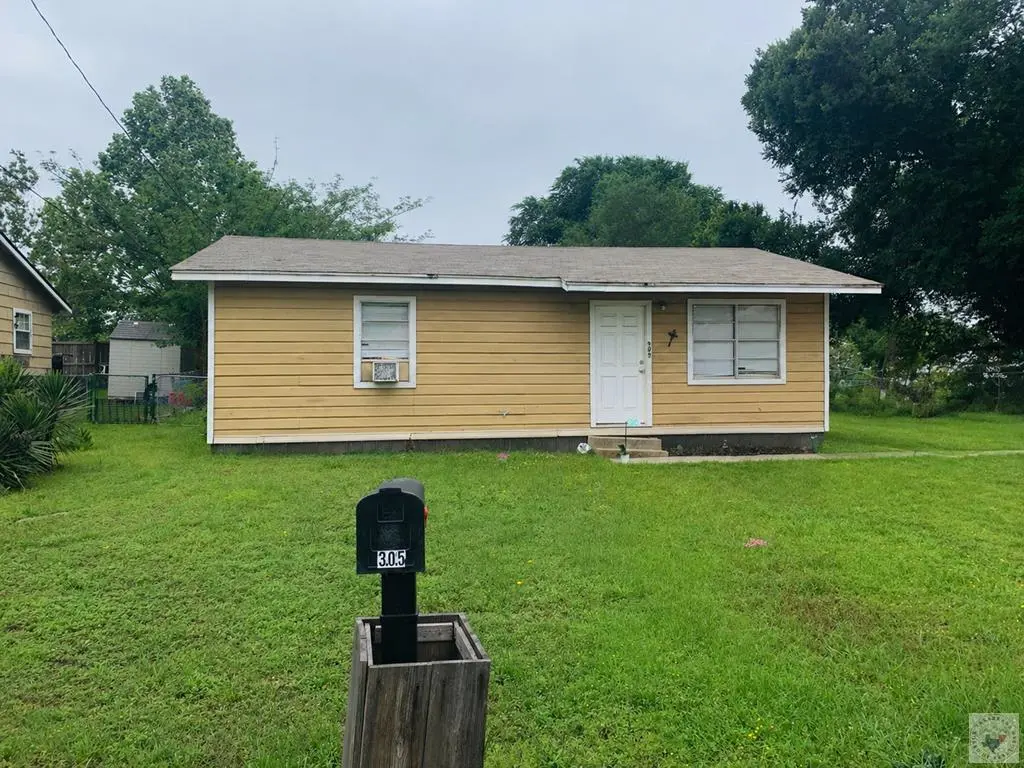
305 Marietta St · Queen City, TX
Flood risk 1/10 · Minimal
- FEMA flood zone
- X (unshaded)
- Chance of flooding over 30 yrs
- 0.0%
- Est. flood insurance / yr
- $507 – $1,088
Fire risk 6/10 · Moderate
- Est. fire insurance / yr
- $1,222 – $2,270
Heat risk 7/10 · Major
- Hot days now (above 112°F)
- 7 days/yr
- Hot days in 30 yrs
- 23 days/yr
Wind risk 6/10 · Moderate
- Chance of severe wind over 30 yrs
- 27.0%
Air-quality risk 1/10 · Minimal
- Unhealthy air days now
- 0 days/yr
- Unhealthy air days in 30 yrs
- 0 days/yr
Risk factors via First Street. Map © Google.
Why this score? — see what drove the B- grade
The composite is a weighted blend of 9 inputs, each scored 0–100. Each bar is that input's sub-score; the figure is the points it added to the 100-point composite (weight × sub-score).
- Cash flow +21.7/30.0
- ARV discount +15.0/15.0
- DSCR +6.9/10.0
- Appreciation +6.8/10.0
- 1% rule +5.6/10.0
- Schools +3.6/10.0
- Livability +3.2/5.0
- Rent growth +2.5/5.0
- Condition / age +2.5/5.0
$84,900
🖨 Deal sheet (PDF) 📄 Offer letter ✓ Due diligence
Listing remarks
2 bed, 1 bath home in Queen City located right next to the middle school. Approx. 884 sq ft, perfect for a starter home or investment property. Currently tenant-occupied—do not disturb tenants. Can be purchased individually or as part of a package with 9 additional properties.
Key facts
- 0.3 acre lot
- Built 1965
- Listed 41 days
Property features AI
Exterior
- Utilities: Public water; Public sewer
- Home design: Single-family residence; Residential property; One story; Located in Queen City OT subdivision
- Construction: Wood siding; Pillar/post/pier foundation; Built with wood siding construction
- Exterior features: Shingle roof; Patio/porch: none; City street frontage; Lot approximately 0.296 acres
Interior
- Bathrooms: 1 full bathroom
- Interior features: One-level layout
Neighborhood map
What this means for you Summary
Snapshot
- This is a 2-bed/1.0-bath single-family listed at $85k.
Deal economics
- At list price, monthly cash flow is $131 ($2k/yr) — positive.
- The deal already cash-flows at list — no discount required.
- Meets the 1% rule at list price ($900 rent vs $85k).
- Recommended offer: $82k (3.0% below list) — sets the bar for market timing.
Location & tenants
- Location reads 64/100 on livability (#735 in TX) — a middle-class / working-renter tenant base. Strengths: cost of living A+, housing A+; Watch: employment D+, amenities F, commute F.
- Queen City ISD (rural): math 39% / reading 45% proficiency, ranked #355 of 826 in TX (top 43%) — families likely to look elsewhere, expect single-tenant / working-renter base with shorter leases.
- Zoned schools: J K Hileman El (math 42% / reading 47%, grade F, #1,155 of 4,322 statewide, top 29%, 384 students, 76% FRL); Morris Upchurch Middle (math 35% / reading 42%, grade F, #704 of 1,662 statewide, top 43%, 274 students, 61% FRL); Queen City H S (math 47% / reading 47%, grade D-, #591 of 1,632 statewide, top 38%, 296 students, 53% FRL).
- Market conditions: 65 active listings in the ZIP; 1 comparable units currently listed for rent nearby; 12 units permitted in Cass County in 2024 (0 in 5+ unit buildings).
Forward outlook
- In year one you build about $4k of equity ($587 loan paydown + $3k appreciation (3.7% local appreciation)).
- Cass County population projected to shrink 9% by 2050 — rents likely to lag national; underwrite the cash flow, not the appreciation.
- At projected returns (3.7% appreciation + 3.0% rent growth), your $24k cash investment doubles in ~5 years — after that, you're playing with house money.
- By year 9, paydown + projected appreciation supports a ~$32k cash-out refi (75% LTV) — recoverable capital for the next deal without selling this one.
Negotiation context
- It's been on market 41 days — a 3% lower offer ($82k) is reasonable based on typical stale-listing flexibility.
Risks & watch-outs
- Climate carrying-cost: major wind risk, 27% chance of damaging wind over 30y; major wildfire risk; extreme-heat days projected 7→23/yr by 2055 (HVAC capex compounding) — expect insurance premiums to compound above CPI over the hold.
Questions for the listing agent
- It's been on market 41 days. Have you received any prior offers? Is the seller open to a 3% concession, seller financing, or rate buy-down credit?
- Built in 1965 — when were the roof, HVAC, electrical panel, plumbing, and water heater last replaced?
- Is there a deadline driving the sale (1031 exchange, divorce, estate, relocation)? That informs how much negotiation room exists.
- Schools are D-rated, which usually means shorter tenancies and higher turnover. Who's the typical renter profile here, and what's been the actual vacancy rate?
- What's the average days-on-market for RENTAL listings here right now (not sales)? A rising rental-DOM trend means longer vacancies and softer asking-rent achievability than the comps imply.
- What's the recent tenant-quality profile in this submarket — average credit score on applications, eviction rate, late-payment / NSF rate, and stable-employment percentage? A property-management company in the area should have these aggregated.
- How much new for-sale + rental construction is in the pipeline within 1–3 miles? Heavy new supply typically softens prices + rents 12–24 months out; constrained supply supports both.
Investment metrics
- 1% rule
- 1.06% ✓
- Cap rate
- 8.14%
- Cash-on-cash
- 6.60%
- DSCR
- 1.29
- GRM
- 7.9
CMA / ARV
- ARV (median comp)
- $117,816
- List price
- $84,900
- Delta
- -27.94%
- Verdict
- UNDERPRICED
- Comps
- 1 within 2.0 mi
Show comp detail 1 sale within ~0.75 mi
| Address | Dist | Beds/Ba | Sqft | Sold | Price | $/sf | Match |
|---|---|---|---|---|---|---|---|
| 308 West Lanark St | 0.53mi | 3/1.0 (+1) | 999 (+13%) | 9mo | $120,000 | $120 | 41 |
Match score weights: distance 35% · size 25% · config 20% · recency 20%. Top-matched comps best support the ARV.
Projected returns pro-forma
3.69% appreciation · 3.0% rent growth · sell at horizon
- IRR
- 15.4%
- Equity multiple
- 1.91×
- Total profit
- $21,688
- Equity at exit
- $41,500
- IRR
- 16.6%
- Equity multiple
- 3.60×
- Total profit
- $61,809
- Equity at exit
- $66,671
Cash invested: $23,772 (down + closing). Projections, not guarantees.
Landlord ↔ Tenant lean methodology
- Overall (STATE)
- 87 Strongly Landlord-Friendly
- State Texas
- 87 Strongly Landlord-Friendly · R+5
- County
- — inherits STATE
- City
- — inherits STATE
ZIP-level market 75572
- Home prices YoY
- 2.6%
- Active inventory
- 65
- Price-to-rent
- 7.9×
Monthly cashflow live
- Estimated rent
- $900 medium interval (Pro) →
- Mortgage (P&I)
- −$445
- Tax from tax record
- −$100 /mo · $1,196/yr
- Insurance
- −$35
- HOA
- −$0
- Vacancy / Maint / Mgmt
- −$189
- Net cashflow
- $131
Break-even live
Sensitivity live
| Price | -10% $179 | -5% $155 | +0% $131 | +5% $107 | +10% $83 |
|---|---|---|---|---|---|
| Rent | -10% $60 | -5% $95 | +0% $131 | +5% $166 | +10% $202 |
| Rate | -1.0pp $173 | -0.5pp $152 | base $131 | +0.5pp $109 | +1.0pp $86 |
UW: 25.0% down · 7.5% · 30yr · 1.5% tax · 5.0% vac · 8.0% maint · 8.0% mgmt
Financing live
Cash to close
- Down payment
- $21,225
- Closing costs
- $2,547
- Reserves months
- —
- Total cash needed
- —
Loan-product check · same deal, 3 products live
Conventional
25% down · 7.5% · 30yr
- Down + closing
- —
- Monthly P&I
- —
- Monthly cashflow
- —
- DSCR
- —
- Eligible?
- —
Personal DTI + credit; lowest rate.
DSCR
20% down · 8.5% · 30yr
- Down + closing
- —
- Monthly P&I
- —
- Monthly cashflow
- —
- DSCR
- —
- Eligible?
- —
No personal income docs; deal must DSCR.
Hard money
10% down · 12.0% · 12mo
- Down + closing
- —
- Monthly P&I
- —
- Monthly cashflow
- —
- DSCR
- —
- Eligible?
- —
Short-term bridge; refi at stabilization.
Rent comps 1 comps
| Address | Beds | Baths | Sqft | Rent | $/sqft | DOM | Units | Dist |
|---|---|---|---|---|---|---|---|---|
| 205 Clearview St Unit B Atlanta, TX | 2.0 | 1.0 | 962 | $900 | $0.94 | 45d | 1 | 1.06mi |
Listing history 18 events
-
2026-06-21days on market $84,900 Active 41 DOM
-
2026-06-19days on market $84,900 Active 39 DOM
-
2026-06-18days on market $84,900 Active 38 DOM
-
2026-06-17days on market $84,900 Active 37 DOM
-
2026-06-16days on market $84,900 Active 36 DOM
-
2026-06-15days on market $84,900 Active 35 DOM
-
2026-06-14days on market $84,900 Active 33 DOM
-
2026-06-13days on market $84,900 Active 32 DOM
-
2026-06-10days on market $84,900 Active 30 DOM
-
2026-06-09days on market $84,900 Active 29 DOM
-
2026-06-08days on market $84,900 Active 28 DOM
-
2026-06-07days on market $84,900 Active 27 DOM
-
2026-06-03days on market $84,900 Active 23 DOM
-
2026-06-02days on market $84,900 Active 22 DOM
-
2026-06-01days on market $84,900 Active 21 DOM
-
2026-05-31days on market $84,900 Active 20 DOM
-
2026-05-30days on market $84,900 Active 19 DOM
-
2026-04-09$84,900 Active 283-char remark
ⓘ Source: listings_history table (triggers on properties + properties_extension) + one-shot
backfill from property_details.listing_events for pre-trigger history.
Tax reassessment forecast TX · Resets to sale price
- Current annual tax
- $1,196 · $100/mo
- Projected year-2 tax
- $1,554 · $129/mo
- Expected delta
- +$358/yr (+$30/mo · 29.9%)
ⓘ Screening estimate from a state-policy table — verify with the county assessor before closing.
Climate risk First Street
- Flood 1/10 Low FEMA zone X (unshaded) · 0% chance over 30 yrs
- Wildfire 6/10 Major
- Heat 7/10 Severe 7 d/yr ≥112°F today · 23 d/yr by 30 yrs out
- Wind 6/10 Major 27% chance of damaging wind over 30 yrs
- Air quality 1/10 Low 0 unhealthy d/yr today · 0 by 30 yrs out
Nearby sold comps map
Loading sold comps map…
Walkable amenities ~0.75 mi
Loading nearby amenities…
Taxation est. · year 1
- Rental income
- $10,800
- − Mortgage interest
- −$4,756
- − Property taxes
- −$1,196
- − Insurance
- −$424
- − Repairs & maintenance
- −$864
- − Management
- −$864
- − Depreciation
- −$2,470
- Taxable income
- $226
- Est. tax owed @ 24.0%
- −$54
- After-tax cash flow
- $1,514/yr
For passive investors: Depreciation is non-cash, so a rental often shows a tax loss while cash-flowing — sheltering income. Rental losses are passive: they offset passive income freely, and up to $25,000/yr can offset ordinary (W-2) income if you actively participate and your MAGI is under $100k (phasing out to $0 by $150k); unused losses carry forward. On sale, claimed depreciation is recaptured at up to 25%, and gains may owe capital-gains tax (a 1031 exchange can defer both). Figures are a year-1 estimate at your 24.0% rate — not tax advice; consult a CPA.
Schools (NCES district)
- District
- Queen City ISD
- NCES district ID
- 4836210
- Math proficiency
- 39% ▼ -3.00%
- Reading proficiency
- 45% ▼ -4.00%
- Median HH income
- $43,663
- Composite
- 35.53/100
- National rank
- #4908
- State rank
- #355 of 826 in TX
Livability — Queen City
- Score
- 64/100
- State rank
- #735
- US rank
- #13663
Category grades
Schools grade is shown separately in the Schools card above.
Census & demographics
- Census place
- Queen City, TX
- Population (ZIP)
- 2,942
Population outlook (Cass County) Hauer SSP2
- Today (2025)
- 29,998 people
- By 2030
- 29,583 · -1.4%
- By 2040
- 28,512 · -5.0%
- By 2050
- 27,230 · -9.2%
- By 2075
- 24,917 · -16.9%
- By 2100
- 21,582 · -28.1%
Race, ethnicity, and origin ACS 2023
- Neighborhood character
- Predominantly White (80%)
- Race & ethnicity
- White 80% Black 16% Two or more races 3%
- Common ancestry
- Serbian 1% Slovak 1% Iranian 1%
- Foreign-born
- 2%
- Languages at home
- 93% English-only · German/W. Germanic 6% Arabic 1%
Political lean MEDSL · Cass
- 2024 margin
- Solid R (+65.7) · D 17.0% · R 82.7%
- 2008→2024 swing
- -25.2pp toward R · 2008: -40.4pp · 2024: -65.7pp
- All cycles
- 2024: R+65.7 2020: R+59.1 2016: R+59.7 2012: R+49.5 2008: R+40.4
Not yet ingested
- Civics
- —
Market trends
- HPI YoY
- ▲ 3.69%
- Current HPI
- 143.673
- Rent YoY
- —
- Metro
- —
- State GDP YoY
- ▲ 3.95%
- F500 in state
- 110
Industry mix (Fortune 500 HQ in TX)
| Industry | F500 HQs | Revenue |
|---|---|---|
| Energy | 16 | $1,198B |
|
||
| Technology | 5 | $198B |
|
||
| Engineering / Construction | 4 | $72B |
|
||
| Energy Services | 3 | $60B |
|
||
| Utilities | 3 | $41B |
|
||
| Healthcare | 2 | $330B |
|
||
Price history
1 event — show timeline
- 2026-04-09 Listed $84,900 TBOR
Property tax history
+8.2%/yrLatest (2025): $1,196 · +17.6% YoY. Source: county tax records.
Cash-flow waterfall
monthlySold comps — $/sqft
last 12 mo · ≤1 miLoading sold comps…