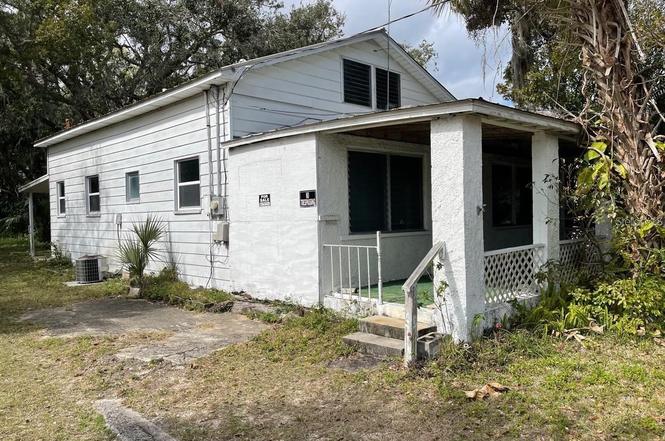
142 Park Blvd · New Smyrna Beach, FL
Flood risk 5/10 · Moderate
- FEMA flood zone
- X (unshaded)
- Chance of flooding over 30 yrs
- 0.24%
- Est. flood insurance / yr
- $507 – $1,088
Fire risk 4/10 · Minor
- Est. fire insurance / yr
- $947 – $1,759
Heat risk 10/10 · Severe
- Hot days now (above 105°F)
- 7 days/yr
- Hot days in 30 yrs
- 19 days/yr
Wind risk 10/10 · Severe
- Chance of severe wind over 30 yrs
- 99.0%
Air-quality risk 2/10 · Minimal
- Unhealthy air days now
- 1 days/yr
- Unhealthy air days in 30 yrs
- 1 days/yr
Risk factors via First Street. Map © Google.
Why this score? — see what drove the D+ grade
The composite is a weighted blend of 9 inputs, each scored 0–100. Each bar is that input's sub-score; the figure is the points it added to the 100-point composite (weight × sub-score).
- Cash flow +15.6/30.0
- ARV discount +7.5/15.0
- DSCR +4.8/10.0
- 1% rule +3.9/10.0
- Rent growth +3.9/5.0
- Schools +3.9/10.0
- Livability +3.5/5.0
- Condition / age +2.5/5.0
- Appreciation +0.0/10.0
$180,000
🖨 Deal sheet 📄 Offer letter ✓ Due diligence
Listing remarks
Finally--court approval for sale has been obtained at $180,000--sale can now be completed. Built circa 1928, this 2/1 has a 12 x 32 loft that could be finished for extra living area or another bedroom and also an enclosed area of the front porch that could be a 3rd bedroom. Zoned residential--R5-- the highest and best use is potentially for multifamily purposes as the lot is 238 ft deep and the property is located on the corner of SR 44 and Park Blvd.
Key facts
- 0.23 acre lot
- Parking
- Built 1928
Property features AI
Finance
- Other: Located on a corner (SR 44 to Park Blvd); Living area about 936 (public records); Building area total about 1,586 (public records); Property zoned 10R5; Listed as fixer
- HOA & community: No development association
Exterior
- Parking: Carport (1 space)
- Utilities: Public water; Public sewer; Public utilities
- Home design: Single family residence; Residential property; Fixer condition; Single-story; East-facing
- Construction: Frame construction; Metal roof; Crawlspace foundation; Built on lot of about 0.23 acres (approx. 43 x 238)
- Exterior features: Other exterior features
Interior
- Kitchen: Range; Refrigerator
- Bedrooms: 3 bedrooms
- Flooring: Linoleum; Wood
- Bathrooms: 1 full bathroom
- Heating & cooling: Central heating; Central air conditioning
- Interior features: Attic; Decorative fireplace; No additional interior features listed
- Laundry & utility: Laundry area in kitchen
Neighborhood map
What this means for you Summary
Snapshot
- This is a 2-bed/1.0-bath single-family listed at $180k.
Deal economics
- At list price, monthly cash flow is $77 ($921/yr) — positive.
- The deal already cash-flows at list — no discount required.
- To meet the 1% rule (rent ≥ 1% of price), the offer needs to be $160k (11.2% below list).
- Recommended offer: $158k (12.0% below list) — sets the bar for market timing.
Location & tenants
- Location reads 69/100 on livability (#474 in FL) — a middle-class / working-renter tenant base. Strengths: crime A+, housing A+, employment B; Watch: amenities F, commute F, health & safety D-.
- Volusia (suburban): math 44% / reading 49% proficiency, ranked #47 of 73 in FL (top 64%) — families likely to look elsewhere, expect single-tenant / working-renter base with shorter leases.
- Market conditions: Rents rising fast (+5.6%/yr); 601 active listings in the ZIP; 6 comparable units currently listed for rent nearby; rentals at typical pace (median 23d on market — plan ~3-4 weeks tenant-placement turnaround); solid renter incomes; 3,402 units permitted in Volusia County in 2024 (681 in 5+ unit buildings).
Forward outlook
- Local home prices are declining (-3.0%/yr); year-one equity from $1k of loan paydown is wiped out by about $5k of value loss. Plan a longer hold.
- Volusia County population projected at +19% by 2050 — long-run rental-demand tailwind backs the buy-and-hold thesis.
Negotiation context
- It's been on market 183 days — a 12% lower offer ($158k) is reasonable based on typical stale-listing flexibility.
- 7 sale attempts since 3y ago; this cycle's ask has dropped $20k (10%) from the opening price — seller is motivated, your offer sets the floor, not the list.
Risks & watch-outs
- Watch-outs: built in 1928 — expect roof / HVAC / electrical / plumbing capex.
- Climate carrying-cost: moderate flood risk; severe wind risk, 99% chance of damaging wind over 30y; extreme-heat days projected 7→19/yr by 2055 (HVAC capex compounding) — expect insurance premiums to compound above CPI over the hold.
Questions for the listing agent
- It's been on market 183 days. Have you received any prior offers? Is the seller open to a 12% concession, seller financing, or rate buy-down credit?
- Built in 1928 — when were the roof, HVAC, electrical panel, plumbing, and water heater last replaced?
- Why hasn't it sold? Are there any deal-killer items the seller is aware of (foundation, flood, title, zoning, code violations)?
- Is there a deadline driving the sale (1031 exchange, divorce, estate, relocation)? That informs how much negotiation room exists.
- Schools are B-rated — typically a magnet for longer-tenancy family renters. What's the average tenant stay here, and is there a school-zone premium baked into asking?
- The area grade is low — what's the realistic commute time and amenity access for the typical tenant pool here? Any planned neighborhood developments (good or bad) we should know about?
- What's the average days-on-market for RENTAL listings here right now (not sales)? A rising rental-DOM trend means longer vacancies and softer asking-rent achievability than the comps imply.
- What's the recent tenant-quality profile in this submarket — average credit score on applications, eviction rate, late-payment / NSF rate, and stable-employment percentage? A property-management company in the area should have these aggregated.
- How much new for-sale + rental construction is in the pipeline within 1–3 miles? Heavy new supply typically softens prices + rents 12–24 months out; constrained supply supports both.
Investment metrics
- 1% rule
- 0.89% ✗
- Cap rate
- 6.80%
- Cash-on-cash
- 1.83%
- DSCR
- 1.08
- GRM
- 9.4
CMA / ARV
No comps found within radius.
Projected returns pro-forma
-3.0% appreciation · 5.6% rent growth · sell at horizon
- IRR
- -10.6%
- Equity multiple
- 0.60×
- Total profit
- $-20,000
- Equity at exit
- $26,839
- IRR
- 1.9%
- Equity multiple
- 1.15×
- Total profit
- $7,410
- Equity at exit
- $15,563
Cash invested: $50,400 (down + closing). Projections, not guarantees.
Landlord ↔ Tenant lean methodology
- Overall (STATE)
- 87 Strongly Landlord-Friendly
- State Florida
- 87 Strongly Landlord-Friendly · R+3
- County
- — inherits STATE
- City
- — inherits STATE
ZIP-level market 32168
- Home prices YoY
- -27.0%
- Rents YoY
- 5.6%
- Active inventory
- 601
- Price-to-rent
- 9.4×
Monthly cashflow live
- Estimated rent
- $1,599 high interval (Pro) →
- Mortgage (P&I)
- −$944
- Tax from tax record
- −$168 /mo · $2,012/yr
- Insurance
- −$75
- HOA
- −$0
- Vacancy / Maint / Mgmt
- −$336
- Net cashflow
- $77
Break-even live
UW: 25.0% down · 7.5% · 30yr · 1.5% tax · 5.0% vac · 8.0% maint · 8.0% mgmt
Financing live
Cash to close
- Down payment
- $45,000
- Closing costs
- $5,400
- Reserves months
- —
- Total cash needed
- —
Loan-product check · same deal, 3 products live
Conventional
25% down · 7.5% · 30yr
- Down + closing
- —
- Monthly P&I
- —
- Monthly cashflow
- —
- DSCR
- —
- Eligible?
- —
Personal DTI + credit; lowest rate.
DSCR
20% down · 8.5% · 30yr
- Down + closing
- —
- Monthly P&I
- —
- Monthly cashflow
- —
- DSCR
- —
- Eligible?
- —
No personal income docs; deal must DSCR.
Hard money
10% down · 12.0% · 12mo
- Down + closing
- —
- Monthly P&I
- —
- Monthly cashflow
- —
- DSCR
- —
- Eligible?
- —
Short-term bridge; refi at stabilization.
Rent comps 6 comps
| Address | Beds | Baths | Sqft | Rent | $/sqft | DOM | Units | Dist |
|---|---|---|---|---|---|---|---|---|
| 200 Robert St New Smyrna Beach, FL | 1.0 | 1.0 | 620 | $1,310 | $2.11 | 23d | 1 | 0.11mi |
| 110 Rush St New Smyrna Beach, FL | 1.0 | 1.0 | 700 | $1,300 | $1.86 | 14d | 1 | 0.58mi |
| 324 N Orange St Unit 1 New Smyrna Beach, FL | 1.0 | 1.0 | 697 | $1,300 | $1.87 | 23d | 1 | 0.62mi |
| 486 Oak St Unit B New Smyrna Beach, FL | 3.0 | 2.0 | 400 | $1,325 | $3.31 | 14d | 1 | 0.63mi |
| 1801 Sugartree Cir New Smyrna Beach, FL | 1.0–2.0 | 1.0–2.0 | 720 | $1,825 | $2.53 | 23d | 1 | 0.77mi |
| 501 10th St New Smyrna Beach, FL | 1.0 | 1.0 | 667 | $1,200 | $1.80 | 23d | 1 | 1.26mi |
Listing history 7 events
-
2026-06-18days on market $180,000 Active 183 DOM
-
2026-06-17days on market $180,000 Active 182 DOM
-
2026-06-16days on market $180,000 Active 181 DOM
-
2026-06-15remarks 455-char remark
-
2026-06-15price $180,000 Active 180 DOM
-
2026-06-15remarks 443-char remark
-
2026-06-15$199,900 Active 180 DOM
ⓘ Source: listings_history table (triggers on properties + properties_extension) + one-shot
backfill from property_details.listing_events for pre-trigger history.
Tax reassessment forecast FL · Resets to sale price
- Current annual tax
- $2,012 · $168/mo
- Projected year-2 tax
- $2,012 · $168/mo
- Expected delta
- $0/yr ($0/mo · 0.0%)
ⓘ Screening estimate from a state-policy table — verify with the county assessor before closing.
Climate risk First Street
- Flood 5/10 Major FEMA zone X (unshaded) · 24% chance over 30 yrs
- Wildfire 4/10 Moderate
- Heat 10/10 Extreme 7 d/yr ≥105°F today · 19 d/yr by 30 yrs out
- Wind 10/10 Extreme 99% chance of damaging wind over 30 yrs
- Air quality 2/10 Low 1 unhealthy d/yr today · 1 by 30 yrs out
Nearby sold comps map
Loading sold comps map…
Walkable amenities ~0.75 mi
Loading nearby amenities…
Taxation est. · year 1
- Rental income
- $19,190
- − Mortgage interest
- −$10,083
- − Property taxes
- −$2,012
- − Insurance
- −$900
- − Repairs & maintenance
- −$1,535
- − Management
- −$1,535
- − Depreciation
- −$5,236
- Taxable loss
- −$2,112
- Est. tax savings @ 24.0%
- +$507
- After-tax cash flow
- $1,428/yr
For passive investors: Depreciation is non-cash, so a rental often shows a tax loss while cash-flowing — sheltering income. Rental losses are passive: they offset passive income freely, and up to $25,000/yr can offset ordinary (W-2) income if you actively participate and your MAGI is under $100k (phasing out to $0 by $150k); unused losses carry forward. On sale, claimed depreciation is recaptured at up to 25%, and gains may owe capital-gains tax (a 1031 exchange can defer both). Figures are a year-1 estimate at your 24.0% rate — not tax advice; consult a CPA.
Schools (NCES district)
- District
- Volusia
- NCES district ID
- 1201920
- Math proficiency
- 44% ▼ -9.00%
- Reading proficiency
- 49% ▼ -3.00%
- Median HH income
- $42,946
- Composite
- 39.2/100
- National rank
- #4019
- State rank
- #47 of 73 in FL
Livability — New Smyrna Beach
- Score
- 69/100
- State rank
- #474
- US rank
- #8577
Category grades
Schools grade is shown separately in the Schools card above.
Census & demographics
- Census place
- New Smyrna Beach, FL
- County
- Volusia County · 556,871 people
- City population
- 42,039
- Metro
- Deltona-Daytona Beach-Ormond Beach, FL
- Population (ZIP)
- 31,847
- Household income
- $77,083
- Rent vs Own
- Severe rent burden
- 1139.0
Population outlook (Volusia County) Hauer SSP2
- Today (2025)
- 572,749 people
- By 2030
- 598,695 · +4.5%
- By 2040
- 644,880 · +12.6%
- By 2050
- 681,451 · +19.0%
- By 2075
- 759,957 · +32.7%
- By 2100
- 778,902 · +36.0%
Race, ethnicity, and origin ACS 2023
- Neighborhood character
- Predominantly White (85%)
- Race & ethnicity
- White 85% Hispanic / Latino 6% Black 5% Two or more races 4%
- Hispanic origin (detail)
- Mexican 2% Puerto Rican 1%
- Common ancestry
- Romanian 4% Italian 3% Lithuanian 2%
- Foreign-born
- 5% · Canada, Vietnam
- Languages at home
- 93% English-only · Spanish 5% Other Indo-European 1%
Political lean MEDSL · Volusia
- 2024 margin
- Strong R (+21.8) · D 38.7% · R 60.5%
- 2008→2024 swing
- -27.4pp toward R · 2008: 5.7pp · 2024: -21.8pp
- All cycles
- 2024: R+21.8 2020: R+14.1 2016: R+13.1 2012: R+1.2 2008: D+5.7
Not yet ingested
- Civics
- —
Market trends
- HPI YoY
- ▼ -129.58%
- Current HPI
- 350.4259
- Rent YoY
- ▲ 5.60%
- Metro
- Deltona-Daytona Beach-Ormond Beach, FL
- State GDP YoY
- ▲ 3.28%
- F500 in state
- 36
Industry mix (Fortune 500 HQ in FL)
| Industry | F500 HQs | Revenue |
|---|---|---|
| Industrial Technology | 2 | $29B |
|
||
| Insurance | 2 | $17B |
|
||
| Retail | 1 | $60B |
|
||
| Technology Distribution | 1 | $58B |
|
||
| Homebuilding | 1 | $35B |
|
||
| Technology Manufacturing | 1 | $35B |
|
||
Price history
-28.0% since first listed17 events — show timeline
- 2026-06-15 Price Changed $180,000 Stellar MLS as Distributed by MLS Grid
- 2026-06-14 Relisted — Stellar MLS as Distributed by MLS Grid
- 2025-10-31 Listed $199,900 Stellar MLS as Distributed by MLS Grid
- 2025-09-19 Listing Removed — Stellar MLS as Distributed by MLS Grid
- 2025-05-26 Price Changed $199,900 Stellar MLS as Distributed by MLS Grid
- 2025-01-01 Relisted — Stellar MLS as Distributed by MLS Grid
- 2025-01-01 Price Changed $219,900 Stellar MLS as Distributed by MLS Grid
- 2024-12-07 Listing Removed — Stellar MLS as Distributed by MLS Grid
- 2024-12-06 Price Changed $199,900 Stellar MLS as Distributed by MLS Grid
- 2024-10-04 Relisted — Stellar MLS as Distributed by MLS Grid
- 2024-09-30 Listing Removed — Stellar MLS as Distributed by MLS Grid
- 2024-04-04 Relisted — Stellar MLS as Distributed by MLS Grid
- 2024-03-31 Listing Removed — Stellar MLS as Distributed by MLS Grid
- 2024-02-24 Price Changed $239,900 Stellar MLS as Distributed by MLS Grid
- 2024-01-15 Relisted — Stellar MLS as Distributed by MLS Grid
- 2023-12-06 Pending — Stellar MLS as Distributed by MLS Grid
- 2023-02-16 Listed $249,900 Stellar MLS as Distributed by MLS Grid
Property tax history
+25.0%/yrLatest (2025): $2,012 · +11.2% YoY. Source: county tax records.
Cash-flow waterfall
monthlySold comps — $/sqft
last 12 mo · ≤1 miLoading sold comps…