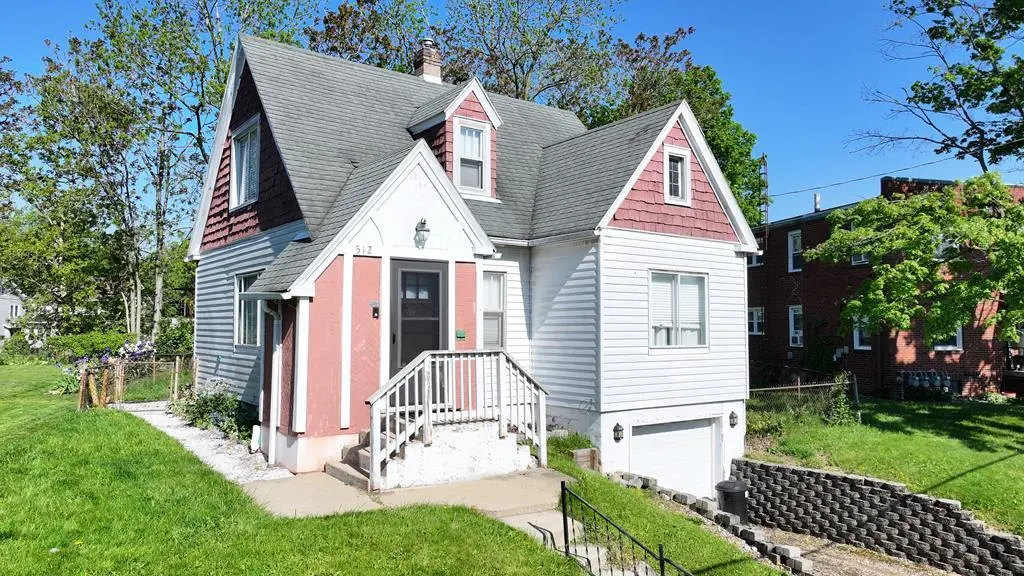
512 Harter Ave · Mansfield, OH
Flood risk 1/10 · Minimal
- FEMA flood zone
- X (unshaded)
- Chance of flooding over 30 yrs
- 0.0%
- Est. flood insurance / yr
- $473 – $860
Fire risk 1/10 · Minimal
- Est. fire insurance / yr
- $713 – $1,323
Heat risk 3/10 · Minor
- Hot days now (above 96°F)
- 7 days/yr
- Hot days in 30 yrs
- 17 days/yr
Wind risk 2/10 · Minimal
- Chance of severe wind over 30 yrs
- —
Air-quality risk 2/10 · Minimal
- Unhealthy air days now
- 1 days/yr
- Unhealthy air days in 30 yrs
- 1 days/yr
Risk factors via First Street. Map © Google.
Why this score? — see what drove the D+ grade
The composite is a weighted blend of 9 inputs, each scored 0–100. Each bar is that input's sub-score; the figure is the points it added to the 100-point composite (weight × sub-score).
- Cash flow +15.0/30.0
- ARV discount +15.0/15.0
- DSCR +4.6/10.0
- Livability +3.8/5.0
- 1% rule +3.5/10.0
- Rent growth +2.5/5.0
- Condition / age +2.5/5.0
- Schools +2.3/10.0
- Appreciation +0.0/10.0
$104,500
🖨 Deal sheet 📄 Offer letter ✓ Due diligence
Listing remarks MLS
Ready to Move in Cape Cod - 2 bedrooms with potential 3rd bedroom/office/walk-in closet off 2nd bedroom - Fresh paint, new kitchen and bathroom flooring, just cleaned carpets, and fresh landscaping
Key facts
- Updated breaker box
- Bonus space
- Fenced backyard
Tags
Property features AI
Exterior
- Parking: Attached garage (1 car); Gravel parking
- Utilities: Public water; Public sewer
- Home design: Single-family residential; 2 stories
- Construction: Aluminum siding; Composition roof
- Exterior features: Garden; Fenced yard; Rolling slope, irregular and level lot features
Interior
- Kitchen: Refrigerator; Range
- Bathrooms: 1 full bathroom
- Heating & cooling: Forced air heating (natural gas); Central air conditioning
- Interior features: Refrigerator; Range; Full basement
- Laundry & utility: Laundry in basement
Neighborhood map
What this means for you Summary
Snapshot
- This is a 2-bed/1.0-bath single-family listed at $104k.
Deal economics
- At list price, monthly cash flow is $33 ($395/yr) — positive.
- The deal already cash-flows at list — no discount required.
- To meet the 1% rule (rent ≥ 1% of price), the offer needs to be $89k (14.6% below list).
- Recommended offer: $89k (14.6% below list) — sets the bar for 1% rule.
- Cap rate 6.7% vs local median 4.2% in Mansfield — top-decile yield for the area; either an underpriced asset or a hidden risk that comps aren't pricing in. Stress-test before assuming the spread holds.
Location & tenants
- Location reads 76/100 on livability (#224 in OH, #3,525 nationally) — a middle-class / working-renter tenant base. Strengths: commute A+, cost of living A+, housing A+; Watch: schools C-, crime D-, amenities D-.
- Mansfield City (urban): math 24% / reading 33% proficiency, ranked #590 of 656 in OH (top 90%) — low school quality limits family demand, transient renter base, plan for 1-2y turnover; 80% free/reduced lunch — lower-income household profile, screen leases tightly.
- Market conditions: 56 active listings in the ZIP; 8 comparable units currently listed for rent nearby; rentals lingering (median 44d on market — plan ~5-8 weeks vacancy on turnover, expect pricing pressure); 100% of comp listings sitting > 30 days — soft ceiling on asking rent; 145 units permitted in Richland County in 2024 (0 in 5+ unit buildings).
Forward outlook
- Local home prices are declining (-3.0%/yr); year-one equity from $722 of loan paydown is wiped out by about $3k of value loss. Plan a longer hold.
- Richland County population projected at -18% by 2050 — secular population decline; favor cash flow + early exit over multi-decade hold.
Negotiation context
- Only 10 days on market — expect competitive offers; lowballing is unlikely to land.
- 2 sale attempts since 5y ago with the ask held roughly flat each time — persistent listings suggest the price (not the market) is what's stuck; bring a comps-based counter.
- Current owner paid $65k; list at $104k implies a 61% gain — meaningful room to come down on a strong offer.
Risks & watch-outs
- Watch-outs: built in 1935 — expect roof / HVAC / electrical / plumbing capex.
Questions for the listing agent
- Built in 1935 — when were the roof, HVAC, electrical panel, plumbing, and water heater last replaced?
- Is there a deadline driving the sale (1031 exchange, divorce, estate, relocation)? That informs how much negotiation room exists.
- Crime grade is D in this area — have there been break-ins, vandalism, or insurance claims at this property in the last 3 years? What carrier currently insures it and at what premium?
- The area grade is low — what's the realistic commute time and amenity access for the typical tenant pool here? Any planned neighborhood developments (good or bad) we should know about?
- What's the average days-on-market for RENTAL listings here right now (not sales)? A rising rental-DOM trend means longer vacancies and softer asking-rent achievability than the comps imply.
- What's the recent tenant-quality profile in this submarket — average credit score on applications, eviction rate, late-payment / NSF rate, and stable-employment percentage? A property-management company in the area should have these aggregated.
- How much new for-sale + rental construction is in the pipeline within 1–3 miles? Heavy new supply typically softens prices + rents 12–24 months out; constrained supply supports both.
Investment metrics
- 1% rule
- 0.85% ✗
- Cap rate
- 6.67%
- Cash-on-cash
- 1.35%
- DSCR
- 1.06
- GRM
- 9.8
CMA / ARV
- ARV (on-the-fly)
- $134,000
- Comps found
- 12
Show comp detail 12 sales within ~0.75 mi
| Address | Dist | Beds/Ba | Sqft | Sold | Price | $/sf | Match |
|---|---|---|---|---|---|---|---|
| 512 Harter Ave | 0.00mi | 2/1.0 | 1,000 (0%) | 0mo | $98,500 | $99 | 100 |
| 151 Grover Ave | 0.30mi | 3/1.0 (+1) | 1,029 (+3%) | 3mo | $128,900 | $125 | 74 |
| 201 Walter Ave | 0.33mi | 2/2.0 | 1,056 (+6%) | 0mo | $156,900 | $149 | 71 |
| 320 Bartley Ave | 0.63mi | 2/1.5 | 992 (-1%) | 1mo | $146,500 | $148 | 66 |
| 101 Chilton Ave | 0.32mi | 3/1.0 (+1) | 1,092 (+9%) | 3mo | $146,000 | $134 | 62 |
| 530 Wood St | 0.17mi | 3/2.0 (+1) | 1,126 (+13%) | 0mo | $160,000 | $142 | 62 |
| 96 Glenwood Hts | 0.57mi | 2/1.0 | 1,040 (+4%) | 6mo | $95,000 | $91 | 61 |
| 674 Hillgrove Ave | 0.48mi | 3/1.0 (+1) | 1,062 (+6%) | 6mo | $155,000 | $146 | 57 |
| 133 Winwood Dr | 0.37mi | 2/2.0 | 864 (-14%) | 3mo | $177,000 | $205 | 53 |
| 151 Ohio St | 0.48mi | 2/1.0 | 1,126 (+13%) | 5mo | $68,000 | $60 | 52 |
| 273 Hammond Ave | 0.61mi | 3/1.0 (+1) | 1,092 (+9%) | 3mo | $134,900 | $124 | 49 |
| 153 Ford St | 0.70mi | 1/1.0 (-1) | 1,106 (+11%) | 6mo | $37,000 | $33 | 40 |
Match score weights: distance 35% · size 25% · config 20% · recency 20%. Top-matched comps best support the ARV.
Projected returns pro-forma
-3.0% appreciation · 3.0% rent growth · sell at horizon
- IRR
- -14.2%
- Equity multiple
- 0.49×
- Total profit
- $-14,853
- Equity at exit
- $15,581
- IRR
- -5.4%
- Equity multiple
- 0.65×
- Total profit
- $-10,303
- Equity at exit
- $9,035
Cash invested: $29,260 (down + closing). Projections, not guarantees.
Landlord ↔ Tenant lean methodology
- Overall (STATE)
- 73 Landlord-Friendly
- State Ohio
- 73 Landlord-Friendly · R+6
- County
- — inherits STATE
- City
- — inherits STATE
ZIP-level market 44907
- Active inventory
- 56
- Price-to-rent
- 9.8×
Monthly cashflow live
- Estimated rent
- $892 high interval (Pro) →
- Mortgage (P&I)
- −$548
- Tax from tax record
- −$80 /mo · $964/yr
- Insurance
- −$44
- HOA
- −$0
- Vacancy / Maint / Mgmt
- −$187
- Net cashflow
- $33
Break-even live
UW: 25.0% down · 7.5% · 30yr · 1.5% tax · 5.0% vac · 8.0% maint · 8.0% mgmt
Financing live
Cash to close
- Down payment
- $26,125
- Closing costs
- $3,135
- Reserves months
- —
- Total cash needed
- —
Loan-product check · same deal, 3 products live
Conventional
25% down · 7.5% · 30yr
- Down + closing
- —
- Monthly P&I
- —
- Monthly cashflow
- —
- DSCR
- —
- Eligible?
- —
Personal DTI + credit; lowest rate.
DSCR
20% down · 8.5% · 30yr
- Down + closing
- —
- Monthly P&I
- —
- Monthly cashflow
- —
- DSCR
- —
- Eligible?
- —
No personal income docs; deal must DSCR.
Hard money
10% down · 12.0% · 12mo
- Down + closing
- —
- Monthly P&I
- —
- Monthly cashflow
- —
- DSCR
- —
- Eligible?
- —
Short-term bridge; refi at stabilization.
Rent comps 8 comps
| Address | Beds | Baths | Sqft | Rent | $/sqft | DOM | Units | Dist |
|---|---|---|---|---|---|---|---|---|
| 100 Winwood Dr Mansfield, OH | 2.0 | 1.0 | 700 | $725 | $1.04 | 43d | 1 | 0.36mi |
| 19 State St Mansfield, OH | 3.0 | 1.0 | 1040 | $995 | $0.96 | 43d | 1 | 0.38mi |
| 147 Ford St Mansfield, OH | 3.0 | 1.5 | 1286 | $995 | $0.77 | 43d | 1 | 0.67mi |
| 38 Baldwin Ave Apt 3 Mansfield, OH | 1.0 | 1.0 | 800 | $800 | $1.00 | 43d | 1 | 1.01mi |
| 46 Bartley Ave Unit 46 1/2 Mansfield, OH | 1.0 | 1.0 | 800 | $750 | $0.94 | 43d | 1 | 1.01mi |
| 275 Cliffbrook Dr Mansfield, OH | 2.0 | 1.5 | 1200 | $925 | $0.77 | 43d | 1 | 1.09mi |
| 282 Cliffbrook Dr Mansfield, OH | 3.0 | 1.0 | 912 | $1,395 | $1.53 | 43d | 1 | 1.11mi |
| 896 Brookfield Dr Mansfield, OH | 2.0 | 1.0 | 770 | $795 | $1.03 | 43d | 1 | 1.26mi |
Listing history 6 events
-
2026-05-18$104,500 Active
-
2021-07-09soldstatus $64,900
-
2021-07-08soldstatus $64,900 197-char remark
Show marketing remark (197 chars)
Ready to Move in Cape Cod - 2 bedrooms with potential 3rd bedroom/office/walk-in closet off 2nd bedroom - Fresh paint, new kitchen and bathroom flooring, just cleaned carpets, and fresh landscaping
-
2021-04-29$64,900 197-char remark
Show marketing remark (197 chars)
Ready to Move in Cape Cod - 2 bedrooms with potential 3rd bedroom/office/walk-in closet off 2nd bedroom - Fresh paint, new kitchen and bathroom flooring, just cleaned carpets, and fresh landscaping
-
2002-05-24soldstatus $51,000
-
1994-05-09soldstatus $32,500
ⓘ Source: listings_history table (triggers on properties + properties_extension) + one-shot
backfill from property_details.listing_events for pre-trigger history.
Tax reassessment forecast OH · Partial reset (capped growth)
- Current annual tax
- $964 · $80/mo
- Projected year-2 tax
- $1,297 · $108/mo
- Expected delta
- +$333/yr (+$28/mo · 34.6%)
ⓘ Screening estimate from a state-policy table — verify with the county assessor before closing.
Climate risk First Street
- Flood 1/10 Low FEMA zone X (unshaded) · 0% chance over 30 yrs
- Wildfire 1/10 Low
- Heat 3/10 Moderate 7 d/yr ≥96°F today · 17 d/yr by 30 yrs out
- Wind 2/10 Low
- Air quality 2/10 Low 1 unhealthy d/yr today · 1 by 30 yrs out
Nearby sold comps map
Loading sold comps map…
Walkable amenities ~0.75 mi
Loading nearby amenities…
Taxation est. · year 1
- Rental income
- $10,706
- − Mortgage interest
- −$5,854
- − Property taxes
- −$964
- − Insurance
- −$522
- − Repairs & maintenance
- −$857
- − Management
- −$857
- − Depreciation
- −$3,040
- Taxable loss
- −$1,387
- Est. tax savings @ 24.0%
- +$333
- After-tax cash flow
- $728/yr
For passive investors: Depreciation is non-cash, so a rental often shows a tax loss while cash-flowing — sheltering income. Rental losses are passive: they offset passive income freely, and up to $25,000/yr can offset ordinary (W-2) income if you actively participate and your MAGI is under $100k (phasing out to $0 by $150k); unused losses carry forward. On sale, claimed depreciation is recaptured at up to 25%, and gains may owe capital-gains tax (a 1031 exchange can defer both). Figures are a year-1 estimate at your 24.0% rate — not tax advice; consult a CPA.
Schools (NCES district)
- District
- Mansfield City
- NCES district ID
- 3904429
- Math proficiency
- 24% ▼ -19.00%
- Reading proficiency
- 33% ▼ -12.00%
- Median HH income
- $32,435
- Composite
- 23.25/100
- National rank
- #7934
- State rank
- #590 of 656 in OH
Livability — Mansfield
- Score
- 76/100
- State rank
- #224
- US rank
- #3525
Category grades
Schools grade is shown separately in the Schools card above.
Census & demographics
- Census place
- Mansfield, OH
- County
- Richland County · 43,943 people
- City population
- 16,349
- Metro
- Mansfield, OH
- Population (ZIP)
- 16,349
- Household income
- $48,008
- Rent vs Own
- Severe rent burden
- 637.0
Population outlook (Richland County) Hauer SSP2
- Today (2025)
- 115,577 people
- By 2030
- 111,669 · -3.4%
- By 2040
- 103,323 · -10.6%
- By 2050
- 95,135 · -17.7%
- By 2075
- 76,719 · -33.6%
- By 2100
- 57,188 · -50.5%
Race, ethnicity, and origin ACS 2023
- Neighborhood character
- Predominantly White (76%)
- Race & ethnicity
- White 76% Black 13% Two or more races 8% Hispanic / Latino 2% Asian 1%
- Common ancestry
- Romanian 2% Slovak 2% Italian 2%
- Foreign-born
- 2% · Canada
- Languages at home
- 97% English-only · Spanish 1% Other Indo-European 1% German/W. Germanic 1%
Political lean MEDSL · Richland
- 2024 margin
- Solid R (+42.3) · D 28.4% · R 70.8%
- 2008→2024 swing
- -28.8pp toward R · 2008: -13.6pp · 2024: -42.3pp
- All cycles
- 2024: R+42.3 2020: R+39.7 2016: R+37.5 2012: R+20.1 2008: R+13.6
Not yet ingested
- Civics
- —
Market trends
- HPI YoY
- ▼ -137.54%
- Current HPI
- 239.2549
- Rent YoY
- —
- Metro
- Mansfield, OH
- State GDP YoY
- ▲ 1.98%
- F500 in state
- 48
Industry mix (Fortune 500 HQ in OH)
| Industry | F500 HQs | Revenue |
|---|---|---|
| Insurance | 3 | $145B |
|
||
| Industrial Machinery | 3 | $49B |
|
||
| Financial Services | 3 | $24B |
|
||
| Consumer Goods | 2 | $93B |
|
||
| Aerospace / Defense | 2 | $47B |
|
||
| Utilities | 2 | $33B |
|
||
Price history
+221.5% since first listed6 events — show timeline
- 2026-05-18 Listed $104,500 MARMLS
- 2021-07-09 Sold (Public Records) $64,900 Public Records
- 2021-07-08 Sold (MLS) $64,900 MARMLS
- 2021-04-29 Listed $64,900 MARMLS
- 2002-05-24 Sold (Public Records) $51,000 Public Records
- 1994-05-09 Sold (Public Records) $32,500 Public Records
Property tax history
-0.3%/yrLatest (2025): $964 · -2.2% YoY. Source: county tax records.
Cash-flow waterfall
monthlySold comps — $/sqft
last 12 mo · ≤1 miLoading sold comps…