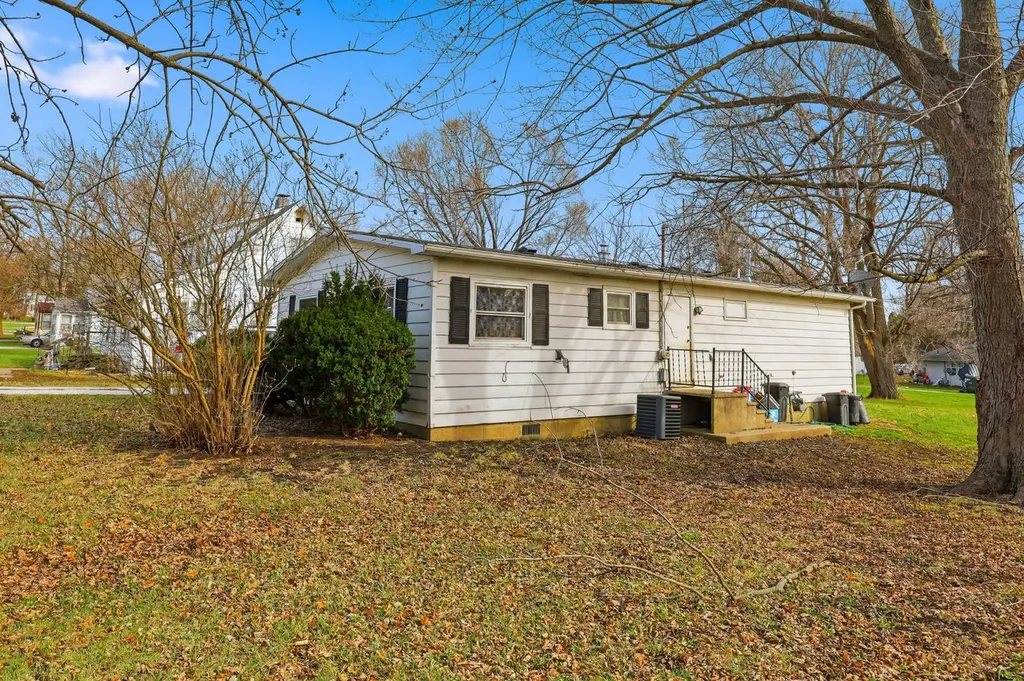
350 E Summer St · Paxton, IL
Flood risk 1/10 · Minimal
- FEMA flood zone
- X (unshaded)
- Chance of flooding over 30 yrs
- 0.0%
- Est. flood insurance / yr
- $473 – $860
Fire risk 1/10 · Minimal
- Est. fire insurance / yr
- $804 – $1,492
Heat risk 3/10 · Minor
- Hot days now (above 103°F)
- 7 days/yr
- Hot days in 30 yrs
- 18 days/yr
Wind risk 2/10 · Minimal
- Chance of severe wind over 30 yrs
- 1.0%
Air-quality risk 2/10 · Minimal
- Unhealthy air days now
- 1 days/yr
- Unhealthy air days in 30 yrs
- 1 days/yr
Risk factors via First Street. Map © Google.
Why this score? — see what drove the B+ grade
The composite is a weighted blend of 9 inputs, each scored 0–100. Each bar is that input's sub-score; the figure is the points it added to the 100-point composite (weight × sub-score).
- Cash flow +30.0/30.0
- ARV discount +15.0/15.0
- DSCR +10.0/10.0
- 1% rule +9.7/10.0
- Livability +3.6/5.0
- Schools +2.7/10.0
- Rent growth +2.5/5.0
- Condition / age +2.5/5.0
- Appreciation +0.0/10.0
$65,000
🖨 Deal sheet 📄 Offer letter ✓ Due diligence
Listing remarks MLS
Home has been remodeled. New carpet thru out. New vinyl in kitchen and bath. New countertop in kitchen. Stove and refrigerator to remain - as is. Walls are freshly cleaned - painted. New central air. Furnace almost new. new fan and tub surround added in bath. Roof under 10 years. Shows well - go show - bring offer.
Key facts
- Ranch home
- Remodeled
- Homesite included
Tags
Property features AI
Finance
- Other: Possession at closing
- Financial info: Special service area: No
- HOA & community: No master association fee required
Exterior
- Parking: Detached garage (1 garage space, 1 total parking)
- Utilities: Public water; Public sewer
- Home design: Detached single-family home; One-story; Fee simple ownership; Rehab completed in 2007
- Construction: Aluminum siding; Built approximately 31–40 years ago; Not built before 1978
- Exterior features: Lot approximately 0.25–0.49 acre; Lot dimensions roughly 50 x 157; Zoned for single-family
Interior
- Kitchen: Kitchen on main level (9 x 17) with vinyl flooring; Refrigerator; Range
- Bedrooms: Master bedroom on main level (12 x 16) with carpet; Second bedroom on main level (11 x 12) with carpet; Additional bedrooms listed
- Flooring: Carpet in living areas and bedrooms; Vinyl in kitchen
- Bathrooms: 1 full bathroom
- Heating & cooling: Forced air heating (natural gas); Central air conditioning
- Interior features: First-floor bedroom; 4 total rooms
- Laundry & utility: Laundry room
Neighborhood map
What this means for you Summary
Snapshot
- This is a 2-bed/1.0-bath single-family listed at $65k.
Deal economics
- At list price, monthly cash flow is $265 ($3k/yr) — positive.
- The deal already cash-flows at list — no discount required.
- Meets the 1% rule at list price ($955 rent vs $65k).
- Cap rate 11.2% vs local median 5.3% in Paxton — top-decile yield for the area; either an underpriced asset or a hidden risk that comps aren't pricing in. Stress-test before assuming the spread holds.
Location & tenants
- Location reads 72/100 on livability (#316 in IL) — a middle-class / working-renter tenant base. Strengths: cost of living A+, housing A+, crime A-; Watch: schools D+, amenities F, commute F.
- Paxton-Buckley-Loda CUD 10 (town): math 33% / reading 29% proficiency, ranked #232 of 620 in IL (top 37%) — families likely to look elsewhere, expect single-tenant / working-renter base with shorter leases.
- Market conditions: 28 active listings in the ZIP; 10 units permitted in Ford County in 2024 (0 in 5+ unit buildings).
Forward outlook
- Local home prices are declining (-3.0%/yr); year-one equity from $449 of loan paydown is wiped out by about $2k of value loss. Plan a longer hold.
- Ford County population projected at -17% by 2050 — secular population decline; favor cash flow + early exit over multi-decade hold.
- At projected returns (-3.0% appreciation + 3.0% rent growth), your $18k cash investment doubles in ~7 years — after that, you're playing with house money.
Negotiation context
- Only 12 days on market — expect competitive offers; lowballing is unlikely to land.
- 4 sale attempts since 20y ago; this cycle's ask is 18% above the opening price — seller raised mid-cycle; expect resistance to lowballs.
- Current owner paid $52k; 24% above their basis — modest negotiation headroom, anchor on the comps not their cost.
Questions for the listing agent
- Is there a deadline driving the sale (1031 exchange, divorce, estate, relocation)? That informs how much negotiation room exists.
- Schools are D-rated, which usually means shorter tenancies and higher turnover. Who's the typical renter profile here, and what's been the actual vacancy rate?
- What's the average days-on-market for RENTAL listings here right now (not sales)? A rising rental-DOM trend means longer vacancies and softer asking-rent achievability than the comps imply.
- What's the recent tenant-quality profile in this submarket — average credit score on applications, eviction rate, late-payment / NSF rate, and stable-employment percentage? A property-management company in the area should have these aggregated.
- How much new for-sale + rental construction is in the pipeline within 1–3 miles? Heavy new supply typically softens prices + rents 12–24 months out; constrained supply supports both.
Investment metrics
- 1% rule
- 1.47% ✓
- Cap rate
- 11.18%
- Cash-on-cash
- 17.45%
- DSCR
- 1.78
- GRM
- 5.7
CMA / ARV
- ARV (median comp)
- $123,304
- List price
- $65,000
- Delta
- -47.28%
- Verdict
- UNDERPRICED
- Comps
- 20 within 1.0 mi
Show comp detail 10 sales within ~0.75 mi
| Address | Dist | Beds/Ba | Sqft | Sold | Price | $/sf | Match |
|---|---|---|---|---|---|---|---|
| 831 S High St | 0.51mi | 3/1.0 (+1) | 1,056 (0%) | 2mo | $77,500 | $73 | 69 |
| 724 E Patton St | 0.57mi | 2/1.0 | 1,019 (-4%) | 2mo | $130,000 | $128 | 66 |
| 448 Larson St | 0.28mi | 2/2.0 | 1,017 (-4%) | 22mo | $125,000 | $123 | 58 |
| 219 E Patton St | 0.38mi | 3/1.5 (+1) | 1,156 (+10%) | 10mo | $33,000 | $29 | 51 |
| 325 E State St | 0.70mi | 2/1.0 | 1,120 (+6%) | 12mo | $90,000 | $80 | 47 |
| 338 E State St | 0.67mi | 2/1.0 | 1,143 (+8%) | 12mo | $147,000 | $129 | 45 |
| 229 E State St | 0.71mi | 2/1.0 | 960 (-9%) | 14mo | $75,000 | $78 | 40 |
| 7 Allison Dr | 0.55mi | 3/1.0 (+1) | 1,152 (+9%) | 23mo | $184,000 | $160 | 35 |
| 438 S Cherry St | 0.68mi | 3/1.0 (+1) | 1,135 (+8%) | 20mo | $67,288 | $59 | 34 |
| 350 S Elm St | 0.71mi | 3/1.0 (+1) | 1,196 (+13%) | 20mo | $180,000 | $151 | 23 |
Match score weights: distance 35% · size 25% · config 20% · recency 20%. Top-matched comps best support the ARV.
Projected returns pro-forma
-3.0% appreciation · 3.0% rent growth · sell at horizon
- IRR
- 8.9%
- Equity multiple
- 1.35×
- Total profit
- $6,362
- Equity at exit
- $9,692
- IRR
- 18.1%
- Equity multiple
- 2.51×
- Total profit
- $27,404
- Equity at exit
- $5,620
Cash invested: $18,200 (down + closing). Projections, not guarantees.
Landlord ↔ Tenant lean methodology
- Overall (STATE)
- 43 Moderately Tenant-Leaning
- State Illinois
- 43 Moderately Tenant-Leaning · D+7
- County
- — inherits STATE
- City
- — inherits STATE
ZIP-level market 60957
- Home prices YoY
- -31.9%
- Active inventory
- 28
- Price-to-rent
- 5.7×
Monthly cashflow live
- Estimated rent
- $955 medium interval (Pro) →
- Mortgage (P&I)
- −$341
- Tax from tax record
- −$122 /mo · $1,462/yr
- Insurance
- −$27
- HOA
- −$0
- Vacancy / Maint / Mgmt
- −$201
- Net cashflow
- $265
Break-even live
UW: 25.0% down · 7.5% · 30yr · 1.5% tax · 5.0% vac · 8.0% maint · 8.0% mgmt
Financing live
Cash to close
- Down payment
- $16,250
- Closing costs
- $1,950
- Reserves months
- —
- Total cash needed
- —
Loan-product check · same deal, 3 products live
Conventional
25% down · 7.5% · 30yr
- Down + closing
- —
- Monthly P&I
- —
- Monthly cashflow
- —
- DSCR
- —
- Eligible?
- —
Personal DTI + credit; lowest rate.
DSCR
20% down · 8.5% · 30yr
- Down + closing
- —
- Monthly P&I
- —
- Monthly cashflow
- —
- DSCR
- —
- Eligible?
- —
No personal income docs; deal must DSCR.
Hard money
10% down · 12.0% · 12mo
- Down + closing
- —
- Monthly P&I
- —
- Monthly cashflow
- —
- DSCR
- —
- Eligible?
- —
Short-term bridge; refi at stabilization.
Listing history 23 events
-
2026-06-18days on market $65,000 Active 12 DOM
-
2026-06-17days on market $65,000 Active 11 DOM
-
2026-06-16days on market $65,000 Active 10 DOM
-
2026-06-15days on market $65,000 Active 9 DOM
-
2026-06-14days on market $65,000 Active 7 DOM
-
2026-06-13days on market $65,000 Active 6 DOM
-
2026-06-10days on market $65,000 Active 4 DOM
-
2026-06-09days on market $65,000 Active 3 DOM
-
2026-06-08days on market $65,000 Active 2 DOM
-
2026-06-07days on market $65,000 Active 1 DOM
-
2026-06-05days on market $65,000 Active 63 DOM
-
2026-06-02days on market $65,000 Active 61 DOM
-
2026-06-01days on market $65,000 Active 60 DOM
-
2026-05-31days on market $65,000 Active 59 DOM
-
2026-05-30days on market $65,000 Active 58 DOM
-
2026-04-16price $65,000 220-char remark
-
2026-04-02$75,000 Active 220-char remark
-
2007-07-20soldstatus $52,500 326-char remark
Show marketing remark (326 chars)
Home has been remodeled. New carpet thru out. New vinyl in kitchen and bath. New countertop in kitchen. Stove and refrigerator to remain - as is. Walls are freshly cleaned - painted. New central air. Furnace almost new. new fan and tub surround added in bath. Roof under 10 years. Shows well - go show - bring offer.
-
2007-07-19soldstatus $52,500
-
2007-07-11historical 326-char remark
Show marketing remark (326 chars)
Home has been remodeled. New carpet thru out. New vinyl in kitchen and bath. New countertop in kitchen. Stove and refrigerator to remain - as is. Walls are freshly cleaned - painted. New central air. Furnace almost new. new fan and tub surround added in bath. Roof under 10 years. Shows well - go show - bring offer.
-
2007-01-02$55,000 326-char remark
Show marketing remark (326 chars)
Home has been remodeled. New carpet thru out. New vinyl in kitchen and bath. New countertop in kitchen. Stove and refrigerator to remain - as is. Walls are freshly cleaned - painted. New central air. Furnace almost new. new fan and tub surround added in bath. Roof under 10 years. Shows well - go show - bring offer.
-
2006-09-22soldstatus $30,000
-
2006-09-08$39,000
ⓘ Source: listings_history table (triggers on properties + properties_extension) + one-shot
backfill from property_details.listing_events for pre-trigger history.
Tax reassessment forecast IL · Partial reset (capped growth)
- Current annual tax
- $1,462 · $122/mo
- Projected year-2 tax
- $1,469 · $122/mo
- Expected delta
- +$7/yr (+$1/mo · 0.5%)
ⓘ Screening estimate from a state-policy table — verify with the county assessor before closing.
Climate risk First Street
- Flood 1/10 Low FEMA zone X (unshaded) · 0% chance over 30 yrs
- Wildfire 1/10 Low
- Heat 3/10 Moderate 7 d/yr ≥103°F today · 18 d/yr by 30 yrs out
- Wind 2/10 Low 100% chance of damaging wind over 30 yrs
- Air quality 2/10 Low 1 unhealthy d/yr today · 1 by 30 yrs out
Nearby sold comps map
Loading sold comps map…
Walkable amenities ~0.75 mi
Loading nearby amenities…
Taxation est. · year 1
- Rental income
- $11,459
- − Mortgage interest
- −$3,641
- − Property taxes
- −$1,462
- − Insurance
- −$325
- − Repairs & maintenance
- −$917
- − Management
- −$917
- − Depreciation
- −$1,891
- Taxable income
- $2,307
- Est. tax owed @ 24.0%
- −$554
- After-tax cash flow
- $2,622/yr
For passive investors: Depreciation is non-cash, so a rental often shows a tax loss while cash-flowing — sheltering income. Rental losses are passive: they offset passive income freely, and up to $25,000/yr can offset ordinary (W-2) income if you actively participate and your MAGI is under $100k (phasing out to $0 by $150k); unused losses carry forward. On sale, claimed depreciation is recaptured at up to 25%, and gains may owe capital-gains tax (a 1031 exchange can defer both). Figures are a year-1 estimate at your 24.0% rate — not tax advice; consult a CPA.
Schools (NCES district)
- District
- Paxton-Buckley-Loda CUD 10
- NCES district ID
- 1707650
- Math proficiency
- 33% ▼ -5.00%
- Reading proficiency
- 29% ▼ -10.00%
- Median HH income
- $52,233
- Composite
- 27.27/100
- National rank
- #7007
- State rank
- #232 of 620 in IL
Livability — Paxton
- Score
- 72/100
- State rank
- #316
- US rank
- #6283
Category grades
Schools grade is shown separately in the Schools card above.
Census & demographics
- Census place
- Paxton, IL
- Population (ZIP)
- 5,620
Population outlook (Ford County) Hauer SSP2
- Today (2025)
- 13,044 people
- By 2030
- 12,607 · -3.4%
- By 2040
- 11,716 · -10.2%
- By 2050
- 10,836 · -16.9%
- By 2075
- 9,328 · -28.5%
- By 2100
- 7,803 · -40.2%
Race, ethnicity, and origin ACS 2023
- Neighborhood character
- Predominantly White (93%)
- Race & ethnicity
- White 93% Two or more races 5% Hispanic / Latino 2%
- Common ancestry
- Lithuanian 2% Italian 2% Romanian 2%
- Foreign-born
- 0% · Canada
- Languages at home
- 98% English-only · Spanish 1%
Political lean MEDSL · Ford
- 2024 margin
- Solid R (+47.9) · D 25.1% · R 73.0% · Other 1.9%
- 2008→2024 swing
- -18.9pp toward R · 2008: -29.0pp · 2024: -47.9pp
- All cycles
- 2024: R+47.9 2020: R+47.3 2016: R+48.7 2012: R+42.9 2008: R+29.0
Not yet ingested
- Civics
- —
Market trends
- HPI YoY
- ▼ -71.59%
- Current HPI
- 153.0624
- Rent YoY
- —
- Metro
- —
- State GDP YoY
- ▲ 1.59%
- F500 in state
- 60
Industry mix (Fortune 500 HQ in IL)
| Industry | F500 HQs | Revenue |
|---|---|---|
| Insurance | 4 | $201B |
|
||
| Consumer Goods | 4 | $87B |
|
||
| Industrial Machinery | 3 | $64B |
|
||
| Healthcare | 2 | $55B |
|
||
| Retail / Pharmacy | 1 | $148B |
|
||
| Agriculture / Food | 1 | $86B |
|
||
Price history
+34.6% since first listed11 events — show timeline
- 2026-06-18 Listing Removed — MRED as Distributed by MLS Grid
- 2026-06-06 Listing Removed — MRED as Distributed by MLS Grid
- 2026-06-06 Listed — MRED as Distributed by MLS Grid
- 2026-04-16 Price Changed — MRED as Distributed by MLS Grid
- 2026-04-02 Listed — MRED as Distributed by MLS Grid
- 2007-07-20 Sold (MLS) $52,500 MRED as Distributed by MLS Grid
- 2007-07-19 Sold (Public Records) $52,500 Public Records
- 2007-07-11 Listing Removed — MRED as Distributed by MLS Grid
- 2007-01-02 Listed $55,000 MRED as Distributed by MLS Grid
- 2006-09-22 Sold (MLS) $30,000 MRED as Distributed by MLS Grid
- 2006-09-08 Listed $39,000 MRED as Distributed by MLS Grid
Property tax history
+3.8%/yrLatest (2024): $1,462 · +7.8% YoY. Source: county tax records.
Cash-flow waterfall
monthlySold comps — $/sqft
last 12 mo · ≤1 miLoading sold comps…