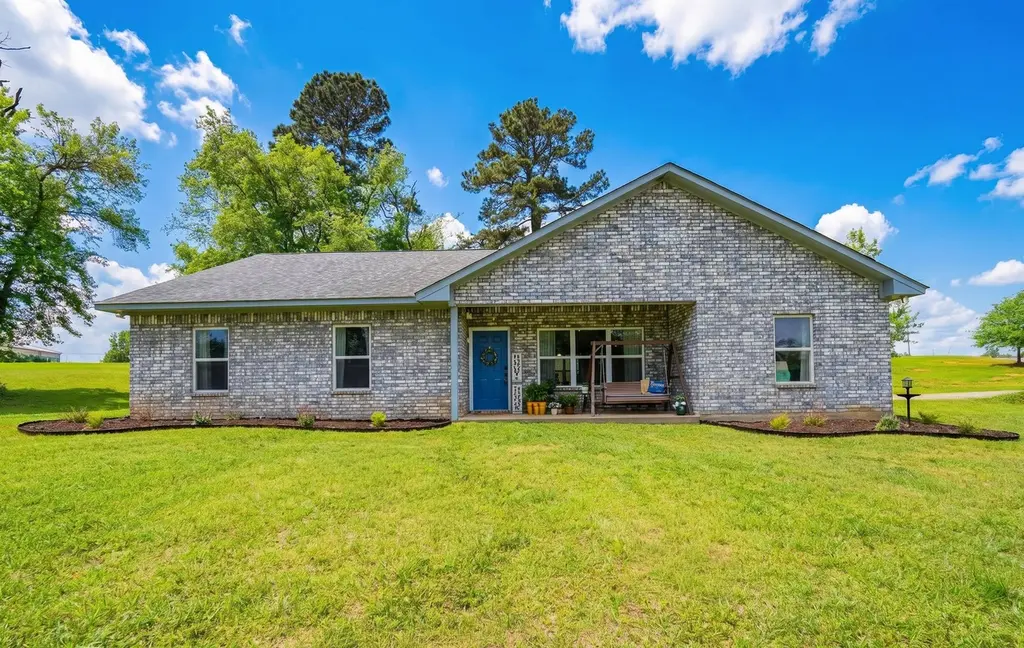
130 Arabian Ct · Longview, TX
Flood risk 1/10 · Minimal
- FEMA flood zone
- X (unshaded)
- Chance of flooding over 30 yrs
- 0.0%
- Est. flood insurance / yr
- $507 – $1,088
Fire risk 6/10 · Moderate
- Est. fire insurance / yr
- $1,222 – $2,270
Heat risk 7/10 · Major
- Hot days now (above 111°F)
- 7 days/yr
- Hot days in 30 yrs
- 26 days/yr
Wind risk 6/10 · Moderate
- Chance of severe wind over 30 yrs
- 69.0%
Air-quality risk 2/10 · Minimal
- Unhealthy air days now
- 1 days/yr
- Unhealthy air days in 30 yrs
- 1 days/yr
Risk factors via First Street. Map © Google.
Why this score? — see what drove the D- grade
The composite is a weighted blend of 9 inputs, each scored 0–100. Each bar is that input's sub-score; the figure is the points it added to the 100-point composite (weight × sub-score).
- ARV discount +13.9/15.0
- Appreciation +10.0/10.0
- Livability +3.7/5.0
- Schools +3.5/10.0
- Rent growth +2.5/5.0
- Condition / age +2.5/5.0
- Cash flow +2.4/30.0
- 1% rule +0.0/10.0
- DSCR +0.0/10.0
$419,900
🖨 Deal sheet 📄 Offer letter ✓ Due diligence
Listing remarks MLS
Nestled in the desirable North Longview area, this beautiful home offers the perfect combination of comfort, space, and convenience. Featuring 5 spacious bedrooms and 3 full bathrooms, the home boasts an open-concept layout that seamlessly connects the living, dining, and kitchen areas, creating a functional and inviting space for everyday living and entertaining. Situated on 5 picturesque acres with gentle rolling hills, this property offers a park-like setting with plenty of room to enjoy the outdoors while maintaining privacy and tranquility in a peaceful neighborhood. Conveniently located just 10 minutes from North Longview’s shopping and dining destinations, including Brookshire's Fresh, Target, Sam's Club, and more, you’ll enjoy the serenity of country-style living without sacrificing easy access to modern amenities. This exceptional property offers a rare opportunity to enjoy space, comfort, and convenience in one of the area's most sought-after locations.
Key facts
- Park-like setting
- Open-concept layout
- 5.02 acre lot
Tags
Neighborhood map
What this means for you Summary
Snapshot
- This is a 5-bed/3.0-bath single-family listed at $420k.
Deal economics
- At list price, monthly cash flow is $-1k ($-18k/yr) — negative.
- To cash-flow at today's rent, offer at most $160k (62.0% below list).
- To meet the 1% rule (rent ≥ 1% of price), the offer needs to be $170k (59.6% below list).
- Recommended offer: $160k (62.0% below list) — sets the bar for cash-flow.
- Cap rate 2.1% vs local median 3.0% in Longview — below-typical yield; the buyer is paying a premium for something (appreciation thesis, condition, location) that the cap rate doesn't capture.
Location & tenants
- Location reads 73/100 on livability (#213 in TX) — a middle-class / working-renter tenant base. Strengths: cost of living A+, housing A+, health & safety A+; Watch: employment C-, crime D+, schools D.
- Gilmer ISD (town): math 44% / reading 38% proficiency, ranked #372 of 826 in TX (top 45%) — families likely to look elsewhere, expect single-tenant / working-renter base with shorter leases.
- Market conditions: 181 active listings in the ZIP; 34 units permitted in Upshur County in 2024 (0 in 5+ unit buildings).
Forward outlook
- In year one you build about $45k of equity ($3k loan paydown + $42k appreciation (10.0% local appreciation)).
- Upshur County population projected at +9% by 2050 — modest demand growth; plan on rents tracking national, not racing it.
- By year 2, paydown + projected appreciation supports a ~$72k cash-out refi (75% LTV) — recoverable capital for the next deal without selling this one.
Negotiation context
- It's been on market 63 days — a 6% lower offer ($395k) is reasonable based on typical stale-listing flexibility.
- 5 sale attempts since 3y ago with the ask held roughly flat each time — persistent listings suggest the price (not the market) is what's stuck; bring a comps-based counter.
Risks & watch-outs
- Climate carrying-cost: major wind risk, 69% chance of damaging wind over 30y; major wildfire risk; extreme-heat days projected 7→26/yr by 2055 (HVAC capex compounding) — expect insurance premiums to compound above CPI over the hold.
Questions for the listing agent
- What do current leases actually rent for vs. the listed asking? Can we see a recent rent roll and the last 12 months of T-12 income?
- It's been on market 63 days. Have you received any prior offers? Is the seller open to a 62% concession, seller financing, or rate buy-down credit?
- What does the HOA fee cover, when was the last increase, and are there any pending special assessments or reserve-fund shortfalls?
- Why hasn't it sold? Are there any deal-killer items the seller is aware of (foundation, flood, title, zoning, code violations)?
- Is there a deadline driving the sale (1031 exchange, divorce, estate, relocation)? That informs how much negotiation room exists.
- Schools are D-rated, which usually means shorter tenancies and higher turnover. Who's the typical renter profile here, and what's been the actual vacancy rate?
- Crime grade is D in this area — have there been break-ins, vandalism, or insurance claims at this property in the last 3 years? What carrier currently insures it and at what premium?
- The area grade is low — what's the realistic commute time and amenity access for the typical tenant pool here? Any planned neighborhood developments (good or bad) we should know about?
- What's the average days-on-market for RENTAL listings here right now (not sales)? A rising rental-DOM trend means longer vacancies and softer asking-rent achievability than the comps imply.
- What's the recent tenant-quality profile in this submarket — average credit score on applications, eviction rate, late-payment / NSF rate, and stable-employment percentage? A property-management company in the area should have these aggregated.
- How much new for-sale + rental construction is in the pipeline within 1–3 miles? Heavy new supply typically softens prices + rents 12–24 months out; constrained supply supports both.
Investment metrics
- 1% rule
- 0.40% ✗
- Cap rate
- 2.08%
- Cash-on-cash
- -15.04%
- DSCR
- 0.33
- GRM
- 20.6
CMA / ARV
- ARV (median comp)
- $489,651
- List price
- $419,900
- Delta
- -14.24%
- Verdict
- UNDERPRICED
- Comps
- 1 within 2.0 mi
Projected returns pro-forma
10.0% appreciation · 3.0% rent growth · sell at horizon
- IRR
- 13.8%
- Equity multiple
- 2.15×
- Total profit
- $134,826
- Equity at exit
- $378,279
- IRR
- 13.9%
- Equity multiple
- 5.00×
- Total profit
- $470,776
- Equity at exit
- $815,773
Cash invested: $117,572 (down + closing). Projections, not guarantees.
Landlord ↔ Tenant lean methodology
- Overall (STATE)
- 87 Strongly Landlord-Friendly
- State Texas
- 87 Strongly Landlord-Friendly · R+5
- County
- — inherits STATE
- City
- — inherits STATE
ZIP-level market 75645
- Home prices YoY
- 12.7%
- Active inventory
- 181
- Price-to-rent
- 20.6×
Monthly cashflow live
- Estimated rent
- $1,698 medium interval (Pro) →
- Mortgage (P&I)
- −$2,202
- Tax from tax record
- −$403 /mo · $4,836/yr
- Insurance
- −$175
- HOA
- −$35
- Vacancy / Maint / Mgmt
- −$357
- Net cashflow
- $-1,473
Break-even live
UW: 25.0% down · 7.5% · 30yr · 1.5% tax · 5.0% vac · 8.0% maint · 8.0% mgmt
Financing live
Cash to close
- Down payment
- $104,975
- Closing costs
- $12,597
- Reserves months
- —
- Total cash needed
- —
Loan-product check · same deal, 3 products live
Conventional
25% down · 7.5% · 30yr
- Down + closing
- —
- Monthly P&I
- —
- Monthly cashflow
- —
- DSCR
- —
- Eligible?
- —
Personal DTI + credit; lowest rate.
DSCR
20% down · 8.5% · 30yr
- Down + closing
- —
- Monthly P&I
- —
- Monthly cashflow
- —
- DSCR
- —
- Eligible?
- —
No personal income docs; deal must DSCR.
Hard money
10% down · 12.0% · 12mo
- Down + closing
- —
- Monthly P&I
- —
- Monthly cashflow
- —
- DSCR
- —
- Eligible?
- —
Short-term bridge; refi at stabilization.
HOA detail
- Monthly dues
- $35 · $420/yr
Listing history 44 events
-
2026-06-19days on market $419,900 Active 63 DOM
-
2026-06-18days on market $419,900 Active 62 DOM
-
2026-06-17days on market $419,900 Active 61 DOM
-
2026-06-16days on market $419,900 Active 60 DOM
-
2026-06-15days on market $419,900 Active 59 DOM
-
2026-06-14days on market $419,900 Active 57 DOM
-
2026-06-13days on market $419,900 Active 56 DOM
-
2026-06-10days on market $419,900 Active 54 DOM
-
2026-06-09days on market $419,900 Active 53 DOM
-
2026-06-08days on market $419,900 Active 52 DOM
-
2026-06-07days on market $419,900 Active 51 DOM
-
2026-06-05days on market $419,900 Active 48 DOM
-
2026-06-03days on market $419,900 Active 47 DOM
-
2026-06-02pricedays on market $419,900 Active 46 DOM
-
2026-06-01days on market $429,900 Active 45 DOM
-
2026-05-31days on market $429,900 Active 44 DOM
-
2026-05-30days on market $429,900 Active 43 DOM
-
2026-05-11price $429,900 989-char remark
Show marketing remark (989 chars)
Nestled in the desirable North Longview area, this beautiful home offers the perfect combination of comfort, space, and convenience. Featuring 5 spacious bedrooms and 3 full bathrooms, the home boasts an open-concept layout that seamlessly connects the living, dining, and kitchen areas, creating a functional and inviting space for everyday living and entertaining. Situated on 5 picturesque acres with gentle rolling hills, this property offers a park-like setting with plenty of room to enjoy the outdoors while maintaining privacy and tranquility in a peaceful neighborhood. Conveniently located just 10 minutes from North Longview’s shopping and dining destinations, including Brookshire's Fresh, Target, Sam's Club, and more, you’ll enjoy the serenity of country-style living without sacrificing easy access to modern amenities. This exceptional property offers a rare opportunity to enjoy space, comfort, and convenience in one of the area's most sought-after locations.
-
2026-04-17$439,900 Active 989-char remark
Show marketing remark (989 chars)
Nestled in the desirable North Longview area, this beautiful home offers the perfect combination of comfort, space, and convenience. Featuring 5 spacious bedrooms and 3 full bathrooms, the home boasts an open-concept layout that seamlessly connects the living, dining, and kitchen areas, creating a functional and inviting space for everyday living and entertaining. Situated on 5 picturesque acres with gentle rolling hills, this property offers a park-like setting with plenty of room to enjoy the outdoors while maintaining privacy and tranquility in a peaceful neighborhood. Conveniently located just 10 minutes from North Longview’s shopping and dining destinations, including Brookshire's Fresh, Target, Sam's Club, and more, you’ll enjoy the serenity of country-style living without sacrificing easy access to modern amenities. This exceptional property offers a rare opportunity to enjoy space, comfort, and convenience in one of the area's most sought-after locations.
-
2026-02-12price $399,900
-
2026-01-19price $404,900
-
2025-12-29price $409,900
-
2025-12-09price $414,900
-
2025-09-11price $419,900
-
2025-08-04price $424,900
-
2025-06-25price $429,900
-
2025-06-05price $434,900
-
2025-05-22price $439,900
-
2025-05-15price $448,900
-
2025-05-08price $455,900
-
2025-05-01price $462,900
-
2025-04-22price $469,900
-
2025-04-11price $485,000
-
2025-03-21$500,000 Active
-
2023-06-01soldstatus Closed
-
2023-06-01soldstatus
-
2023-05-18status Pending
-
2023-05-03$309,900
-
2023-04-28status Active
-
2023-04-28status Pending
-
2023-04-17price $309,900
-
2023-04-11price $319,900
-
2023-03-28price $345,000
-
2023-02-14$362,500 Active
ⓘ Source: listings_history table (triggers on properties + properties_extension) + one-shot
backfill from property_details.listing_events for pre-trigger history.
Tax reassessment forecast TX · Resets to sale price
- Current annual tax
- $4,836 · $403/mo
- Projected year-2 tax
- $7,684 · $640/mo
- Expected delta
- +$2,848/yr (+$237/mo · 58.9%)
ⓘ Screening estimate from a state-policy table — verify with the county assessor before closing.
Climate risk First Street
- Flood 1/10 Low FEMA zone X (unshaded) · 0% chance over 30 yrs
- Wildfire 6/10 Major
- Heat 7/10 Severe 7 d/yr ≥111°F today · 26 d/yr by 30 yrs out
- Wind 6/10 Major 69% chance of damaging wind over 30 yrs
- Air quality 2/10 Low 1 unhealthy d/yr today · 1 by 30 yrs out
Nearby sold comps map
Loading sold comps map…
Walkable amenities ~0.75 mi
Loading nearby amenities…
Taxation est. · year 1
- Rental income
- $20,380
- − Mortgage interest
- −$23,521
- − Property taxes
- −$4,836
- − Insurance
- −$2,100
- − Repairs & maintenance
- −$1,630
- − Management
- −$1,630
- − HOA
- −$420
- − Depreciation
- −$12,215
- Taxable loss
- −$25,973
- Est. tax savings @ 24.0%
- +$6,233
- After-tax cash flow
- $-11,446/yr
For passive investors: Depreciation is non-cash, so a rental often shows a tax loss while cash-flowing — sheltering income. Rental losses are passive: they offset passive income freely, and up to $25,000/yr can offset ordinary (W-2) income if you actively participate and your MAGI is under $100k (phasing out to $0 by $150k); unused losses carry forward. On sale, claimed depreciation is recaptured at up to 25%, and gains may owe capital-gains tax (a 1031 exchange can defer both). Figures are a year-1 estimate at your 24.0% rate — not tax advice; consult a CPA.
Schools (NCES district)
- District
- Gilmer ISD
- NCES district ID
- 4820700
- Math proficiency
- 44% ▼ -8.00%
- Reading proficiency
- 38% ▼ -3.00%
- Median HH income
- $46,724
- Composite
- 35.04/100
- National rank
- #5038
- State rank
- #372 of 826 in TX
Livability — Longview
- Score
- 73/100
- State rank
- #213
- US rank
- #5287
Category grades
Schools grade is shown separately in the Schools card above.
Census & demographics
- City population
- 103,792
- Population (ZIP)
- 10,511
Population outlook (Upshur County) Hauer SSP2
- Today (2025)
- 42,771 people
- By 2030
- 43,788 · +2.4%
- By 2040
- 45,574 · +6.6%
- By 2050
- 46,683 · +9.1%
- By 2075
- 49,137 · +14.9%
- By 2100
- 47,457 · +11.0%
Race, ethnicity, and origin ACS 2023
- Neighborhood character
- Predominantly White (81%)
- Race & ethnicity
- White 81% Hispanic / Latino 10% Two or more races 6% Black 4%
- Hispanic origin (detail)
- Mexican 9%
- Common ancestry
- Slovak 3% Serbian 2% Lithuanian 1%
- Foreign-born
- 3% · Canada
- Languages at home
- 97% English-only · Spanish 2% Tagalog/Filipino 0%
Political lean MEDSL · Upshur
- 2024 margin
- Solid R (+71.0) · D 14.2% · R 85.2%
- 2008→2024 swing
- -22.0pp toward R · 2008: -49.0pp · 2024: -71.0pp
- All cycles
- 2024: R+71.0 2020: R+68.5 2016: R+68.0 2012: R+59.8 2008: R+49.0
Not yet ingested
- Civics
- —
Market trends
- HPI YoY
- ▲ 35.93%
- Current HPI
- 319.83
- Rent YoY
- —
- Metro
- —
- State GDP YoY
- ▲ 3.95%
- F500 in state
- 110
Industry mix (Fortune 500 HQ in TX)
| Industry | F500 HQs | Revenue |
|---|---|---|
| Energy | 16 | $1,198B |
|
||
| Technology | 5 | $198B |
|
||
| Engineering / Construction | 4 | $72B |
|
||
| Energy Services | 3 | $60B |
|
||
| Utilities | 3 | $41B |
|
||
| Healthcare | 2 | $330B |
|
||
Price history
+18.6% since first listed27 events — show timeline
- 2026-05-11 Price Changed $429,900 LAAR
- 2026-04-17 Listed $439,900 LAAR
- 2026-02-12 Price Changed $399,900 LAAR
- 2026-01-19 Price Changed $404,900 LAAR
- 2025-12-29 Price Changed $409,900 LAAR
- 2025-12-09 Price Changed $414,900 LAAR
- 2025-09-11 Price Changed $419,900 LAAR
- 2025-08-04 Price Changed $424,900 LAAR
- 2025-06-25 Price Changed $429,900 LAAR
- 2025-06-05 Price Changed $434,900 LAAR
- 2025-05-22 Price Changed $439,900 LAAR
- 2025-05-15 Price Changed $448,900 LAAR
- 2025-05-08 Price Changed $455,900 LAAR
- 2025-05-01 Price Changed $462,900 LAAR
- 2025-04-22 Price Changed $469,900 LAAR
- 2025-04-11 Price Changed $485,000 LAAR
- 2025-03-21 Listed $500,000 LAAR
- 2023-06-01 Sold (MLS) — GTAR
- 2023-06-01 Sold (MLS) — LAAR
- 2023-05-18 Pending — LAAR
- 2023-05-03 Listed $309,900 GTAR
- 2023-04-28 Relisted — LAAR
- 2023-04-28 Pending — LAAR
- 2023-04-17 Price Changed $309,900 LAAR
- 2023-04-11 Price Changed $319,900 LAAR
- 2023-03-28 Price Changed $345,000 LAAR
- 2023-02-14 Listed $362,500 LAAR
Property tax history
-20.7%/yrLatest (2025): $4,836 · -20.7% YoY. Source: county tax records.
Cash-flow waterfall
monthlySold comps — $/sqft
last 12 mo · ≤1 miLoading sold comps…