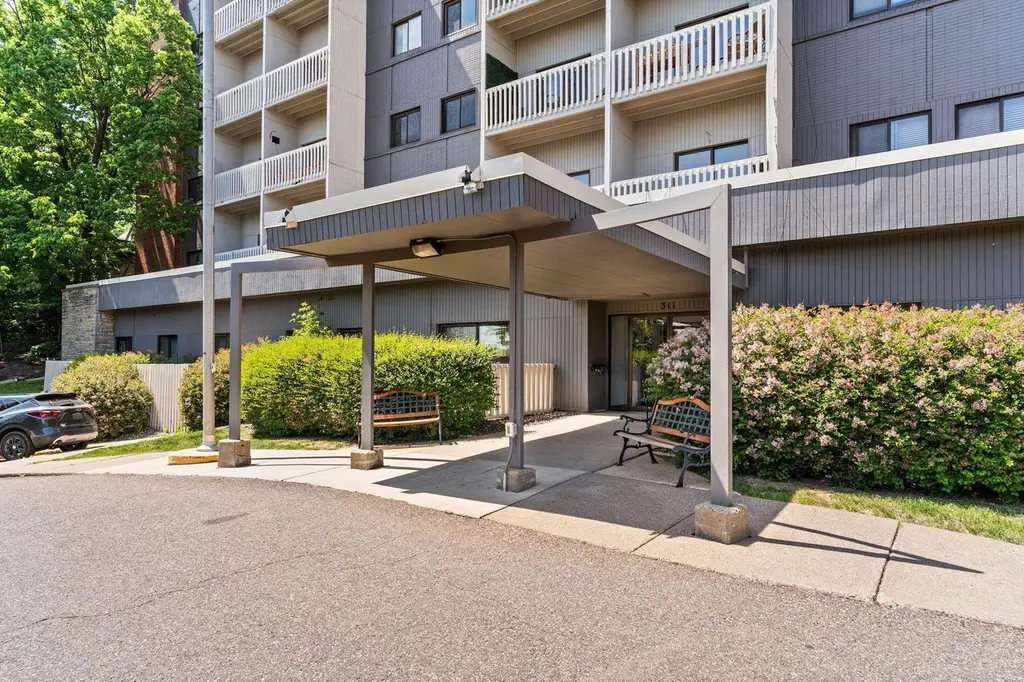
311 Pleasant Ave #409 · St. Paul, MN
Flood risk 1/10 · Minimal
- FEMA flood zone
- X (unshaded)
- Chance of flooding over 30 yrs
- 0.0%
- Est. flood insurance / yr
- $473 – $860
Fire risk 1/10 · Minimal
- Est. fire insurance / yr
- $888 – $1,650
Heat risk 2/10 · Minimal
- Hot days now (above 99°F)
- 7 days/yr
- Hot days in 30 yrs
- 14 days/yr
Wind risk 2/10 · Minimal
- Chance of severe wind over 30 yrs
- —
Air-quality risk 2/10 · Minimal
- Unhealthy air days now
- 1 days/yr
- Unhealthy air days in 30 yrs
- 1 days/yr
Risk factors via First Street. Map © Google.
Why this score? — see what drove the C+ grade
The composite is a weighted blend of 9 inputs, each scored 0–100. Each bar is that input's sub-score; the figure is the points it added to the 100-point composite (weight × sub-score).
- Cash flow +27.1/30.0
- 1% rule +10.0/10.0
- DSCR +9.4/10.0
- ARV discount +7.5/15.0
- Rent growth +2.9/5.0
- Livability +2.5/5.0
- Condition / age +2.5/5.0
- Schools +2.4/10.0
- Appreciation +0.0/10.0
$150,000
🖨 Deal sheet 📄 Offer letter ✓ Due diligence
Listing remarks MLS
Refreshed & refurbished, this unit shines! Brand new windows, updated bath & SS appliances in kitchen. Every room painted, every surface shined top to bottom. Convenient to everything St. Paul offers. Enjoy carefree condo living at it's finest!
Key facts
- Storage room
- Attached parking
- Community room
Tags
Property features AI
Finance
- Other: Shared building rooms: amusement/party room, community room, exercise room; Directions note: Summit to Ramsey to Pleasant (GPS recommended due to unique location)
- Financial info: Property mortgaged free and clear
- HOA & community: Association: Gassen Company; Monthly association fee; Association amenities include laundry, concrete floors & walls, elevator(s), and lobby entrance; Association fee covers air conditioning, electricity, gas, hazard insurance, heating, lawn care, maintenance grounds, parking, professional management, sewer, shared amenities, snow removal, and water
Exterior
- Parking: Assigned parking; Attached tuck-under garage with garage door opener; Secured parking garage; 11 garage stalls (building); 1 garage space for this unit
- Security: Security system
- Utilities: City water connected; City sewer connected; Electric and natural gas available
- Home design: Attached residential property; One level; Accessible design features (no internal stairs, elevator); Above-grade finished area listed
- Construction: Concrete construction; Roof age 8 years or less; Foundation present
- Exterior features: Covered patio/porch; Stone exterior; Public transit within six blocks; Irregular lot with medium tree coverage; Balcony/Deck
Interior
- Kitchen: Dishwasher; Range; Refrigerator
- Bedrooms: 2 bedrooms (both on the main level)
- Bathrooms: 1 full bathroom (main floor full bath; primary walk-thru)
- Heating & cooling: Heat pump; Central air
- Interior features: Separate/formal dining room; Covered balcony/deck; Primary bedroom walk-through closet; Main floor primary bedroom; Security system; Walk-in closet; Basement: other; Doors 36"+ and hallways 42"+ with no internal stairs; accessible elevator installed
- Laundry & utility: Laundry located in a common area
Neighborhood map
What this means for you Summary
Snapshot
- This is a 2-bed/1.0-bath condo listed at $150k.
Deal economics
- At list price, monthly cash flow is $426 ($5k/yr) — positive.
- The deal already cash-flows at list — no discount required.
- Meets the 1% rule at list price ($3k rent vs $150k).
- Recommended offer: $148k (1.5% below list) — sets the bar for market timing.
Location & tenants
- Location reads: area grade C — affects rentability + tenant quality, not the cash-flow math above.
- St. Paul Public School District (urban): math 21% / reading 33% proficiency, ranked #270 of 301 in MN (top 90%) — low school quality limits family demand, transient renter base, plan for 1-2y turnover; 64% free/reduced lunch — lower-income household profile, screen leases tightly.
- Market conditions: Rents rising (+1.6%/yr); 145 active listings in the ZIP; 13 comparable units currently listed for rent nearby; rentals leasing fast (median 3d on market — plan ~1-2 weeks tenant-placement turnaround); solid renter incomes; 1,202 units permitted in Ramsey County in 2024 (880 in 5+ unit buildings).
- This rent runs 43% of the median local income ($76k/yr) — at the standard rent-burdened threshold; future hikes will face affordability resistance.
Forward outlook
- Local home prices are declining (-3.0%/yr); year-one equity from $1k of loan paydown is wiped out by about $4k of value loss. Plan a longer hold.
- Ramsey County population projected at +27% by 2050 — long-run rental-demand tailwind backs the buy-and-hold thesis.
Negotiation context
- It's been on market 17 days — a 2% lower offer ($148k) is reasonable based on typical stale-listing flexibility.
- 5 sale attempts since 30y ago with the ask held roughly flat each time — persistent listings suggest the price (not the market) is what's stuck; bring a comps-based counter.
- Current owner paid $85k; list at $150k implies a 76% gain — meaningful room to come down on a strong offer.
Risks & watch-outs
- Watch-outs: HOA is 28% of rent; built in 1927 — expect roof / HVAC / electrical / plumbing capex.
Questions for the listing agent
- Built in 1927 — when were the roof, HVAC, electrical panel, plumbing, and water heater last replaced?
- What does the HOA fee cover, when was the last increase, and are there any pending special assessments or reserve-fund shortfalls?
- Any open or pending special assessments — roof, HVAC, plumbing, elevator, façade? What's the per-unit balance and payoff schedule, and is the seller paying it off at close or rolling it to the buyer?
- Is there a deadline driving the sale (1031 exchange, divorce, estate, relocation)? That informs how much negotiation room exists.
- What's the average days-on-market for RENTAL listings here right now (not sales)? A rising rental-DOM trend means longer vacancies and softer asking-rent achievability than the comps imply.
- What's the recent tenant-quality profile in this submarket — average credit score on applications, eviction rate, late-payment / NSF rate, and stable-employment percentage? A property-management company in the area should have these aggregated.
- How much new apartment / multifamily construction is in the pipeline within 1–3 miles? Heavy new supply (>2% of stock underway) typically softens rents 12–24 months out; light construction supports rent growth.
Investment metrics
- 1% rule
- 1.82% ✓
- Cap rate
- 9.70%
- Cash-on-cash
- 12.17%
- DSCR
- 1.54
- GRM
- 4.6
CMA / ARV
No comps found within radius.
Projected returns pro-forma
-3.0% appreciation · 1.6% rent growth · sell at horizon
- IRR
- -0.3%
- Equity multiple
- 0.99×
- Total profit
- $-504
- Equity at exit
- $22,365
- IRR
- 7.3%
- Equity multiple
- 1.51×
- Total profit
- $21,257
- Equity at exit
- $12,969
Cash invested: $42,000 (down + closing). Projections, not guarantees.
Landlord ↔ Tenant lean methodology
- Overall (STATE)
- 46 Balanced
- State Minnesota
- 46 Balanced · D+2
- County
- — inherits STATE
- City
- — inherits STATE
ZIP-level market 55102
- Rents YoY
- 1.6%
- Active inventory
- 145
- Price-to-rent
- 4.6×
Monthly cashflow live
- Estimated rent
- $2,732 high interval (Pro) →
- Mortgage (P&I)
- −$787
- Tax from tax record
- −$114 /mo · $1,366/yr
- Insurance
- −$62
- HOA
- −$769
- Vacancy / Maint / Mgmt
- −$574
- Net cashflow
- $426
Break-even live
UW: 25.0% down · 7.5% · 30yr · 1.5% tax · 5.0% vac · 8.0% maint · 8.0% mgmt
Financing live
Cash to close
- Down payment
- $37,500
- Closing costs
- $4,500
- Reserves months
- —
- Total cash needed
- —
Loan-product check · same deal, 3 products live
Conventional
25% down · 7.5% · 30yr
- Down + closing
- —
- Monthly P&I
- —
- Monthly cashflow
- —
- DSCR
- —
- Eligible?
- —
Personal DTI + credit; lowest rate.
DSCR
20% down · 8.5% · 30yr
- Down + closing
- —
- Monthly P&I
- —
- Monthly cashflow
- —
- DSCR
- —
- Eligible?
- —
No personal income docs; deal must DSCR.
Hard money
10% down · 12.0% · 12mo
- Down + closing
- —
- Monthly P&I
- —
- Monthly cashflow
- —
- DSCR
- —
- Eligible?
- —
Short-term bridge; refi at stabilization.
Rent comps 13 comps
| Address | Beds | Baths | Sqft | Rent | $/sqft | DOM | Units | Dist |
|---|---|---|---|---|---|---|---|---|
| 253 Kellogg Blvd W Saint Paul, MN | 2.0 | 1.0–2.0 | 1208 | $3,198 | $2.65 | 3d | 12 | 0.40mi |
| 255 Western Ave N Saint Paul, MN | 3.0 | 1.0–2.0 | 1049 | $2,940 | $2.80 | 2d | 23 | 0.53mi |
| 400 Spring St Saint Paul, MN | 1.0–2.0 | 1.0–2.0 | 1205 | $3,275 | $2.72 | 3d | 31 | 0.53mi |
| 101 10th St E Saint Paul, MN | 3.0 | 1.0–2.0 | 887 | $2,051 | $2.31 | 2d | 25 | 0.91mi |
| 695 Grand Ave Saint Paul, MN | 1.0–2.0 | 1.0–2.0 | 1130 | $5,795 | $5.13 | 18d | 10 | 0.98mi |
| 111 Kellogg Blvd E Saint Paul, MN | 3.0 | 1.0–2.0 | 1000 | $2,266 | $2.27 | 2d | 20 | 1.00mi |
| 141 4th St E Saint Paul, MN | 2.0 | 1.0–2.0 | 811 | $2,420 | $2.98 | 20d | 20 | 1.05mi |
| 333 Sibley St Saint Paul, MN | 3.0 | 1.0–2.0 | 1358 | $2,577 | $1.90 | 10d | 10 | 1.13mi |
| 180 E Kellogg Blvd St Paul, MN | 3.0 | 1.0–2.5 | 1436 | $3,467 | $2.41 | 2d | 22 | 1.15mi |
| 380 Randolph Ave Saint Paul, MN | 2.0 | 1.0–2.0 | 753 | $2,946 | $3.91 | 2d | 18 | 1.15mi |
| 240 5th St E St Paul, MN | 2.0 | 1.0–2.0 | 949 | $2,770 | $2.92 | 2d | 10 | 1.19mi |
| 250 6th St E St Paul, MN | 2.0 | 1.0–2.0 | 980 | $2,868 | $2.93 | 2d | 16 | 1.21mi |
| 330 9th St E St Paul, MN | 1.0–2.0 | 1.0 | 978 | $2,495 | $2.55 | 3d | 3 | 1.32mi |
HOA detail condo
- Monthly dues
- $769 · $9,228/yr
- Assessments
- None detected in remarks — confirm with the listing agent.
Listing history 12 events
-
2026-06-18days on market $150,000 Active 17 DOM
-
2026-06-17days on market $150,000 Active 16 DOM
-
2026-06-16days on market $150,000 Active 15 DOM
-
2026-06-15days on market $150,000 Active 14 DOM
-
2026-06-13days on market $150,000 Active 12 DOM
-
2026-06-09days on market $150,000 Active 8 DOM
-
2026-06-08days on market $150,000 Active 7 DOM
-
2026-06-07days on market $150,000 Active 6 DOM
-
2026-06-04days on market $150,000 Active 3 DOM
-
2026-06-03days on market $150,000 Active 2 DOM
-
2026-06-02remarks 699-char remark
-
2026-06-02$150,000 Active 1 DOM
ⓘ Source: listings_history table (triggers on properties + properties_extension) + one-shot
backfill from property_details.listing_events for pre-trigger history.
Tax reassessment forecast MN · Partial reset (capped growth)
- Current annual tax
- $1,366 · $114/mo
- Projected year-2 tax
- $1,523 · $127/mo
- Expected delta
- +$157/yr (+$13/mo · 11.5%)
ⓘ Screening estimate from a state-policy table — verify with the county assessor before closing.
Climate risk First Street
- Flood 1/10 Low FEMA zone X (unshaded) · 0% chance over 30 yrs
- Wildfire 1/10 Low
- Heat 2/10 Low 7 d/yr ≥99°F today · 14 d/yr by 30 yrs out
- Wind 2/10 Low
- Air quality 2/10 Low 1 unhealthy d/yr today · 1 by 30 yrs out
Nearby sold comps map
Loading sold comps map…
Walkable amenities ~0.75 mi
Loading nearby amenities…
Taxation est. · year 1
- Rental income
- $32,778
- − Mortgage interest
- −$8,402
- − Property taxes
- −$1,366
- − Insurance
- −$750
- − Repairs & maintenance
- −$2,622
- − Management
- −$2,622
- − HOA
- −$9,228
- − Depreciation
- −$4,364
- Taxable income
- $3,424
- Est. tax owed @ 24.0%
- −$822
- After-tax cash flow
- $4,290/yr
For passive investors: Depreciation is non-cash, so a rental often shows a tax loss while cash-flowing — sheltering income. Rental losses are passive: they offset passive income freely, and up to $25,000/yr can offset ordinary (W-2) income if you actively participate and your MAGI is under $100k (phasing out to $0 by $150k); unused losses carry forward. On sale, claimed depreciation is recaptured at up to 25%, and gains may owe capital-gains tax (a 1031 exchange can defer both). Figures are a year-1 estimate at your 24.0% rate — not tax advice; consult a CPA.
Schools (NCES district)
- District
- St. Paul Public School District
- NCES district ID
- 2733840
- Math proficiency
- 21% ▼ -11.00%
- Reading proficiency
- 33% ▼ -7.00%
- Median HH income
- $48,316
- Composite
- 23.51/100
- National rank
- #7868
- State rank
- #270 of 301 in MN
Livability — St. Paul
No livability data for this city. (Only ~50 U.S. cities are tracked.)
Census & demographics
- Census place
- St. Paul, MN
- County
- Ramsey County · 542,837 people
- City population
- 280,599
- Metro
- Minneapolis-St. Paul-Bloomington, MN-WI
- Population (ZIP)
- 19,630
- Household income
- $76,406
- Rent vs Own
- Severe rent burden
- 1116.0
Population outlook (Ramsey County) Hauer SSP2
- Today (2025)
- 603,431 people
- By 2030
- 636,459 · +5.5%
- By 2040
- 700,596 · +16.1%
- By 2050
- 765,819 · +26.9%
- By 2075
- 929,297 · +54.0%
- By 2100
- 1,053,924 · +74.7%
Race, ethnicity, and origin ACS 2023
- Neighborhood character
- Predominantly White (77%)
- Race & ethnicity
- White 77% Black 10% Two or more races 6% Hispanic / Latino 5% Asian 3%
- Hispanic origin (detail)
- Mexican 4%
- Common ancestry
- Portuguese 10% Lithuanian 5% Romanian 3%
- Foreign-born
- 9% · Canada, South Korea
- Languages at home
- 87% English-only · Spanish 4% Other Indo-European 1% German/W. Germanic 1%
Political lean MEDSL · Ramsey
- 2024 margin
- Solid D (+43.3) · D 70.5% · R 27.2% · Other 2.3%
- 2008→2024 swing
- +9.4pp toward D · 2008: 33.9pp · 2024: 43.3pp
- All cycles
- 2024: D+43.3 2020: D+45.4 2016: D+39.4 2012: D+35.3 2008: D+33.9
Not yet ingested
- Civics
- —
Market trends
- HPI YoY
- ▼ -217.83%
- Current HPI
- 241.7112
- Rent YoY
- ▲ 1.60%
- Metro
- Minneapolis-St. Paul-Bloomington, MN-WI
- State GDP YoY
- ▲ 2.41%
- F500 in state
- 34
Industry mix (Fortune 500 HQ in MN)
| Industry | F500 HQs | Revenue |
|---|---|---|
| Healthcare | 2 | $407B |
|
||
| Retail | 2 | $150B |
|
||
| Consumer Goods | 2 | $32B |
|
||
| Industrial Machinery | 2 | $6B |
|
||
| Agriculture | 1 | $40B |
|
||
| Healthcare / Medical Devices | 1 | $32B |
|
||
Price history
+183.6% since first listed13 events — show timeline
- 2026-06-01 Listed $150,000 NORTHSTARMLS as Distributed by MLS Grid
- 2015-03-25 Sold (MLS) $85,000 RASM
- 2015-03-25 Sold (MLS) $85,000 LSAR
- 2015-03-25 Sold (MLS) $85,000 NORTHSTARMLS as Distributed by MLS Grid
- 2015-03-02 Pending — NORTHSTARMLS as Distributed by MLS Grid
- 2015-02-12 Contingent — NORTHSTARMLS as Distributed by MLS Grid
- 2015-02-05 Listed $84,500 NORTHSTARMLS as Distributed by MLS Grid
- 2015-02-05 Listed $84,500 RASM
- 2015-02-05 Listed $84,500 LSAR
- 1996-10-21 Sold (Public Records) $52,000 Public Records
- 1996-07-29 Sold (MLS) $33,500 NORTHSTARMLS as Distributed by MLS Grid
- 1996-06-16 Listing Removed — NORTHSTARMLS as Distributed by MLS Grid
- 1996-04-17 Listed $52,900 NORTHSTARMLS as Distributed by MLS Grid
Property tax history
-0.7%/yrLatest (2025): $1,366 · +2.1% YoY. Source: county tax records.
Cash-flow waterfall
monthlySold comps — $/sqft
last 12 mo · ≤1 miLoading sold comps…