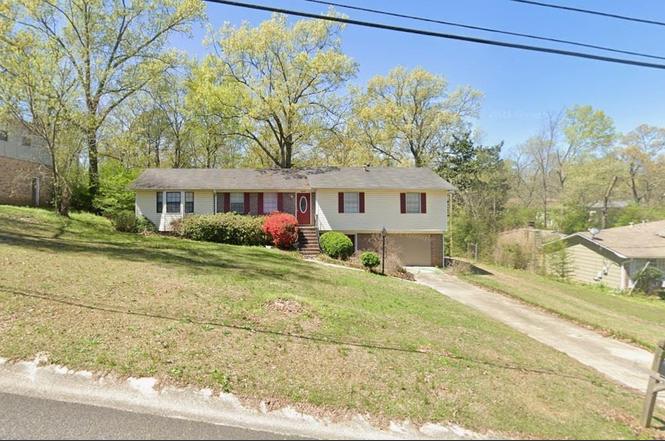
2620 6th St NE · Center Point, AL
Flood risk 1/10 · Minimal
- FEMA flood zone
- X (unshaded)
- Chance of flooding over 30 yrs
- 0.0%
- Est. flood insurance / yr
- $473 – $860
Fire risk 3/10 · Minor
- Est. fire insurance / yr
- $916 – $1,700
Heat risk 6/10 · Moderate
- Hot days now (above 105°F)
- 7 days/yr
- Hot days in 30 yrs
- 19 days/yr
Wind risk 6/10 · Moderate
- Chance of severe wind over 30 yrs
- 27.0%
Air-quality risk 5/10 · Moderate
- Unhealthy air days now
- 6 days/yr
- Unhealthy air days in 30 yrs
- 11 days/yr
Risk factors via First Street. Map © Google.
Why this score? — see what drove the B- grade
The composite is a weighted blend of 9 inputs, each scored 0–100. Each bar is that input's sub-score; the figure is the points it added to the 100-point composite (weight × sub-score).
- Cash flow +25.4/30.0
- ARV discount +15.0/15.0
- DSCR +8.4/10.0
- 1% rule +6.5/10.0
- Rent growth +3.3/5.0
- Livability +3.2/5.0
- Condition / age +2.5/5.0
- Schools +1.8/10.0
- Appreciation +0.0/10.0
$139,500
🖨 Deal sheet 📄 Offer letter ✓ Due diligence
Listing remarks MLS
Fully rehabbed Investment Property! Ready to cash flow for a new owner!
Key facts
- 0.44 acre lot
- 2 garage spots
- Built 1971
Property features AI
Finance
- Other: Property in CENTER CREST subdivision; Lot size approximately 0.44 acres
- Financial info: Has down payment assistance
- HOA & community: No association fee
Exterior
- Parking: Front garage entry; Basement parking; 2 total garage spaces (2 in basement)
- Utilities: Public water; Septic sewer; Electric water heater; Underground utilities; Internet service available
- Home design: Existing construction; Siding (other)
- Construction: Basement foundation; Concrete block basement
- Exterior features: Covered deck; No pool; No patio; No garden/patio; Not waterfront
Interior
- Kitchen: Laminate countertops; Electric oven
- Bedrooms: Multiple bedrooms on main level, including a master bedroom
- Flooring: Carpet
- Bathrooms: Three full bathrooms; Bathtub/shower combos
- Heating & cooling: Central heating; Central cooling
- Interior features: Carpet floors; Ceilings: Other (see remarks); Full unfinished basement (concrete block)
- Laundry & utility: Washer hookup; Electric dryer hookup; Laundry located in basement
Neighborhood map
What this means for you Summary
Snapshot
- This is a 4-bed/3.0-bath single-family listed at $140k.
Deal economics
- At list price, monthly cash flow is $321 ($4k/yr) — positive.
- The deal already cash-flows at list — no discount required.
- Meets the 1% rule at list price ($2k rent vs $140k).
- Recommended offer: $135k (3.0% below list) — sets the bar for market timing.
- Cap rate 9.1% vs local median 7.3% in Center Point — meaningfully above typical; check what's discounted (condition, days-on-market, listing class) to confirm the premium yield is real.
Location & tenants
- Location reads 63/100 on livability (#193 in AL) — a middle-class / working-renter tenant base. Strengths: cost of living A+, commute A, housing A; Watch: crime D, amenities F, employment F.
- Jefferson County (suburban): math 9% / reading 32% proficiency, ranked #104 of 129 in AL (top 81%) — low school quality limits family demand, transient renter base, plan for 1-2y turnover.
- Zoned schools: Center Point Elementary School (618 students, 82% FRL); Center Point High School (math 2% / reading 2%, grade F, #291 of 305 statewide, top 100%, 774 students, 91% FRL) — zoned schools average 86% FRL vs 49% district-wide (38 pts higher); higher-poverty schools than district average — tighter screening recommended.
- Zoned-school proficiency averages 2% at this address vs 20% district-wide (-18 pts) — the specific schools serving this property underperform the Jefferson County average; the district grade overstates school quality for this exact location.
- Market conditions: Rents rising (+3.0%/yr); 334 active listings in the ZIP; 10 comparable units currently listed for rent nearby; rentals lingering (median 44d on market — plan ~5-8 weeks vacancy on turnover, expect pricing pressure); 50% of comp listings sitting > 30 days — soft ceiling on asking rent; 2,114 units permitted in Jefferson County in 2024 (556 in 5+ unit buildings).
- This rent runs 36% of the median local income ($53k/yr) — at the standard rent-burdened threshold; future hikes will face affordability resistance.
Forward outlook
- Local home prices are declining (-3.0%/yr); year-one equity from $964 of loan paydown is wiped out by about $4k of value loss. Plan a longer hold.
- Jefferson County population projected to shrink 4% by 2050 — rents likely to lag national; underwrite the cash flow, not the appreciation.
Negotiation context
- It's been on market 41 days — a 3% lower offer ($135k) is reasonable based on typical stale-listing flexibility.
- 3 sale attempts since 6y ago with the ask held roughly flat each time — persistent listings suggest the price (not the market) is what's stuck; bring a comps-based counter.
Risks & watch-outs
- Climate carrying-cost: major wind risk, 27% chance of damaging wind over 30y; extreme-heat days projected 7→19/yr by 2055 (HVAC capex compounding) — expect insurance premiums to compound above CPI over the hold.
Questions for the listing agent
- It's been on market 41 days. Have you received any prior offers? Is the seller open to a 3% concession, seller financing, or rate buy-down credit?
- Built in 1971 — when were the roof, HVAC, electrical panel, plumbing, and water heater last replaced?
- Is there a deadline driving the sale (1031 exchange, divorce, estate, relocation)? That informs how much negotiation room exists.
- Schools are F-rated, which usually means shorter tenancies and higher turnover. Who's the typical renter profile here, and what's been the actual vacancy rate?
- Crime grade is D in this area — have there been break-ins, vandalism, or insurance claims at this property in the last 3 years? What carrier currently insures it and at what premium?
- What's the average days-on-market for RENTAL listings here right now (not sales)? A rising rental-DOM trend means longer vacancies and softer asking-rent achievability than the comps imply.
- What's the recent tenant-quality profile in this submarket — average credit score on applications, eviction rate, late-payment / NSF rate, and stable-employment percentage? A property-management company in the area should have these aggregated.
- How much new for-sale + rental construction is in the pipeline within 1–3 miles? Heavy new supply typically softens prices + rents 12–24 months out; constrained supply supports both.
Investment metrics
- 1% rule
- 1.15% ✓
- Cap rate
- 9.05%
- Cash-on-cash
- 9.86%
- DSCR
- 1.44
- GRM
- 7.2
CMA / ARV
- ARV (median comp)
- $171,265
- List price
- $139,500
- Delta
- -18.55%
- Verdict
- UNDERPRICED
- Comps
- 20 within 1.0 mi
Show comp detail 12 sales within ~0.75 mi
| Address | Dist | Beds/Ba | Sqft | Sold | Price | $/sf | Match |
|---|---|---|---|---|---|---|---|
| 3107 3rd Way NE | 0.49mi | 4/3.0 | 2,289 (-2%) | 2mo | $195,000 | $85 | 72 |
| 2315 4th Pl NE | 0.48mi | 4/2.0 | 2,339 (+0%) | 11mo | $219,900 | $94 | 64 |
| 749 Gable Dr | 0.45mi | 5/3.0 (+1) | 2,390 (+2%) | 8mo | $250,000 | $105 | 63 |
| 104 26th Ave NE | 0.48mi | 5/2.0 (+1) | 2,208 (-5%) | 4mo | $110,000 | $50 | 56 |
| 3042 Wood Cir | 0.41mi | 3/2.5 (-1) | 2,210 (-5%) | 12mo | $239,000 | $108 | 55 |
| 776 Gable Dr | 0.57mi | 3/2.5 (-1) | 2,318 (-1%) | 16mo | $285,000 | $123 | 52 |
| 307 35th Ave NE | 0.70mi | 3/2.0 (-1) | 2,251 (-4%) | 3mo | $189,000 | $84 | 50 |
| 2344 2nd St NE | 0.69mi | 4/2.5 | 2,400 (+3%) | 13mo | $183,000 | $76 | 50 |
| 754 Gable Dr | 0.49mi | 4/2.5 | 2,111 (-10%) | 16mo | $235,000 | $111 | 46 |
| 765 Gable Dr | 0.52mi | 3/2.0 (-1) | 2,038 (-13%) | 2mo | $139,000 | $68 | 44 |
| 5253 Highland Trace Cir | 0.49mi | 3/2.0 (-1) | 2,084 (-11%) | 12mo | $240,000 | $115 | 40 |
| 333 36th Ave NE | 0.71mi | 3/2.0 (-1) | 2,004 (-14%) | 3mo | $245,000 | $122 | 32 |
Match score weights: distance 35% · size 25% · config 20% · recency 20%. Top-matched comps best support the ARV.
Projected returns pro-forma
-3.0% appreciation · 3.04% rent growth · sell at horizon
- IRR
- -1.4%
- Equity multiple
- 0.95×
- Total profit
- $-2,086
- Equity at exit
- $20,800
- IRR
- 8.3%
- Equity multiple
- 1.64×
- Total profit
- $24,824
- Equity at exit
- $12,061
Cash invested: $39,060 (down + closing). Projections, not guarantees.
Landlord ↔ Tenant lean methodology
- Overall (STATE)
- 90 Strongly Landlord-Friendly
- State Alabama
- 90 Strongly Landlord-Friendly · R+15
- County
- — inherits STATE
- City
- — inherits STATE
ZIP-level market 35215
- Home prices YoY
- -34.4%
- Rents YoY
- 3.0%
- Active inventory
- 334
- Price-to-rent
- 7.2×
Monthly cashflow live
- Estimated rent
- $1,605 high interval (Pro) →
- Mortgage (P&I)
- −$732
- Tax from tax record
- −$157 /mo · $1,884/yr
- Insurance
- −$58
- HOA
- −$0
- Vacancy / Maint / Mgmt
- −$337
- Net cashflow
- $321
Break-even live
UW: 25.0% down · 7.5% · 30yr · 1.5% tax · 5.0% vac · 8.0% maint · 8.0% mgmt
Financing live
Cash to close
- Down payment
- $34,875
- Closing costs
- $4,185
- Reserves months
- —
- Total cash needed
- —
Loan-product check · same deal, 3 products live
Conventional
25% down · 7.5% · 30yr
- Down + closing
- —
- Monthly P&I
- —
- Monthly cashflow
- —
- DSCR
- —
- Eligible?
- —
Personal DTI + credit; lowest rate.
DSCR
20% down · 8.5% · 30yr
- Down + closing
- —
- Monthly P&I
- —
- Monthly cashflow
- —
- DSCR
- —
- Eligible?
- —
No personal income docs; deal must DSCR.
Hard money
10% down · 12.0% · 12mo
- Down + closing
- —
- Monthly P&I
- —
- Monthly cashflow
- —
- DSCR
- —
- Eligible?
- —
Short-term bridge; refi at stabilization.
Rent comps 10 comps
| Address | Beds | Baths | Sqft | Rent | $/sqft | DOM | Units | Dist |
|---|---|---|---|---|---|---|---|---|
| 2655 6th St NE Center Point, AL | 3.0 | 2.0 | 1600 | $1,390 | $0.87 | 3d | 1 | 0.14mi |
| 605 Country View Dr Birmingham, AL | 3.0 | 2.0 | 1698 | $1,560 | $0.92 | 43d | 1 | 0.15mi |
| 5010 Darlene Dr Pinson, AL | 3.0 | 2.0 | 1914 | $1,550 | $0.81 | 23d | 1 | 0.99mi |
| 600 20th Ct NE Center Point, AL | 3.0 | 2.0 | 1878 | $1,650 | $0.88 | 23d | 1 | 1.00mi |
| 340 40th Ave NE Center Point, AL | 3.0 | 2.0 | 2007 | $1,650 | $0.82 | 16d | 1 | 1.07mi |
| 5240 Jean Dr Pinson, AL | 4.0 | 2.0 | 1714 | $1,695 | $0.99 | 43d | 1 | 1.10mi |
| 3005 Sweeney Hollow Pl Birmingham, AL | 3.0 | 2.0 | 2014 | $1,325 | $0.66 | 14d | 1 | 1.38mi |
| 3814 Mars Ave Center Point, AL | 4.0 | 2.0 | 2063 | $1,890 | $0.92 | 43d | 1 | 1.39mi |
| 428 26th Ave NW Center Point, AL | 4.0 | 3.0 | 2796 | $1,575 | $0.56 | 43d | 1 | 1.39mi |
| 1819 Valley Run Cir Birmingham, AL | 4.0 | 2.5 | 1694 | $1,761 | $1.04 | 43d | 1 | 1.49mi |
Listing history 20 events
-
2026-06-18status $139,500 Active 41 DOM
-
2026-06-18days on market $139,500 Contingent 41 DOM
-
2026-06-17days on market $139,500 Contingent 40 DOM
-
2026-06-16days on market $139,500 Contingent 39 DOM
-
2026-06-15days on market $139,500 Contingent 38 DOM
-
2026-06-13days on market $139,500 Contingent 36 DOM
-
2026-06-10days on market $139,500 Contingent 33 DOM
-
2026-06-09days on market $139,500 Contingent 32 DOM
-
2026-06-08days on market $139,500 Contingent 31 DOM
-
2026-06-07days on market $139,500 Contingent 30 DOM
-
2026-06-03days on market $139,500 Contingent 26 DOM
-
2026-06-02days on market $139,500 Contingent 25 DOM
-
2026-06-01days on market $139,500 Contingent 24 DOM
-
2026-05-31days on market $139,500 Contingent 23 DOM
-
2026-05-16historical Contingent 72-char remark
-
2026-05-08$139,500 Active 72-char remark
-
2025-01-08price $150,000
-
2020-05-11soldstatus $123,900 Sold
Show marketing remark (71 chars)
Fully rehabbed Investment Property! Ready to cash flow for a new owner!
-
2020-04-16Contingent
Show marketing remark (71 chars)
Fully rehabbed Investment Property! Ready to cash flow for a new owner!
-
2020-04-16$123,900
Show marketing remark (71 chars)
Fully rehabbed Investment Property! Ready to cash flow for a new owner!
ⓘ Source: listings_history table (triggers on properties + properties_extension) + one-shot
backfill from property_details.listing_events for pre-trigger history.
Tax reassessment forecast AL · Resets to sale price
- Current annual tax
- $1,884 · $157/mo
- Projected year-2 tax
- $1,884 · $157/mo
- Expected delta
- $0/yr ($0/mo · 0.0%)
ⓘ Screening estimate from a state-policy table — verify with the county assessor before closing.
Climate risk First Street
- Flood 1/10 Low FEMA zone X (unshaded) · 0% chance over 30 yrs
- Wildfire 3/10 Moderate
- Heat 6/10 Major 7 d/yr ≥105°F today · 19 d/yr by 30 yrs out
- Wind 6/10 Major 27% chance of damaging wind over 30 yrs
- Air quality 5/10 Major 6 unhealthy d/yr today · 11 by 30 yrs out
Nearby sold comps map
Loading sold comps map…
Walkable amenities ~0.75 mi
Loading nearby amenities…
Taxation est. · year 1
- Rental income
- $19,255
- − Mortgage interest
- −$7,814
- − Property taxes
- −$1,884
- − Insurance
- −$698
- − Repairs & maintenance
- −$1,540
- − Management
- −$1,540
- − Depreciation
- −$4,058
- Taxable income
- $1,720
- Est. tax owed @ 24.0%
- −$413
- After-tax cash flow
- $3,438/yr
For passive investors: Depreciation is non-cash, so a rental often shows a tax loss while cash-flowing — sheltering income. Rental losses are passive: they offset passive income freely, and up to $25,000/yr can offset ordinary (W-2) income if you actively participate and your MAGI is under $100k (phasing out to $0 by $150k); unused losses carry forward. On sale, claimed depreciation is recaptured at up to 25%, and gains may owe capital-gains tax (a 1031 exchange can defer both). Figures are a year-1 estimate at your 24.0% rate — not tax advice; consult a CPA.
Schools (NCES district)
- District
- Jefferson County
- NCES district ID
- 0101920
- Math proficiency
- 9% ▼ -24.00%
- Reading proficiency
- 32% ▼ -5.00%
- Median HH income
- $51,712
- Composite
- 18.4/100
- National rank
- #8937
- State rank
- #104 of 129 in AL
Livability — Center Point
- Score
- 63/100
- State rank
- #193
- US rank
- #15671
Category grades
Schools grade is shown separately in the Schools card above.
Census & demographics
- Census place
- Center Point, AL
- County
- Jefferson County · 527,445 people
- City population
- 43,903
- Metro
- Birmingham-Hoover, AL
- Population (ZIP)
- 43,903
- Household income
- $52,793
- Rent vs Own
- Severe rent burden
- 1729.0
Population outlook (Jefferson County) Hauer SSP2
- Today (2025)
- 669,185 people
- By 2030
- 669,694 · +0.1%
- By 2040
- 661,388 · -1.2%
- By 2050
- 643,086 · -3.9%
- By 2075
- 577,267 · -13.7%
- By 2100
- 474,758 · -29.1%
Race, ethnicity, and origin ACS 2023
- Neighborhood character
- Predominantly Black (75%)
- Race & ethnicity
- Black 75% White 15% Hispanic / Latino 7% Two or more races 3%
- Hispanic origin (detail)
- Mexican 4%
- Common ancestry
- Lithuanian 1% Italian 1% Slovak 1%
- Foreign-born
- 4% · Canada
- Languages at home
- 92% English-only · Spanish 7%
Political lean MEDSL · Jefferson
- 2024 margin
- D (+10.4) · D 54.6% · R 44.2% · Other 1.2%
- 2008→2024 swing
- +5.4pp toward D · 2008: 5.1pp · 2024: 10.4pp
- All cycles
- 2024: D+10.4 2020: D+13.2 2016: D+7.2 2012: D+6.0 2008: D+5.1
Not yet ingested
- Civics
- —
Market trends
- HPI YoY
- ▼ -112.97%
- Current HPI
- 215.0607
- Rent YoY
- ▲ 3.04%
- Metro
- Birmingham-Hoover, AL
- State GDP YoY
- ▲ 2.94%
- F500 in state
- 4
Industry mix (Fortune 500 HQ in AL)
| Industry | F500 HQs | Revenue |
|---|---|---|
| Financial Services | 1 | $8B |
|
||
| Healthcare | 1 | $5B |
|
||
Price history
+12.6% since first listed6 events — show timeline
- 2026-05-16 Contingent — Greater Alabama MLS
- 2026-05-08 Listed $139,500 Greater Alabama MLS
- 2025-01-08 Price Changed $150,000 Greater Alabama MLS
- 2020-05-11 Sold (MLS) $123,900 Greater Alabama MLS
- 2020-04-16 Listed — Greater Alabama MLS
- 2020-04-16 Listed $123,900 Greater Alabama MLS
Property tax history
+9.9%/yrLatest (2025): $1,884 · +0.0% YoY. Source: county tax records.
Cash-flow waterfall
monthlySold comps — $/sqft
last 12 mo · ≤1 miLoading sold comps…